Epidemiologic Methods for Investigating Infections in the Healthcare Setting


Epidemiologic Methods for Investigating Infections in the Healthcare Setting


Jennifer H. Han

Ebbing Lautenbach


INTRODUCTION

A sound understanding of the principles and approaches of epidemiology is critical to the study of infectious diseases in the healthcare setting. The urgency of comprehending and applying epidemiological principles is supported by the fact that the incidence and impact of healthcare-associated infections (HAIs) and antimicrobial resistance have increased markedly since the last edition of this textbook. In addition, the applicability of techniques traditionally reserved for healthcare epidemiology has been recognized as uniquely suited to other emerging issues (e.g., patient safety, bioterrorism, drug use management, quality assessment, technology assessment, product evaluation, and risk management) (1,2).

The value of epidemiological methods in the study of HAIs has been recognized for some time now (3,4,5,6). The ability to accurately quantify new patterns of HAIs, design and carry out rigorous studies to identify the factors associated with disease, and devise and evaluate interventions to address emerging issues are vital to the study of HAIs. Indeed, during the past decade, there has been a renewed interest and vitality in efforts to explore previously unstudied aspects of epidemiological methods in the study of HAIs and antimicrobial resistance (3,4,5,6,7).

There are two primary goals of this chapter. The first goal is to review the basic epidemiologic principles relevant to the study of HAIs, including (a) measures of disease frequency, (b) study design, (c) measures of effect, (d) bias, and (e) confounding. The second goal is to discuss in more detail specific current epidemiologic issues in the study of HAIs, including (a) quasi-experimental study design, (b) case-crossover study design, (c) control group selection in studies of antimicrobial resistance, (d) definitions of antibiotic exposure, and (e) assessment of mortality as an outcome of infection. The overriding focus of this chapter is discussion of epidemiologic methods applicable to the study of HAIs and antimicrobial resistance. The reader is also directed to numerous published textbooks solely dedicated to general epidemiology, infectious diseases epidemiology, or statistical analysis (8,9,10,11,12,13,14).


MEASURES OF DISEASE FREQUENCY

Accurately quantifying the frequency of disease is important for measuring the scope of the problem (i.e., how many people are affected by the disease) and for allowing comparison between different groups (i.e., those with and without a particular risk factor of interest). The most commonly used measures of disease frequency are prevalence and incidence.


PREVALENCE

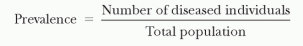
Prevalence is defined as the proportion of people with disease at a given point in time (e.g., the proportion of hospitalized patients who have an HAI). This may also be referred to as the “point prevalence.”


Prevalence, which is a proportion and has no units, depends on both the incidence (i.e., the number of new episodes that develop) and the disease duration (i.e., how long a disease lasts once it has developed). The greater the incidence and duration of disease, the higher the resultant prevalence. Prevalence is useful for measuring the burden of disease (i.e., the overall proportion of persons affected by the disease). Because all populations are dynamic, the prevalence may vary depending on when it is measured. If a dynamic population is at steady state (i.e., cases leaving are equal to cases entering), the prevalence will be constant over time. Surveillance systems in Western European countries have more commonly measured the prevalence rather than the incidence of HAIs at the country and hospital levels (see Chapter 6).


INCIDENCE

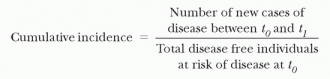
Incidence is defined as the number of new episodes of disease occurring in a specified period of time. Incidence may be described in several ways. Cumulative incidence is defined as the number of new episodes of disease in a particular time period divided by the total number of disease-free individuals at risk of the disease at the beginning of the time period (e.g., the proportion of patients who develop an HAI during hospitalization).


The cumulative incidence, like prevalence, is a proportion and thus has no units. To calculate the cumulative incidence, one must have a complete follow-up on all individuals so that their final disposition with regard to the outcome is known.
Although this measure describes the total proportion of new episodes occurring in a time period, it does not describe when in the time period they occurred. For the cumulative incidence of HAIs, the period implied is the beginning of hospitalization until a first event or until discharge. However, patients do not stay in the hospital and remain at risk for exactly the same period of time. Thus, comparing the cumulative incidence of HAI among patient groups with differing lengths of stay may be very misleading.

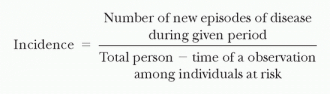
The incidence rate (or incidence density) is defined as the number of new episodes of disease in a specified quantity of person-time of observation among individuals at risk (e.g., the number of HAIs per 1,000 hospital days).


The value of this measure can be seen when comparing infection rates in groups that differ in their time at risk (e.g., short-stay patients vs. long-stay patients). When the time at risk in one group is much longer than in another, the incidence rate is the most convenient way to correct for time. This allows one to separate the effect of time (duration of exposure) from the effect of daily risk. Incidence rate is usually restricted to first events (e.g., the first episode of HAI). It is standard to consider only first events because second events are not statistically independent from first events in the same individuals.

Unlike cumulative incidence, the incidence rate does not assume a complete follow-up of subjects. However, even when the follow-up is complete (and thus cumulative incidence could be calculated), reporting the incidence rate may still be preferable. Cumulative incidence reports only the overall number of new episodes occurring during the period (regardless of whether they occur early or late in the time period). By comparison, the incidence rate, by incorporating the time at risk, accounts for potential difference in time to occurrence of the event.

The assumption in the incidence rate is that all time at risk is equal (e.g., the likelihood of developing an HAI in the first 3 days after hospital admission is the same as the likelihood of developing an infection during days four through six of hospitalization). If all time periods are not equivalent, the incidence rate may be misleading. The Centers for Disease Control and Prevention’s (CDC’s) National Healthcare Safety Network (NHSN) predominantly uses incidence rate calculations rather than prevalence rates (see Chapter 5).


STUDY DESIGN

Various study designs may be chosen when seeking to address a clinical question. These study designs, in order of increasing methodologic rigor, include case report, case series, ecologic study, cross-sectional study, case-control study, cohort study, and randomized controlled trial. Randomized controlled trials, case-control studies, and cohort studies are considered as analytic studies, whereas the other designs are considered as descriptive studies.


ECOLOGIC STUDY

In an ecologic study, one compares geographic and/or time trends of an illness to trends in risk factors (i.e., a comparison of annual hospital-wide use of fluoroquinolones [FQs] with annual prevalence of FQREC). Ecologic studies often use aggregate data that are routinely collected for other purposes (e.g., antimicrobial susceptibility patterns from a hospital’s clinical microbiology laboratory). As a result, one advantage of the ecologic study is that it is often relatively quick and easy to do. Thus, such a study may provide early support for or against a hypothesis. However, one cannot distinguish between various hypotheses that might be consistent with the data. Perhaps most important, ecologic studies do not incorporate patient-level data. With such a study, one knows only that there is a correlation between annual hospital-wide use of FQs and yearly prevalence of FQREC, not that the actual patients infected with FQREC received FQs. Thus, these data may be true but unrelated.


CROSS-SECTIONAL STUDY

A cross-sectional study assesses the status of subjects with regard to the risk factor and disease at the same point in time. A cross-sectional study to investigate FQREC might assess all patients currently hospitalized and whether they have an FQREC infection and whether they are receiving FQs. A cross-sectional study is relatively easy to carry out because all subjects are assessed at only one point in time. As such, this type of study may provide early evidence for or against a hypothesis. A major disadvantage of a cross-sectional study is that it does not capture the concept of elapsed time (i.e., it is not possible to determine whether the risk factor or the outcome came first). Furthermore, a cross-sectional study does not provide information about the transition between health states.


COHORT STUDY

Unlike a case-control study, patients are entered into a cohort study on the basis of the presence or absence of an exposure (or risk factor) of interest (Figure 9.1). These two groups (i.e., those with the exposure and those without the exposure) are then compared to determine whether they differ with regard to the development of the outcome of interest. A cohort study may be either prospective or retrospective, which depends on when it is conducted with regard to when the outcome of interest occurs. If the patients are identified as exposed or unexposed and then followed forward in time to determine whether they develop the outcome, it is a prospective cohort study. If the study is conducted after all outcomes have already occurred, it is a retrospective cohort study. As an example, one might identify all the patients who receive an FQ in the hospital (i.e., the exposed) and compare them to a randomly selected group of patients who do not receive an FQ (i.e., the unexposed). These groups could then be followed forward to determine what proportion of patients in each group develops the outcome of interest (i.e., FQREC HAI).

An advantage of a cohort study is that one may study multiple outcomes from a single risk factor or exposure. Also, this study design allows the investigator to calculate an incidence and a relative risk in comparing the two groups. Potential limitations of a cohort study include substantial time and cost requirements due to an often prolonged follow-up of subjects. In addition, if the outcome is rare, a large number of subjects will need to be followed to ensure an adequate sample size. Finally, the longer the study duration, the more likely the subjects will be lost to follow-up, potentially biasing the study results. Some of these limitations are mitigated in a retrospective cohort study because the outcomes have already occurred and the patients do not need to be followed prospectively.


RANDOMIZED CONTROLLED TRIAL

The randomized controlled trial is very similar to the cohort study (Figure 9.1). However, in a cohort study, patients are enrolled already with or without the exposure of interest. In a randomized controlled trial, the investigator assigns the exposure randomly. This study design, if well designed, provides the most convincing demonstration of causality because the patients in both groups should (provided randomization has worked appropriately) be equal with regard to all important variables except the one variable (exposure) manipulated by the investigator. While randomized controlled trials may provide the strongest support for or against an association of interest, they are costly studies, and there may be ethical issues that preclude their conduct. For example, in studying the association between FQ use and FQREC HAI, one could not ethically assign patients to receive FQ if they did not require the drug. One alternative to the randomized controlled trial is the quasi-experimental study design, which will be discussed in a later section of this chapter.


MEASURES OF EFFECT


RELATIVE RISK (RR)

The relative risk (RR, also called the risk ratio) is the ratio of two probabilities: the probability of the outcome among the exposed divided by the probability of the outcome in the unexposed (Figure 9.2). An RR can be calculated from a cohort study or a randomized controlled trial because from these study designs, one can derive population-based rates or proportions. An RR of 1.0 is called the value of no effect, or the null value. An RR of 2.0 means that the exposed subjects were twice as likely to have the outcome of interest as the unexposed subjects. An RR of 0.5 means that the exposed were half as likely to experience the outcome as the unexposed, indicating a protective effect of the exposure.


ODDS RATIO (OR)

In a case-control study, subjects are enrolled on the basis of the outcome of interest. One then compares these two groups (i.e., those with the outcome and those without it) to determine what proportion of subjects in each group demonstrates a risk factor of interest. Unlike the cohort study, one cannot directly calculate an RR. What one can calculate in a case-control study is the OR, which is defined as the odds of exposure in subjects with the outcome divided by the odds of exposure in subjects without the outcome (Figure 9.2). An OR of 1.0 is called the value of no effect, or the null value.


Figure 9.2. Relative risk and odds ratio.

(Adapted from Lautenbach E. Epidemiological methods in infection control. In: Lautenbach E, Woeltje K, eds. Practical Handbook for Healthcare Epidemiologists. Thorofare, NJ: Slack; 2004:65.)

As noted, one cannot calculate an RR from a case-control study because this type of study offers no insights into the absolute rates or proportions of disease among the subjects. However, in situations in which the disease under study is rare (<10%), the OR derived from a case-control study closely approximates the RR that would have been derived from the comparable cohort study. Figure 9.2 shows how the case-control formula approaches the formula for RR when the rare-outcome criterion is met.


BIAS

Bias is the systematic error in the collection or interpretation of data. The types of bias include information bias (i.e., distortion in the estimate of effect due to measurement error or misclassification of subjects on one or more variables) and selection
bias (i.e., distortion in the estimate of effect resulting from the manner in which the subjects are selected for the study). For example, a common type of information bias in case-control studies is recall bias. One may compare the patients with an FQREC HAI to a random sample of noninfected controls in an effort to identify the risk factors for FQREC HAI. If the patients with an FQREC HAI are aware of their diagnosis, they may be more likely to try to identify the possible reasons for experiencing a resistant infection. If this group is more likely to remember recent antibiotic use than are controls, the association between recent antibiotic use and FQREC HAI will be spuriously strengthened.

The potential for bias must be addressed when the study is designed because it cannot be corrected during the analysis of the study. Indeed, blinding in randomized controlled trials is a commonly used method to minimize the potential for bias in such studies. In addition to evaluating whether a bias may exist, one must also consider the likely impact of the bias on the study results. The bias may be nondifferential (i.e., biasing toward the null hypothesis and making the two groups being compared look artificially similar) or differential (i.e., biasing away from the null hypothesis and making the two groups being compared look artificially dissimilar).


CONFOUNDING

Confounding occurs when the association observed between an exposure and outcome is due, in part, to the effect of some other variable. To be a confounder, a variable must be associated with both the exposure and outcome of interest but cannot be a result of the exposure. Confounding can result in an over- or underestimate of the effect of the exposure of interest. For example, in assessing the association between an FQREC HAI and mortality, one must consider the underlying severity of illness as a potential confounder. Patients with more severe illness are more likely to develop FQREC HAI. In addition, more severe illness also is more likely to result in mortality. Thus, because it is associated with both the exposure and outcome of interest, severity of illness is a potential confounding variable. Unlike bias, a confounding variable may be controlled for in the study analysis. However, to do this, data regarding the presence or absence of the confounder must be collected during the study. Thus, it is also important to consider the potential for confounding variables in the design of the study.


TABLE 9.1 Hierarchy of Quasi-Experimental Study Designs


A. Quasi-Experimental Designs without Control Groups


1. One-group pretest-posttest design


O1 × O2


2. One-group pretest-posttest design using a double pretest


O1 O2 × O3


3. One-group pretest-posttest design using a nonequivalent dependent variable


(O1a, O1b) × (O2a, O2b)


4. Removed-treatment design


O1 × O2 O3 remove × O4


5. Repeated-treatment design


O1 × O2 remove × O3 × O4


B. Quasi-Experimental Designs That Use Control Groups


1. Posttest-only design with nonequivalent groups


image


2. Untreated control group design with dependent pretest and posttest samples


image


3. Untreated control group design with dependent pretest and posttest samples and a double pretest


image


4. Untreated control group design with dependent pretest and posttest samples and switching replications


image


O, observational measurement; X, intervention under study, and time moves from left to right.


In general, studies in category B are of higher study design quality than those in category A. Also, as one moves down within each category, the studies become of higher quality, for example, study 5 in category A is of higher study design quality than study 4, and so on.


Adapted from Harris AD, Lautenbach E, Perencevich E. A systematic review of quasi-experimental study designs in the fields of infection control and antibiotic resistance. Clin Infect Dis. 2005;41:77-82.


SPECIAL ISSUES IN HEALTHCARE EPIDEMIOLOGY METHODS


QUASI-EXPERIMENTAL STUDY DESIGN

Jun 16, 2016 | Posted by in INFECTIOUS DISEASE | Comments Off on Epidemiologic Methods for Investigating Infections in the Healthcare Setting

Full access? Get Clinical Tree

Get Clinical Tree app for offline access