29.1
Introduction
Osteoporosis is a costly, major global public health problem. In the United States (US), 10 million individuals have osteoporosis and another 44 million have low bone mass (or osteopenia) placing them at risk for fractures, which are the most significant consequences of this disease and can be devastating, life altering events . It has been estimated that roughly one in two women and one in four men aged 50 years or older in the US will suffer an osteoporotic fracture in their lifetime . Globally, these numbers are one in three women and one in five men over age 50 .
Osteoporotic fractures are responsible for a substantial clinical and economic burden, both on an individual and societal level. For the individual, personal costs include changes to overall health and quality of life, with impairments in mobility as well as social and physical functioning. There is an increased risk of additional fractures, which is highest in the first 1–2 years following the prevalent fracture but persists for many years thereafter and can compound morbidity . There is also an increased risk of mortality, especially following hip and vertebral fractures . From both an individual and societal perspective, these fractures exact a significant financial toll, causing considerable excess direct and indirect medical costs.
Despite the significance of osteoporotic fractures, their magnitude and importance are underestimated, and osteoporosis itself remains underdiagnosed and undertreated. Numerous studies conducted in the US, Canada, and Europe have consistently found that women tend to underestimate the risk of osteoporosis with respect to risk factors contributing to increased susceptibility to fractures , frequency relative to other diseases (such as cardiovascular disease and breast cancer) , and seriousness of health consequences and outcomes . The financial impact is also underestimated.
The reality is that an estimated 2 million osteoporotic fractures occur each year in the US, resulting in more than 540,000 hospitalizations, more than 935,000 emergency room visits, more than 2,600,000 physician office encounters, and the placement of nearly 180,000 individuals into nursing homes, a situation that most of the participants in a study compared unfavorably to death . In a contemporary research report, approximately 1.4 million Medicare Fee-for-Service (FFS) beneficiaries in the US suffered over 1.6 million osteoporotic fractures in 2015 . Applying the same rate of fractures to Medicare Advantage (MA) beneficiaries would add an additional 700,000 fractures for a total of over 2.3 million new fractures sustained in 2015 by all Medicare beneficiaries (though potential differences in risk characteristics, screening and treatment between Medicare FFS and MA may result in a lower rate among MA beneficiaries) . Fractures of the spine and hip are the most common type of fracture, representing about 40% of total annual fractures, and 23% and 17% of all fractures, respectively .
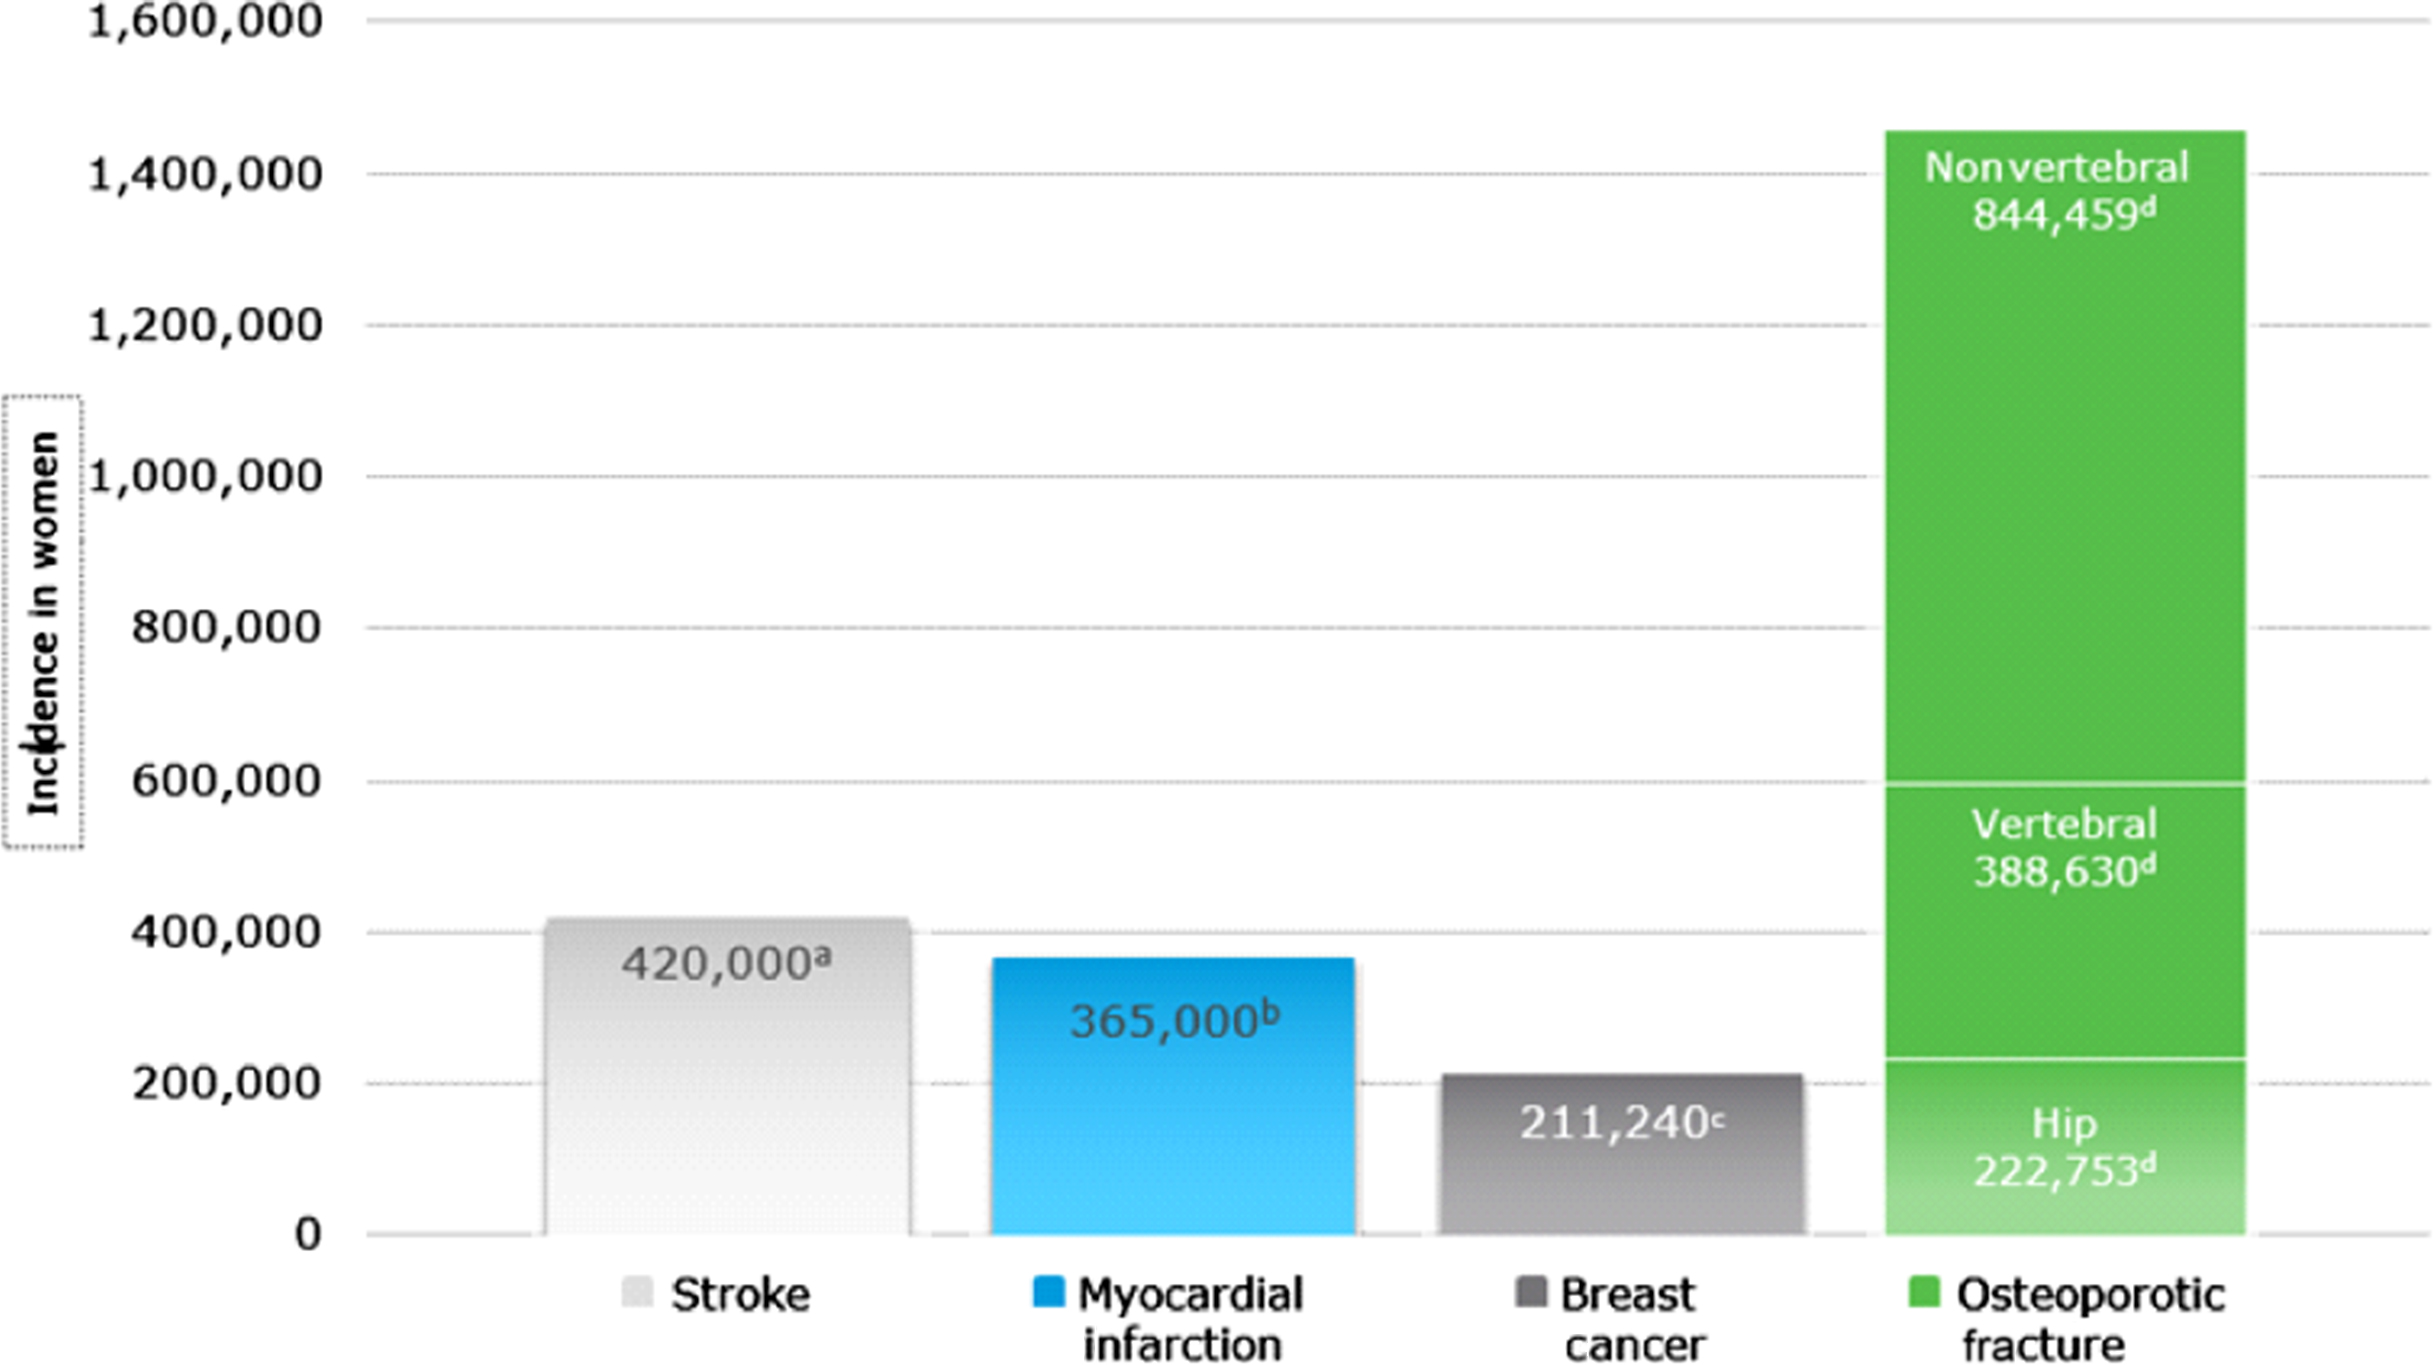
Comparative data show that osteoporotic fractures in women are actually more common than stroke, myocardial infarction (MI), and breast cancer as seen in Fig. 29.1 .
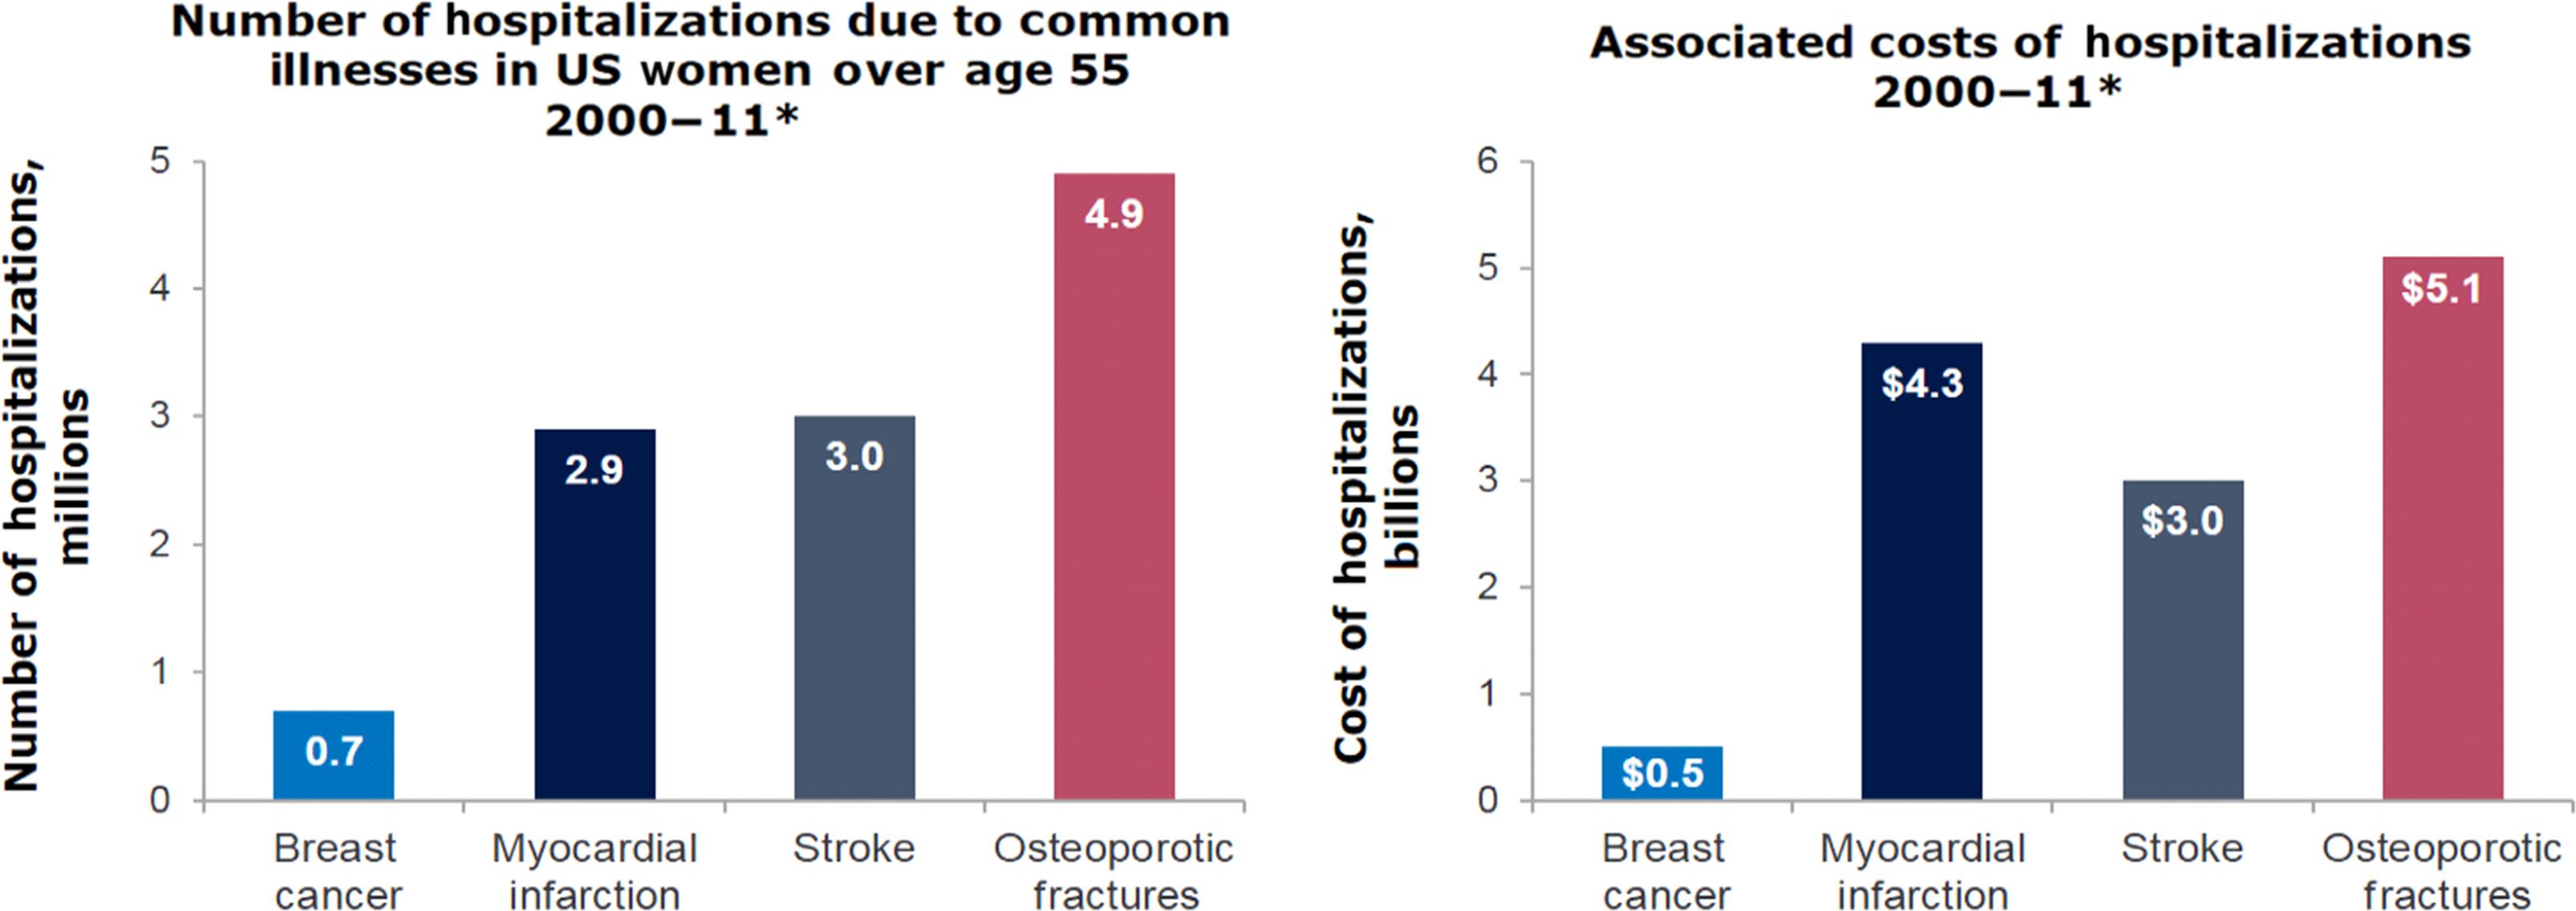
Using the Nationwide Inpatient Sample produced by the US Agency for Healthcare Research and Quality, a nationally representative data set, Singer et al. characterized the incidence and temporal trends of US hospitalizations due to osteoporotic fractures during the period 2000–11 and compared this with corresponding results for MI, stroke, and breast cancer . They also reported the resource utilization burden of hospital lengths of stay and associated costs for those outcomes. These data show that in women 55 years of age and older, the hospitalization burden of osteoporotic fractures is greater than that of MI, stroke, or breast cancer (see Fig. 29.2 ). Indeed, osteoporotic fractures accounted for more than 40% of the hospitalizations in these four outcomes in women age 55 and older and for nearly 50% of the hospitalizations in women age 75 and older . In addition, while the total number of hospitalizations decreased for MI, stroke and breast cancer over the 12-year study period, total hospitalizations for osteoporotic fractures increased . This translates into annual total population facility–related hospital costs that were highest for hospitalizations due to osteoporotic fractures ($5.1 billion), followed by MI ($4.3 billion), stroke ($3.0 billion), and breast cancer ($0.5 billion) (see Fig. 29.2 ).
Finally, a systematic review of the cost of hip fractures globally (1990–2015) revealed that the estimate for total health and social care costs in the first year following hip fracture is $43,669 per patient, which is greater than equivalent estimates for acute coronary syndrome ($32,345) and ischemic stroke ($34,772) .
The impact of osteoporosis has also been assessed by comparing its associated burden on disability with other common noncommunicable and neoplastic diseases using DALYs or disability-adjusted life years lost . DALYs are a measure of overall disease burden expressed as the number of years lost due to early death or ill health and resulting disability in survivors. Globally, osteoporosis accounted for more DALYs than numerous other chronic diseases well established as burdensome to society, including asthma, migraine, hypertensive heart disease, rheumatoid arthritis, peptic ulcer disease, Parkinson’s disease, and benign prostatic hyperplasia . With the exception of lung cancer, the burden of osteoporosis was also greater than for all neoplastic diseases, including colorectal, breast, gastric, and prostate cancers, as well as lymphoma, myeloma, leukemia, and a host of other malignancies .
The high relative disease burden comprised by osteoporosis and osteoporotic fractures, as well as the extraordinary societal and personal costs, pose challenges to the healthcare system, particularly since most patients with osteoporosis and osteoporotic fractures remain untreated . A thorough examination of this condition with respect to healthcare utilization and expenditures is important in determining optimal management in a world of constrained healthcare resources and where there is a need for allocation of these resources across a number of different diseases .
29.2
Economic landscape
29.2.1
Overview
Osteoporosis is responsible for more than $19 billion in direct medical costs every year in the US . This is only the tip of the iceberg, however, as these numbers do not include indirect costs or fully account for the costs of long-term care. Furthermore, there is no single national database that captures all hip, spine, and nonvertebral fractures and estimates how many additional people have fractures without bone mineral density (BMD)–defined osteoporosis . In addition, given an aging population, this economic burden is expected to rise. Many elderly individuals suffering fractures (especially of the hip) face lengthy hospitalizations, require long-term care, and lose their independence . Recent trends in decreased bone density screening , a decrease in the treatment of high-risk patients , and uncertainties about future initiatives to promote bone health may further exacerbate this problem .
More recently, Lewiecki et al. developed a microsimulation forecasting model to project the burden of osteoporosis in US women 65 years of age or older from 2018 to 2040 . Data on baseline characteristics were obtained and risk factor prevalence was estimated by analyzing the National Health and Nutrition Examination Survey, a nationally representative population-based survey conducted every 2 years. Fracture risks were estimated using the Fracture Risk Assessment Tool (FRAX) simplified tables. Based on this model and anticipated population aging and growth, annual osteoporotic fractures were projected to increase from 1.9 to over 3.2 million from 2018 to 2040, an increase of 68% . This amounts to 61.6 million fractures over this 22-year period, with approximately 6.2 million of them being hip fractures . Correspondingly, the annual direct medical costs associated with fractures were estimated to increase from $48.8 to $81.5 billion from 2018 to 2040 . When relevant indirect societal costs related to productivity losses and informal caregiving were included, annual costs increased from $57.0 to $95.2 billion over the same time frame .
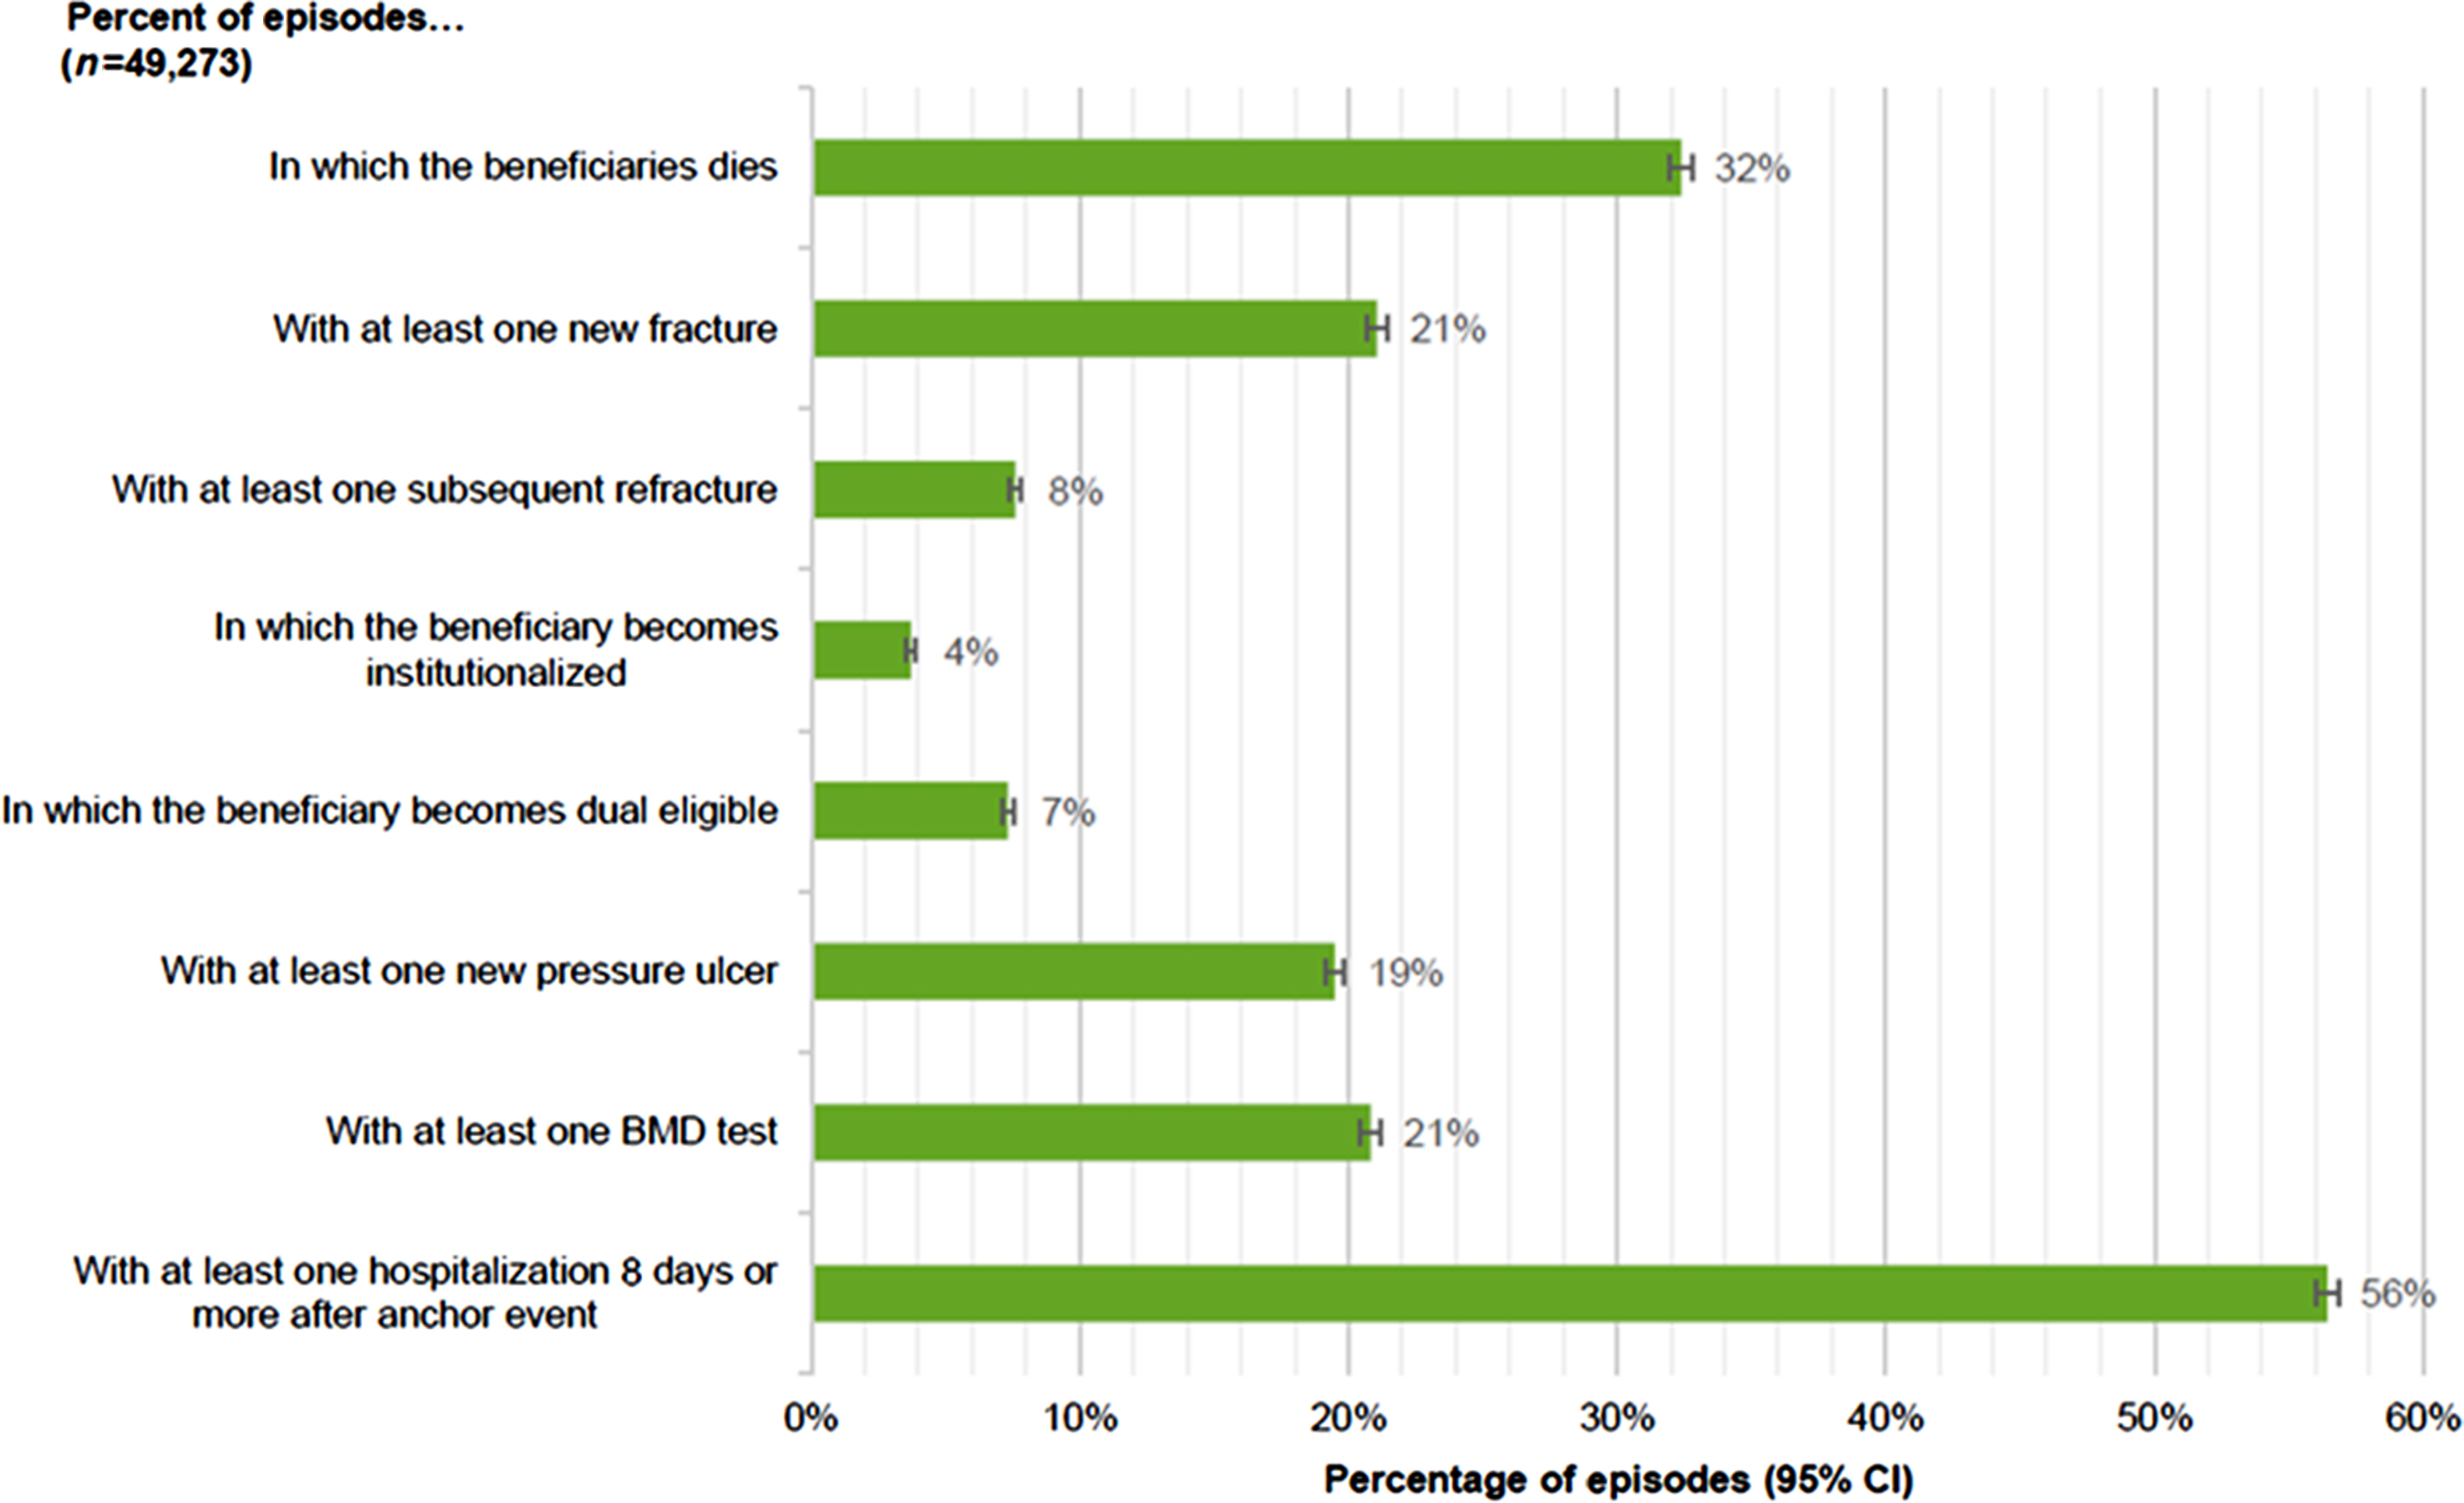
Analysis of a Medicare claims database by the Milliman group demonstrates the impact of osteoporotic fractures on male and female Medicare beneficiaries beyond the extraordinary numbers described previously. As shown in Fig. 29.3 , osteoporotic fractures lead to a host of negative and costly consequences and key postfracture events, including death, inpatient hospitalization, need for institutionalization, and subsequent fractures as well as others, which will be discussed more fully later in this chapter.
29.2.2
Direct costs
Medical care required after an osteoporotic fracture is expensive. Direct costs associated with fractures contribute significantly to this cost and include a number of different categories, such as ambulance encounters, emergency department treatment, inpatient hospitalizations, outpatient office and provider visits, nursing home care, rehabilitation facilities, physical therapy, home health visits, radiology testing, laboratory testing, medications, and orthopedic supplies.
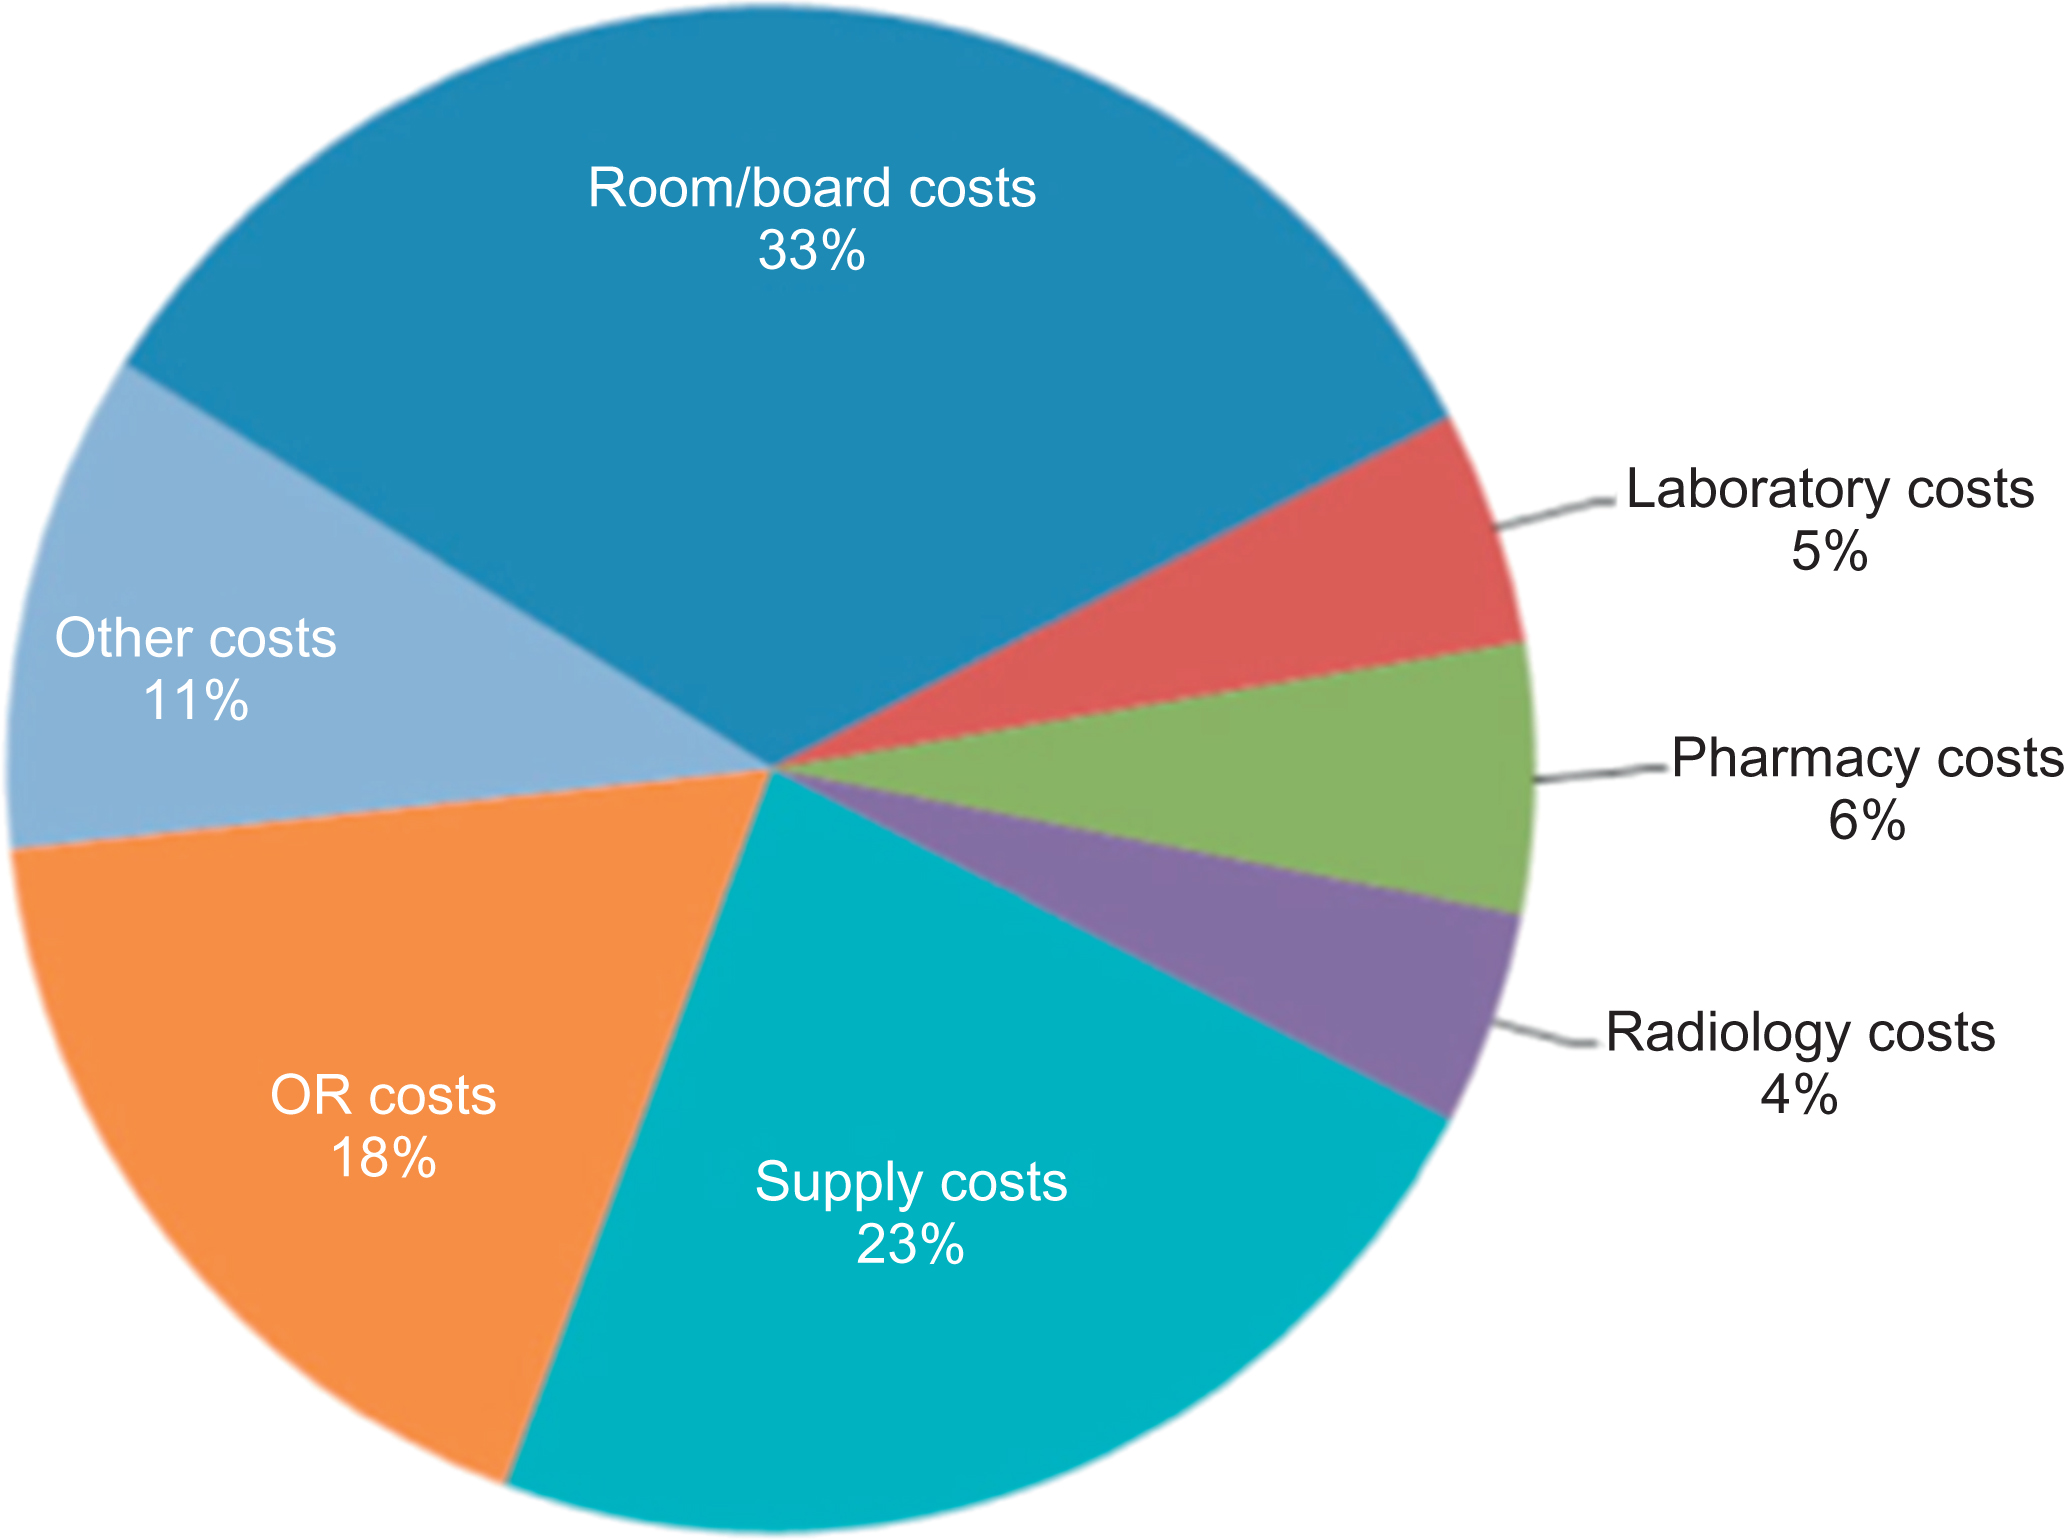
Using the discharge records on over 250,000 patients from over 500 hospitals, levels of resource utilization, healthcare costs, and outcomes associated with osteoporosis-related fractures treated in the hospital have been quantified . The data indicated that fractures treated in the inpatient setting are the primary driver of direct costs, averaging almost $13,000 per patient across all fracture types . As shown in Fig. 29.4 , the majority of hospital cost was attributable to room and board, supplies, and surgical care in the operating room .
Looking specifically at inpatient hospital services, the Milliman report showed that almost half of fracture patients required at least one hospitalization in the first month following their osteoporotic fracture, and 42% experienced an inpatient stay within 1 week . Of patients with hip fractures, 92% were hospitalized within 7 days . For hip fractures, which generally require surgery and have surgical related expenses, an analysis of 2014 Medicare claims suggested that the direct medical cost of providing care for these patients accounted for nearly $6 billion of healthcare spending and just over $50,000 per hip fracture patient . It is, therefore, not surprising that while these fractures represent 14%–17% of all osteoporotic fractures, they account for 72% or more of fracture-related medical expenses, the majority of which are paid by Medicare in the US .
While reliable data are available on the direct costs of hip fractures and to a lesser degree on vertebral fractures, robust data on the costs associated with nonhip, nonvertebral (NHNV) fractures are lacking. What has been shown is that following hip fractures, patients with distal femur and pelvis/sacrum fractures have the highest likelihood of acute hospitalization immediately following the fracture . Femoral fractures have also been shown to have high mean total costs ($16,423–$18,371) , surgery-related costs ($3091) , and supply costs ($4406) , and the longest hospital stay (5.8–6.2 days) . Among patients with vertebral fractures, which are the second most common reason for admission (14%), intensive care unit admissions and mortality are high, and costs and length of stay are higher than among patients with nonvertebral fractures (excluding hip and femur) (see Table 29.1 ).
| Total hospital cost (mean, $) | Length of stay (mean, days) | Hospital mortality (%) | ICU use (%) | |
|---|---|---|---|---|
| All fractures | 12,839 | 5.1 | 1.5 | 7.4 |
| Hip | 14,744–15,845 a | 5.6–5.7 a | 2.1 | 8.7 |
| Femur | 16,423–18,371 a | 5.8–6.2 a | 1.8 | 9.6 |
| Other nonvertebral | 9788 | 4.0 | 0.6 | 4.2 |
| Vertebral | 11,681–13,110 a | 5.3 a –5.4 | 1.5 | 9.5 |
a Data from 2008 to 2011; all costs are inflated to 2011 dollars using the CPI price index.
Analysis of data from a Medicare FFS population showed that annual allowed medical costs in the 12-month period starting with the new osteoporotic fracture were more than twice the costs incurred in the 12-month period prior to the fracture for the same beneficiaries; this included only direct costs identified through an administrative claims database (see Table 29.2 ). For example, for hip fractures, average costs in the year following the fracture (including the fracture itself) were over 200% greater than in the year prior to the fracture . The analysis also indicated that the additional cost in the year following a new osteoporotic fracture was primarily attributed to the cost for inpatient services, both hospital and skilled nursing facilities (SNFs) . Across all beneficiaries who had an osteoporotic fracture in 2015, the cost of inpatient care increased by 131%, or over $9500, between the year prior to the fracture and the year following the fracture . The cost of SNF services increased by 256%, or over $6600, over the same time period, with the average length of stay for SNF admissions increasing by 8% (see Table 29.3 ) .
| Fracture type | All beneficiaries with a new osteoporotic fracture |
|---|---|
| Hip | $47,237 (205%) |
| Distal femur shaft/distal femur | $27,318 (81%) |
| Pelvis/sacrum | $22,980 (93%) |
| Tibia/fibula | $16,798 (87%) |
| Humerus | $19,994 (105%) |
| Radius/ulna | $8474 (54%) |
| Distal radius/ulna | $9630 (67%) |
| Clavicle | $11,397 (55%) |
| Spine | $18,418 (80%) |
| Rib | $12,887 (62%) |
| Total | $21,844 (102%) |
| Service category | All beneficiaries with a new osteoporotic fracture ( n =49,273) |
|---|---|
| Inpatient facility | $9538 (131%) |
| Outpatient facility | $932 (23%) |
| Professional | $2051 (41%) |
| Skilled nursing facility | $6643 (256%) |
| Home health and private duty nursing | $2111 (128%) |
| Other | $569 (66%) |
| Total estimated annual medical cost | $21,844 (102%) |
Stay updated, free articles. Join our Telegram channel

Full access? Get Clinical Tree


