Fig. 1
Planar perfusion scintigraphy in anterior-posterior projection showing a classic segmental wedge-shaped perfusion defect
Only a few years after the introduction of perfusion scintigraphy supplemental ventilation scintigraphy was introduced (Wagner et al. 1968): The patient inhales a radiolabelled gas or aerosol which distributes throughout the ventilated parts of the lungs to depict the ventilation distribution. The method was developed to help differentiate perfusion defects caused by PE (i.e. perfusion defects with retained ventilation; mismatch) from perfusion defects secondary to parenchymal lung disease (i.e. matched defects due to regional hypoxic vasoconstriction causing perfusion defects secondary to ventilation defects) (Fig. 2). Thus, the combined perfusion and ventilation study potentially improves the diagnostic specificity for pulmonary embolism.
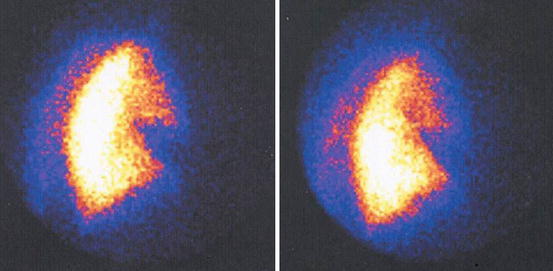

Fig. 2
Planar V/Q-scan in lateral projections showing matched perfusion (left) and ventilation (right) defects
1.1 Tracers and Imaging Technique
Today, technetium-99m-labelled macroaggregated albumin (99mTc-MAA) has replaced the iodine-based perfusion tracers, but otherwise the technique has remained virtually unchanged since 1964. Usually, 200,000–500,000 particles are injected intravenously with the patient in the supine position to limit the effect of gravity on regional pulmonary arterial blood flow. The particles mix uniformly with venous blood and are subsequently distributed homogenously in the pulmonary circulation. The caliber of precapillary arterioles is usually < 15 μm, while 99mTc MAA particles measure between 10 and 90 μm. They cause transient blockage of about 0.1 % of the capillary bed; the biologic half-life of the particles is usually 3–4 h before they are hydrolyzed to smaller particles by enzymatic hydrolysis and cleared by phagocytosis. The administered dose of radioactivity is usually 100–200 MBq yielding an effective dose of 2–3 mSv (mean annual background radiation constitutes ca. 3 mSv worldwide). The dose should be reduced in pregnant women, while the number of particles should be reduced according to weight in children (<35 kg) and may be reduced in patients suspected of right-to-left shunt (to minimize the risk of systemic emboli) or pulmonary hypertension (to reduce the risk of severe pulmonary deterioration as the particles lodge more centrally due to reduced lumen) (Bajc et al. 2009a; Ciofetta et al. 2007).
Ventilation tracers are either gaseous or aerosols. Of the former, the preferred tracer is krypton-81m, a noble gas with a 13 s physical half-life. Thus, is has to be breathed continuously by mask during image acquisition which most patients with impaired respiration can accommodate. However, krypton-81m is produced from rubidium-81 with a physical half-life of 4.7 h, and the generator lifetime is therefore only 1 day which may limit availability due to relatively high costs. Particularly in Europe, an aerosol labelled with technetium-99m (99mTc-Technegas®) is now replacing krypton-81m. It is produced by nebulizing the radiopharmaceutical into a fine mist for inhalation. In contrast to krypton-81m, technetium-99m is widely available and relatively inexpensive. Both have ideal energies for gamma camera imaging, but the aerosols are not always uniformly distributed as their regional distribution in the lungs reflects local ventilation. Furthermore, the ultrafine particles may be caught in mucus in the central airways of COPD patients, and not all patients can cooperate to the relatively deep inhalations required (Bajc et al. 2009a, 2010).
In suspected PE, most centers routinely combine perfusion and ventilation images in corresponding projections (Figs. 3, 4, and 5).
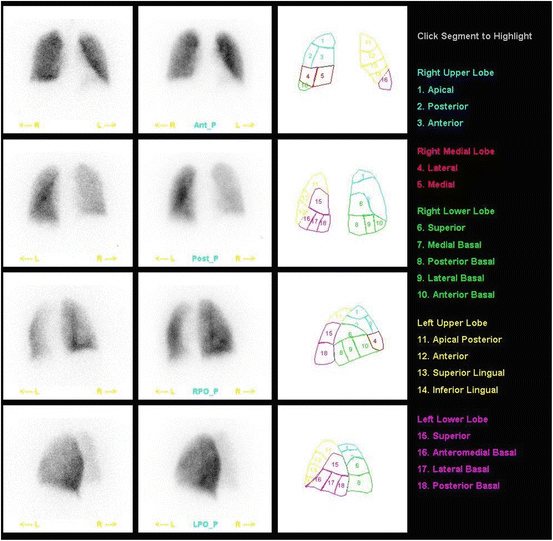
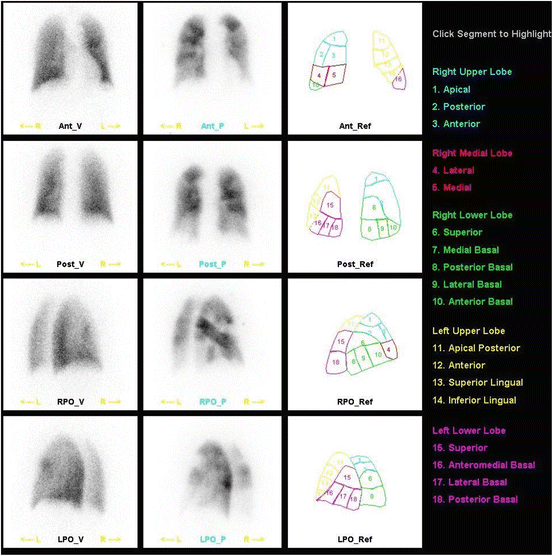
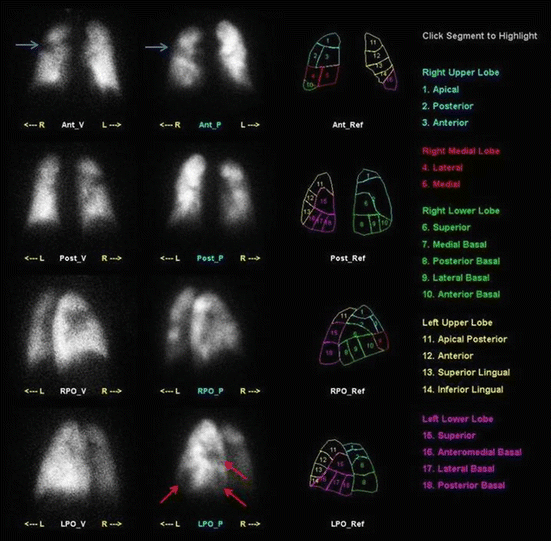

Fig. 3
Normal planar V/Q-scan. Normal distribution of ventilation (left column) and perfusion (right column) with no defects in either scan

Fig. 4
Multiple pulmonary emboli. Normal ventilation (left) but multiple perfusion defects in both lungs (right column), i.e. V/Q mismatch

Fig. 5
Suspected pulmonary embolism in a lung cancer patient. Planar V/Q-scan shows segmental ventilation defect with corresponding matched perfusion defect consistent with the known tumor (blue arrows), but also several perfusion defects (red arrows) in areas with normal ventilation consistent with pulmonary embolism
Images may be acquired as planar (two-dimensional) in which case they should include 4–8 views of the lungs, i.e. anterior and posterior views, right and left lateral views, and right and left posterior oblique views. However, despite numerous projections, planar perfusion imaging may not be sufficient to clearly visualize all segments of the lungs; especially solitary segmental defects in the basal medial segments of the right lower lobe may go undetected. Segments devoid of radioactivity in these regions will be obscured by the radioactivity in the surrounding segments that completely encompass it. Thus, in recent years single photon emission computed tomography (SPECT) imaging has become much more widespread: SPECT enables three-dimensional image acquisition by rotation of the gamma camera around the patient. Images are subsequently reconstructed to be displayed in three projections (i.e. transaxial, sagittal, and coronal), much like conventional CT (Fig. 6).
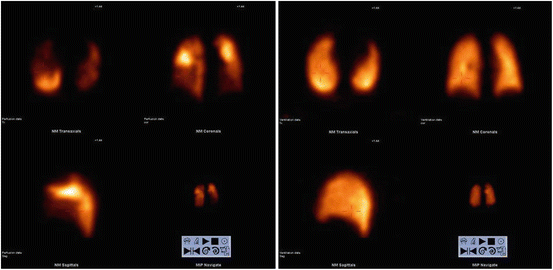

Fig. 6
SPECT V/Q-scan with classic appearance of pulmonary emboli, i.e. multiple perfusionsdefects (left) with normal ventilation (right)
SPECT images may even be co-registered with CT (SPECT/CT) to combine the physiological data from the radiotracer distribution with the radiological (structural) information from CT. The downside of SPECT is longer acquisition time of ca. 30 min for a complete ventilation/perfusion scintigraphy, which may be rather lengthy to lay still and flat for patients with respiratory impairment. The CT acquisition only takes a few minutes.
2 The Value of Planar V/Q-Scan in Suspected Pulmonary Embolism
To date, the comprehensive multicenter Prospective Investigation of Pulmonary Embolism Diagnosis (PIOPED) study from 1990 remains the landmark study on combined V/Q-scan in suspected PE (PIOPED Investigators 1990). It included 933 consecutive patients of which 755 underwent both V/Q-scan and the reference standard pulmonary angiography. V/Q-scans were reported probabilistic, i.e. scan results were divided into four categories based on comprehensive, but somewhat cumbersome interpretation criteria, i.e. high, intermediate, or low probability for PE or normal scans (Table 1).
High probability |
≥2 Large (>75 % of a segment) segmental perfusion defects without corresponding ventilation or roentgenographic abnormalities or substantially larger than either matching ventilation or chest roentgenogram abnormalities |
≥2 Moderate segmental (≥25 % and ≤75 % of a segment) perfusion defects without matching ventilation or chest roentgenogram abnormalities and 1 large mismatched segmental defect |
≥4 Moderate segmental perfusion defects without ventilation or chest roentgenogram abnormalities |
Intermediate probability (indeterminate) |
Not falling into normal, very-low-, low-, or high-probability categories |
Borderline high or borderline low |
Difficult to categorize as low or high |
Single moderate mismatched segmental perfusion defect with normal chest roentgenogram (low probability in the original criteria) |
Low probability |
Nonsegmental perfusion defects (eg, very small effusion causing blunting of the costophrenic angle, cardiomegaly, enlarged aorta, hila, and mediastinum, and elevated diaphragm) |
Single moderate mismatched segmental perfusion defect with normal chest roentgenogram (intermediate probability in the revised criteria) |
Any perfusion defect with a substantially larger chest roentgenogram abnormality (very low probability in the revised criteria) |
Large or moderate segmental perfusion defects involving no more than 4 segments in 1 lung and no more than 3 segments in 1 lung region with matching ventilation defects either equal to or larger in size and chest roentgenogram either normal or with abnormalities substantially smaller than perfusion defects |
>3 Small segmental perfusion defects (<25 % of a segment) with a normal chest roentgenogram (very low probability in the revised criteria) |
Very low probability |
≤3 Small segmental perfusion defects with a normal chest roentgenogram |
Nonsegmental perfusion abnormalities. These are enlargement of the heart or hilum, elevated hemidiaphragm, linear atelectasis, or costophrenic angle effusion with no other perfusion defects in either lung |
Perfusion defect smaller than corresponding radiographic lesion |
>2 matched V/Q defects with regionally normal chest radiograph and some areas of normal perfusion elsewhere in the lungs |
1–3 small segmental perfusion defects (<25 % of a segment) |
Solitary triple matched defect (defined as a matched V/Q defect with associated matching chest radiographic opacity) in the middle or upper lung zone confined to a single segment |
Stripe sign, which consists of a stripe of perfused lung tissue between a perfusion defect and the adjacent pleural surface (best seen on a tangential view) |
Pleural effusion equal to one third or more of the pleural cavity with no other perfusion defect in either lung |
Normal |
No perfusion defects present |
Perfusion outlines exactly the shape of the lungs as seen on the chest roentgenogram (hilar and aortic impressions may be seen, chest roentgenogram and/or ventilation study may be abnormal) |
The results clearly stated that, in conclusive cases, sensitivity and specificity was high: If all abnormal scans (high, intermediate, or low) were considered indicative of PE, sensitivity was 98 %, but specificity only 10 %; which means all PE would be diagnosed and a normal scan would safely rule out the diagnosis. If on the other hand only high probability scans were considered diagnostic for PE, sensitivity was only 41 %, but specificity increased to 98 %; which means not all PE would be diagnosed but a positive scan would be very specific for PE. Thus, a high probability scan accurately diagnoses PE, whereas normal scans safely rules out the diagnosis. Unfortunately, less than half of the scans were in either category with the remainder being intermediate or low probability scans, and both categories are considered non-diagnostic as PE is present in 31 % and 12 % of cases, respectively. The combination of clinical pretest probability and V/Q-scan results could to some extent mitigate these numbers, i.e. in patients with low-probability V/Q-scans and low clinical pretest probability of PE, the negative predictive value was 96 %, but this combination only occurred in a minority of patients. Thus, the conclusions of the study, which still stands today at its 25-years anniversary, were those already mentioned, i.e. in conclusive patients V/Q-scans reliably established and ruled out PE, but in many patients further imaging is necessary. Some additional shortcomings of PIOPED study need to be mentioned. First and foremost, the interpretation criteria are themselves relatively complicated and may therefore seem cumbersome to use in daily clinical practice. They are not based solely on mismatched defects, but a rather intricate assessment which to some extent seems arbitrarily outlined and prone to subjectivity. This is to some extent evident from the inter-observer variability in scan interpretation. As expected, agreement among readers was excellent for normal and high probability scans (92–95 %), but not as good for intermediate and low probability studies. Furthermore, since pulmonary angiography (PA) was omitted for ethical reasons in 176 patients with low probability or normal V/Q-scans, selection bias may have been introduced towards patients with intermediate or high probability scans leading to overestimation of sensitivity and underestimation of specificity (Stein and Gottschalk 1994).
2.1 Later Modifications of Planar V/Q Scan Interpretations
In acknowledgement of the less-than straight forward results obtained in the PIOPED study, the ensuing decades have seen several attempts to optimize the results, by revising interpretation algorithms, or the interpretation criteria themselves. The former include some more or less esoteric findings such as the “triple match” and the “stripe sign”. According to PIOPED, triple matched findings (i.e. matching perfusion, ventilation, and findings on chest x-ray) caries varied prevalence of PE based on location, e.g. 11–12 % in the upper or middle zones of the lung (low probability of PE) and 33 % in the lower zones (intermediate probability of PE) (Worsley et al. 1993). The “stripe sign” (i.e. a rim of perfused lung between the perfusion defect and adjacent pleural surface) was considered low-probability in PIOPED. It was later re-categorized as very low probability (a novel category introduced in 2007 with PPV less than 10 %) and, thus, considered to rule out PE if present as the only finding (Sostman and Gottschalk 1992). Conversely, some findings were later upgraded from low to intermediate probability, e.g. a single, segmental V/Q-mismatch which has been shown to be positive for PE in 36 % of cases (Gottschalk et al. 1993). Nonetheless, these modifications changed little with regard to the overall shortcomings of planar V/Q-scans. Several studies have assessed the interpretative challenges to the clinicians by way of questionnaires; Siegel et al. found the clinician’s interpretation of the probability of PE in patients with intermediate probability ranging from 5 to 75 % (Siegel et al. 2004), whereas Kemper et al. found the clinical significance of intermediate probability misinterpreted in 39 % of patients, and only 11 % was investigated further (Kember et al. 1997). We found similar results in a retrospective survey at our institution as only 14 % of patients with intermediate probability V/Q-scans were further investigated (Marmolin et al. 2009). These results are in opposition to the literature which state the probability of PE in intermediate probability scans to be 30 %, and the various guidelines recommend further investigations in all patients with intermediate probability scans.
The original PIOPED interpretation criteria were revised for the PIOPED II trial (Table 2), which aimed at comparing V/Q-scans with computer tomography angiography (CTA) (Sostman et al. 2008a).
PE present (high probability) |
Two or more segments of V/Q mismatch |
PE absent (normal perfusion or very low probability) |
Nonsegmental perfusion abnormalities; these were enlargement of the heart or hilum, elevated hemidiaphragm, costophrenic angle effusion, and linear atelectasis with no other perfusion defect in either lung |
Perfusion defect smaller than corresponding radiographic lesion |
Two or more matched V/Q defects with regionally normal chest radiograph and some areas of normal perfusion elsewhere in the lungs |
One to three small segmental perfusion defects (<25 % of segment) |
Solitary triple-matched defect (defined as a matched V/Q defect with associated matching chest radiographic opacity) in the mid or upper lung zone confined to a single segment |
Stripe sign (a stripe of perfused lung tissue between a perfusion defect and the adjacent pleural surface; best seen on a tangential view) |
Pleural effusion of one-third or more of the pleural cavity with no other perfusion defect in either lung |
Nondiagnostic (low or intermediate probability) |
All other findings |
CTA was shown to have an overall sensitivity, specificity, PPV, and NPV for PE of 83 %, 96 %, 86 %, and 95 %, respectively. However, the results of CTA were highly influenced by PE location (i.e. PPV of 97 % in main or lobar arteries, 68 % in segmental arteries, and 25 % in subsegmental arteries) as well as clinical pretest probability (i.e. PPV of a positive CTA was > 92 % for high or intermediate clinical probability, but only 58 % in patients with low clinical probability). Likewise, NPV of negative CTA was 96 % in patients with low clinical probability, 89 % with intermediate clinical probability, but only 60 % in patients with high clinical probability. Also, inconclusive CTA due to technically inadequate scans (comprising 51 patients or 6 %) were excluded from data analysis. If these scans were included, the overall sensitivity and specificity would have been 78 % and 90 %, respectively (Goodman et al. 2007). The overall results of CTA were generally comparable to overall results for V/Q-scans, i.e. sensitivity of 78 % (high probability V/Q-scans) and specificity of 98 % (normal scans). Furthermore, based on retrospective analysis of PIOPED II data, Gottschalk et al. introduced the aforementioned very low probability category with overall PPV less than 10 %, a limit considered acceptable by clinicians. Not least thanks to this category, the number of non-diagnostic intermediate probability scans was less than the original PIOPED (74 % had a conclusive V/Q scan); in fact, 56 % of PIOPED II patients was interpreted as very low probability with only 8 % (36 of 440) of these patients having PE and only 3 % (8 of 62) in conjunction with a low clinical pretest probability (Freeman et al. 2008; Gottschalk et al. 2007).
Another approach was the return to earlier practices of assessing perfusion scans only. The PISA-PED study included 890 patients (Miniati et al. 1996) and based their criteria on the shape of the perfusion defect only and comprised few, simple criteria (Table 3).
Abnormal PE+ (PE present) |
Single or multiple wedge-shaped perfusion defects with or without matching chest-roentgenographic abnormalities. Wedge-shaped areas of overperfusion usually coexist |
Abnormal PE− (PE absent) |
Single or multiple perfusion defects other than wedge-shaped, with or without matching chest-roentgenographic abnormalities. Wedge-shaped areas of overperfusion are usually not seen |
Near-normal (PE absent) |
Perfusion defects smaller or equal in size and shape to the following roentgenographic abnormalities: cardiomegaly; enlarged aorta, hila and mediastinum; elevated diaphragm; blunting of the costophrenic angle; pleural thickening; intrafissural collection of liquid |
Normal (PE absent) |
No perfusion defects of any kind |
PE was considered present in PE+ scans and absent in PE-, near-normal, and normal scans, which yielded sensitivity and specificity of 92 % and 87 %, respectively, and there were no non-diagnostic results. At the same time, the patients’ clinical likelihood of PE was categorized as very likely, possible, and unlikely. Combining a PE+ scan with clinically very likely PE, PPV was 99 %, whereas the combination of clinically unlikely PE with a PE- scan yielded a NPV of 97 %. As part of the aforementioned PIOPED II, perfusion scans were reinterpreted using either PIOPED II criteria or PISA-PED criteria. The fraction of non-diagnostic results was 21 % using revised PIOPED II criteria, compared to none when using PISA-PED criteria. The sensitivity of “PE present” reached 85 %, and the specificity of “PE absent” 93 % (modified PIOPED II criteria), whereas PISA-PED criteria yielded sensitivity of 80 % and specificity of 97 %. The authors concluded that perfusion scintigraphy combined with chest radiography is as accurate as CTA with lower cost and lower radiation dose (Sostman et al. 2008b). However, the results of PISA-PED have never been reproduced in any similar setting, and the results rely heavily on skilled chest x-ray interpretation in conjunction with V/Q-scans. Nonetheless, the results indicate that perfusion scans may be viable in patients incapable of performing an adequate ventilation scan.
Stay updated, free articles. Join our Telegram channel

Full access? Get Clinical Tree


