Introduction
Diabetes mellitus (DM) is a syndrome of disturbed energy metabolism involving carbohydrate, protein, and fat brought about by absolute or relative deficiency of insulin secretion, in the context of sensitivity or resistance to insulin actions at various tissue sites. Thus both the extent of impairment in insulin secretion and tissue sensitivity to its actions define the severity of the clinical manifestations, most commonly monitored by the extent of inappropriate fasting and postprandial hyperglycemia. It is the degree of hyperglycemia that leads to the classical symptoms and signs of polyuria, polydipsia, and weight loss. Metabolic disturbances in protein and fat metabolism exist but, in contrast to glucose, are monitored intermittently, not routinely on a daily basis. In time, these metabolic disturbances, if uncontrolled, lead to various micro- and macrovascular complications, such as retinopathy, nephropathy, neuropathy, and large vessel obstruction of peripheral arteries and the heart, which lead to shortening of life span and lower quality of life. The severity and time of appearance of these complications are inversely related to the degree of metabolic control as judged by various parameters, chiefly the degree of hyperglycemia and glucose variability throughout the day. The closer that metabolic control approaches normal, the less likely to occur are the complications.
DM occurs when the normal constant of the product of insulin secretion times insulin sensitivity, a parabolic function termed the disposition index ( Fig. 21.1 ), is inadequate to prevent hyperglycemia and its clinical consequences of polyuria, polydipsia, and weight loss. At high degrees of insulin sensitivity, small declines in the ability to secrete insulin cause only mild, clinically imperceptible defects in glucose metabolism. However, irrespective of insulin sensitivity, a minimum amount of insulin is necessary for normal metabolism. Thus near absolute deficiency of insulin must result in severe metabolic disturbance as occurs in type 1 diabetes mellitus (T1DM). In contrast, with decreasing sensitivity to its action, higher amounts of insulin secretion are required for a normal disposition index. At a critical point in the disposition index curve (see Fig. 21.1 ), a further small decrement in insulin sensitivity requires a large increase in insulin secretion; those who can mount these higher rates of insulin secretion retain normal glucose metabolism, whereas those who cannot increase their insulin secretion because of genetic or acquired defects now manifest clinical diabetes, as typically occurs in type 2 diabetes mellitus (T2DM).

By simultaneously considering insulin secretion and insulin action in any given individual, it becomes possible to account for the natural history of diabetes in that person (e.g., remission in a patient with T1DM or ketoacidosis in a person with T2DM). Thus DM may be the result of absolute insulin deficiency, or of absolute insulin resistance, or a combination of milder defects in both insulin secretion and insulin action. Collectively, the syndromes of DM are the most common endocrine/metabolic disorders of childhood and adolescence. The application of molecular biological tools continues to provide remarkable insights into the etiology, pathophysiology, and genetics of the various forms of DM that result from deficient secretion of insulin or its action at the cellular level.
Morbidity and mortality stem from the metabolic derangements and from the long-term complications. The acute clinical manifestations are fully understood in the context of knowledge of the secretion and action of insulin. Genetic and other etiological considerations implicate autoimmune mechanisms in the evolution of the most common form of childhood diabetes, known as type 1a diabetes . Genetic defects in insulin secretion are increasingly recognized and understood as defining the causes of monogenic forms of diabetes, such as maturity-onset diabetes of youth (MODY) and neonatal DM and contributing to the spectrum of T2DM.
Strong evidence that the long-term complications are related to the degree and duration of metabolic disturbances form the basis of standard and innovative therapeutic approaches for the spectrum of DM syndromes that include newer pharmacological formulations of insulin, delivery by traditional and more physiological means, and evolving methods to continuously monitor blood glucose to maintain it within desired limits by linking these features to algorithm-driven insulin delivery pumps for an “artificial pancreas.”
Classification
DM is not a single entity, but a heterogeneous group of disorders in which there are distinct genetic patterns, as well as other etiological and pathophysiological mechanisms that lead to impairment of glucose tolerance. Box 21.1 outlines an etiological classification of DM in children, based on the “Report of the Expert Committee on the Classification and Diagnosis of Diabetes Mellitus,” published by the American Diabetes Association (ADA) in January of 2018.
- I.
TYPE 1 DIABETES (BETA-CELL DESTRUCTION ULTIMATELY LEADING TO COMPLETE INSULIN DEFICIENCY)
- A.
Immune mediated
- B.
Idiopathic
- A.
- II.
TYPE 2 DIABETES (VARIABLE COMBINATIONS OF INSULIN RESISTANCE AND INSULIN DEFICIENCY)
- A.
Typical
- B.
Atypical
- A.
- III.
GENETIC DEFECTS OF BETA-CELL FUNCTION
- A.
MODY syndromes
- 1.
MODY 1 chromosome 20, HNF4A
- 2.
MODY 2 chromosome 7, glucokinase
- 3.
MODY 3 chromosome 12, HNF1A
- 4.
MODY 4 chromosome 13, IPF-1
- 5.
MODY 5 chromosome 17, HNF-1β
- 6.
MODY 6 chromosome 2q32, neuro-D1/beta-2
- 7.
MODY7-14, see Table 21.14
- 1.
- B.
Mitochondrial DNA mutations (includes one form of Wolfram syndrome, Pearson syndrome, Kearns-Sayre, diabetes mellitus, deafness)
- C.
Wolfram syndrome—DIDMOAD (diabetes insipidus, diabetes mellitus, optic atrophy, deafness): WFS1-Wolframin—chromosome 4p
- 1.
Wolfram locus 2—chromosome 4q22-24
- 2.
Wolfram mitochondrial
- 1.
- D.
Thiamine responsive megaloblastic anemia and diabetes
- A.
- IV.
DRUG OR CHEMICAL INDUCED
- A.
Antirejection—cyclosporine, sirolimus
- B.
Glucocorticoids (with impaired insulin secretion; e.g., cystic fibrosis)
- C.
l -Asparaginase
- D.
β-Adrenergic blockers
- E.
Vacor (rodenticide)
- F.
Phenytoin (dilantin)
- G.
Alfa-interferon
- H.
Diazoxide
- I.
Nicotinic acid
- J.
Others
- A.
- V.
DISEASES OF EXOCRINE PANCREAS
- A.
Cystic fibrosis–related diabetes
- B.
Trauma—pancreatectomy
- C.
Pancreatitis—ionizing radiation
- D.
Others
- A.
- VI.
INFECTIONS
- A.
Congenital rubella
- B.
Cytomegalovirus
- C.
Hemolytic-uremic syndrome
- A.
- VII.
VARIANTS OF TYPE 2 DIABETES
- A.
Genetic defects of insulin action
- 1.
Rabson-Mendenhall syndrome
- 2.
Leprechaunism
- 3.
Lipoatrophic diabetes syndromes
- 4.
Type A insulin resistance—acanthosis
- 1.
- B.
Acquired defects of insulin action
- 1.
Endocrine tumors—rare in childhood
- 1.
- C.
Pheochromocytoma
- D.
Cushing
- E.
Others
- 1.
Antiinsulin receptor antibodies
- 1.
- A.
- VIII.
GENETIC SYNDROMES WITH DIABETES AND INSULIN RESISTANCE/INSULIN DEFICIENCY
- A.
Prader-Willi syndrome, chromosome 15
- B.
Down syndrome, chromosome 21
- C.
Turner syndrome
- D.
Klinefelter syndrome
- E.
Others
- 1.
Bardet-Biedl
- 2.
Alstrom
- 3.
Werner
- 1.
- A.
- IX.
GESTATIONAL DIABETES
- X.
NEONATAL DIABETES
- A.
Transient—chromosome 6q24, KCNJ11 , ABCC8 , INS , HNF1β, o thers
- B.
Permanent—agenesis of pancreas—glucokinase deficiency, homozygous, KCNJ11 , ABCC8 , others (see Ch. 10 )
- A.
Our classification is modified to reflect more accurately the major categories in childhood, including the emergence of T2DM, cystic fibrosis–related diabetes, and drug-induced diabetes—largely from the antirejection drugs cyclosporine, sirolimus, and tacrolimus (formerly FK-506). Table 21.1 presents a summary of the classification originally proposed in 1979 but incorporates the newer criteria for blood glucose values used to diagnose diabetes, impaired glucose tolerance, and gestational diabetes. Current classification of T1DM includes staging: stage 1 is the presence of two or more islet cell antibodies (ICAs), but without any discernible disturbance in glucose metabolism; stage 2 includes positive antibodies plus impaired fasting glucose or impaired glucose tolerance; stage 3 is the presence of glycemic criteria for diabetes together with the clinical manifestations. Among the insulin-dependent forms, severe lack of insulin secretion results most commonly from presumed autoimmune destruction of islets in genetically predisposed hosts. As noted earlier, evidence of autoimmunity may precede by months to years the clinical deterioration to abnormal glucose tolerance. This form is synonymous with type 1a diabetes, formerly called juvenile-onset diabetes . Severe insulin-dependent DM, clinically indistinguishable from the autoimmune form, may, however, not have any evidence of autoimmunity and can result from mitochondrial or other gene defects that interfere with normal insulin secretion or rarely from pancreatic agenesis.
| Category | Criteria |
|---|---|
| Diabetes Mellitus | |
| Type 1 | Typical symptoms: glucosuria, ketonuria; random plasma glucose > 200 mg/dL; ≥ 2 Abs with normal glucose tolerance is now considered start of T1DM; with abnormal glucose tolerance is Stage 2; with clinical symptoms it is Stage 3 |
| Type 2 | Fasting plasma glucose > 126 mg/dL with 2-hour intervening value > 200 mg/dL on OGTT more than once and in the absence of precipitating factors |
| Other types | Type 1 or 2 criteria with genetic syndromes, including maturity-onset diabetes of the young (MODY), neonatal diabetes (NDM), drug therapy; pancreatic disease or other known causes or associations |
| Impaired fasting glucose | Glucose > 100 mg/dL but < 126 mg/dL |
| Impaired glucose tolerance | Fasting plasma glucose < 126 mg/dL with 2-hour > 140 mg/dL but < 200 mg/dL on OGTT |
| Gestational diabetes | Two or more abnormal fasting plasma glucose levels > 105 mg/dL, 1-hour > 180 mg/dL, 2-hour > 155 mg/dL, 3-hour > 140 mg/dL on OGTT |
| Statistical Risk Classes | |
| Previous abnormality of glucose tolerance | Normal OGTT with previously abnormal OGTT, spontaneous hyperglycemia, or gestational diabetes |
| Potential abnormality of glucose tolerance | Genetic propensity (e.g., identical twin with diabetes mellitus); 2 islet cell antibodies is considered prediabetes |
The more severe forms of the MODY syndromes, subsequently detailed, may also require insulin. Clinically similar forms of diabetes may occur secondary to cystic fibrosis from toxic drugs, such as the immunosuppressive agents cyclosporine, sirolimus, and tacrolimus, the rodenticide Vacor, or streptozotocin as used for certain pancreatic islet cell tumors ; with the hemolytic uremic syndrome ; or after pancreatectomy, such as for recurrent pancreatitis or persistent hyperinsulinemic hypoglycemia in infancy. Childhood insulin-dependent diabetes is generally type 1a DM.
Type 1 Diabetes Mellitus
This condition is characterized by severe insulinopenia and dependence on exogenous insulin to prevent ketosis and to preserve life. Thus it was termed insulin-dependent DM (IDDM). The natural history of this disease indicates that there are preketotic noninsulin-dependent phases before and after the initial diagnosis. Although the onset is predominantly in childhood, the disease may occur at any age. Therefore such names as “juvenile diabetes,” “ketosis-prone diabetes,” and “brittle diabetes” were abandoned in favor of the term type 1 diabetes (T1D).
Type 1a diabetes is generally distinct by virtue of its association with certain histocompatibility locus antigens (HLAs) and other genetic markers the majority of which determine the response to self (or exogenous) antigens, for example, cytotoxic T-lymphocyte antigen 4 ( CTLA4 ), autoimmune regulator gene ( AIRE ), variable number of tandem repeats in the insulin gene ( VNTR ), interleukin 2 receptor ( IL2R ) protein tyrosine phosphatase, and protein tyrosine phosphatase nonreceptor type 22 (PTPN22); by the presence of circulating antibodies to cytoplasmic and cell-surface components of islet cells; of antibodies to insulin in the absence of previous exposure to exogenous injection of insulin, of antibodies to glutamic acid decarboxylase (GAD, the enzyme that converts glutamic acid to γ-aminobutyric acid found abundantly in the innervation of pancreatic islets), of antibodies to IA-2 (an islet cell–associated phosphatase) and antibodies to the zinc transporter molecule (ZnT8); by lymphocytic infiltration of islets early in the disease; and by coexistence with other autoimmune diseases. Occasionally, markers of autoimmunity are not found and yet there is profound insulinopenia and dependence on insulin without evidence of a mitochondrial or other genetic defect. In these cases, T1D is considered idiopathic (type 1b). With the exceptions noted, diabetes in children is usually insulin dependent and fits the type 1a category.
Type 2 Diabetes
Persons with this subclass of diabetes (formerly known as adult-onset diabetes , maturity-onset diabetes [MOD], or stable diabetes ) may not be permanently insulin dependent and only occasionally develop ketosis. Some may, however, need insulin to correct symptomatic hyperglycemia—and ketosis may develop in some during severe infections or other stress. Therefore this was previously called noninsulin-dependent DM (NIDDM). This form of diabetes is becoming increasingly prevalent in overweight adolescents, especially those from vulnerable groups, such as Africans, Latinos, Native Indians, and other susceptible ethnic groups.
T2DM is not a single entity. T2DM may be a primary disorder, with inadequate insulin secretion caused by mutations in one of several genes encoding enzymes or transcription factors important to islet cell development and insulin secretion. Several of these defects are now part of the spectrum of the syndromes commonly associated with MODY, which has a dominant mode of inheritance. However, some patients with MODY defects may require insulin from the outset or as they grow older and become insulin resistant, exceeding their ability to compensate by increasing insulin secretion (see Fig. 21.1 ). A defect in the gene regulating glucose transport into the pancreatic beta cell, the GLUT2 transporter, may be responsible for another form of type 2 diabetes (T2D).
Defects in glycogen synthase have also been implicated. A primary defect in insulin receptors—often associated with acanthosis nigricans, postreceptor defects (including Rad [Ras associated with diabetes]), and milder mitochondrial gene defects —also may result in T2D. Secondary causes of T2DM include excessive counterregulatory hormones, especially pharmacological doses of glucocorticoids, antibodies to the insulin receptor, and obesity with impaired insulin secretion.
In T2DM, the serum concentration of insulin compared with lean normal persons may be increased, normal, or moderately depressed depending on whether the defect is one of insulin action or secretion. The onset of T2DM commonly occurs in children generally around the time of puberty or shortly thereafter, but it is recognized that it may occur at any age and is becoming increasingly frequent in childhood and adolescence. In some instances, what appears to be T2DM may actually represent slowly evolving T1DM. In T2D, there is no association with specific HLA antigens, autoimmunity, or various ICAs. However, several genetic abnormalities regulating insulin secretion or action are increasingly implicated in T2DM, so that the genetic architecture of T2DM is complex and remains incompletely understood.
Type 1 diabetes mellitus
Epidemiology
The prevalence of DM is highly correlated with increasing age. Available data indicate a range of one case per 1430 children at 5 years of age to one case in 360 children at 16 years.
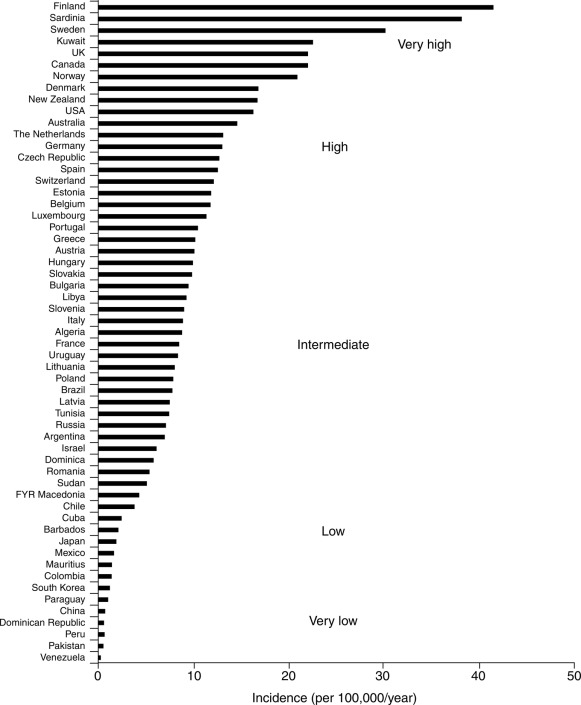
Data on incidence in relation to racial or ethnic backgrounds indicate a range of more than 50 new cases annually per 100,000 population in Finland and Sardinia to about one per 100,000 in China and parts of South America ( Fig. 21.2 ). In all examined areas, there appears to be an increasing incidence of T1DM of about 2% to 3% per year. However, the incidence of T1DM in Finland was reported to have peaked and slightly declined with similar data from Norway indicating the increase in incidence may be waning.
In the United States, the occurrence of type 1 in Africans had previously been reported to be only between one-third and two-thirds of that in Caucasians. More recent data suggest that the incidence of DM in African Americans is increasing. However, whether some of this reported increase in incidence among African Americans is exclusively type 1 or includes cases of type 2 presenting in ketoacidosis and thus misclassified remained unclear. The most recently available information indicates an annual incidence in the United States of 20 to 25 cases per 100,000 of the childhood population with a significant increase of T1DM in all groups, including African-American (see IDF Diabetes Atlas 9th Edition 2019 www.diabetesatlas.org ).
Males and females appear to be almost equally affected. There is no apparent correlation with socioeconomic status. Peaks of presentation occur in two age groups: at 5 to 7 years of age and at the time of puberty. The first peak corresponds to the time of increased exposure to infectious agents coincident with the beginning of school. The latter corresponds to the pubertal growth spurt induced by increased sex steroids, as well as pubertal growth hormone secretion that antagonizes insulin action. The incidence of T1D is increasing worldwide, most prominently in certain populations (e.g., Finland) and in certain age groups (especially those aged < 5 years). As mentioned, there appears to be a plateau in incidence reported from Finland and Norway. In younger patients, onset appears to be more abrupt and the extent of immune markers is less apparent than in older children. Type 1b diabetes with abrupt onset, less evidence of autoimmunity, and indicators of viral infection (including evidence of pancreatitis) have been described in Japan.
Seasonal and long-term cyclical variations have been noted in the incidence of T1D. Newly recognized cases appear to occur with greater frequency in the autumn and winter in the northern and southern hemispheres. Seasonal variations are most apparent in the adolescent years. There is no consistent pattern linking long-term cyclicity with the incidence of viral infections; however, there was a definite increased incidence of diabetes in children with congenital rubella. These changing patterns in incidence and associations with viral infections suggest a potential role for viruses or other microbial agents or their products as direct or indirect triggering mechanisms for inducing T1DM in a susceptible host. Detection of a low-grade enteroviral infection in the islets of Langerhans of patients with new-onset diabetes and the hyperexpression of HLA class 1 antigens on islet cells as a defining feature of T1D lend further credence to the possibility of viral infections as a potential trigger for autoimmunity leading to DM in the genetically predisposed host.
Etiology, Pathogenesis, and Genetics
The cause of the initial clinical findings in this predominant form of diabetes in childhood is the sharply diminished secretion of insulin. Although basal insulin concentrations in plasma may be normal in newly diagnosed patients, insulin secretion in response to a variety of potent secretagogues is blunted and usually disappears over a period of months to years. In certain individuals considered at high risk for the development of T1D, such as the nonaffected identical twin of a diabetic, a progressive decline in insulin-secreting capacity has been noted for months to years preceding the clinical appearance of symptomatic diabetes that usually manifests when insulin-secreting reserve is 20% or less than normal for that individual ( Fig. 21.3 ). The idealized schema of steady decline in insulin secretion shown in Fig. 21.3 should not be construed as factual; periods of recovery and steeper declines may occur but eventually lead to significant reduction in insulin secretory capacity.

The mechanisms that lead to failure of the function of pancreatic beta cells point to autoimmune destruction of pancreatic islets in predisposed individuals. T1D has long been known to have an increased prevalence among persons with such disorders as Addison disease and Hashimoto thyroiditis, in whom autoimmune mechanisms are known to be pathogenic. These conditions, as well as T1DM, are known to be associated with an increased frequency of genes involved in the regulation of immunity, including the autoimmune regulator gene AIRE , PTPN22 , CTLA4, and the INS gene itself, as well as certain HLAs—in particular, DR3 and DR4. Located on chromosome 6, the HLA system is the major histocompatibility complex—consisting of a cluster of genes that code transplantation antigens and play a central role in immune responses.
Increased susceptibility to a number of diseases has been related to one or more of the identified HLA antigens. The inheritance of HLA DR3 or DR4 confers a twofold to threefold increased risk for developing T1D. When both DR3 and DR4 are inherited, the relative risk for developing diabetes is increased 7- to 10-fold. Application of newer molecular genetic techniques has revealed further heterogeneity in the HLA D region among individuals with and without diabetes despite possessing the DR3 or DR4 markers, suggesting the participation of other susceptibility loci within these markers.
Extensive genome-wide scans of markers associated with T1DM have uncovered more than 40 loci considered to confer susceptibility ( Table 21.2 ). Some of these loci are confirmed and replicated by at least three different datasets. Others are suggestive but as yet not definitively linked. The strongest markers are those on chromosomes 6 and 11 (IDDM1 and IDDM2), respectively, linked to the HLA DQ β chain and the insulin gene itself.
| Loci | Approx. Relative Risk | Effect On |
|---|---|---|
| HLA | 6.5 | Immunity |
| INS | 2.3 | Insulin production, metabolism and immunity |
| PTPN22 | 2.0 | Immunity |
| ILR2A | 1.5 | Immunity |
| SH2BE | 1.3 | Immunity |
| ERBB3 | 1.3 | Insulin production and metabolism |
| PTPN2 | 1.25 | Immunity |
| CLEC16A | 1.20 | Unknown function |
| CTLA4 | 1.20 | Immunity |
| IL18RAP | 1.20 | Immunity |
| PTPN2 | 1.20 | Immunity |
| OCR5 | 1.20 | Immunity |
| IFIHI | 1.20 | Immunity |
| CTSH | 1.20 | Unknown |
| CD226 | 1.10 | Immunity |
| IL2RA | 1.10 | Immunity |
| PRKCQ | 1.10 | Immunity |
| IL2 | 1.10 | Immunity |
| BACH2 | 1.10 | Immunity |
| UBASH3A | 1.10 | Immunity |
| RGS1 | 1.10 | Immunity |
| IL7RA | 1.10 | Immunity |
| CITNF6 | 1.10 | Unknown |
| TNFAIP3 | 1.10 | Beta-cell apoptosis protection |
| TAGAP | 1.10 | Immunity |
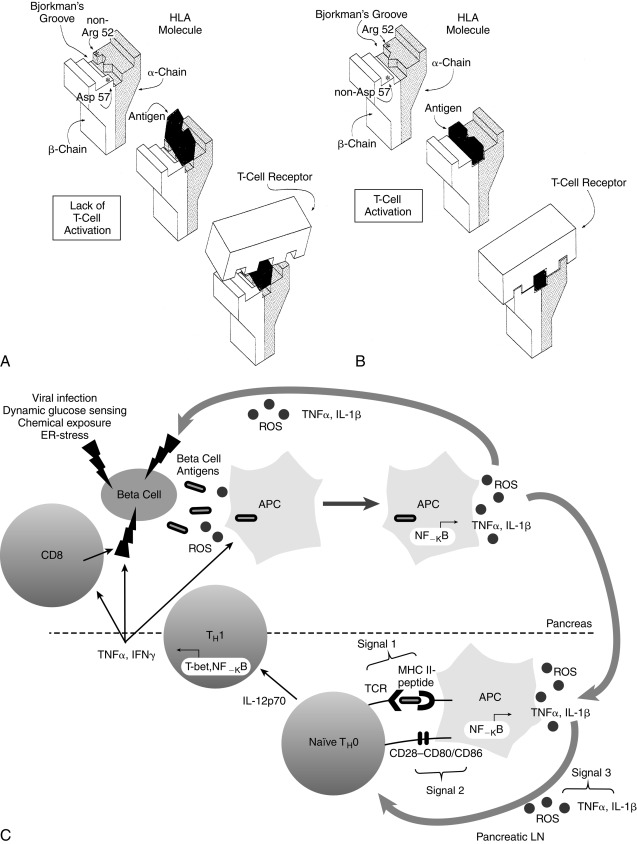
In IDDM1, the homozygous absence of aspartic acid at position 57 of the HLA DQ b chain (non-Asp/non-Asp) confers an approximately 100-fold relative risk for developing T1D. Those who are heterozygous with a single aspartic acid at position 57 (non-Asp/Asp) are no more susceptible than individuals who contain aspartic acid on both DQ b chains (i.e., homozygous Asp/Asp; Table 21.3 ). Some studies suggest that T1DM is proportional to the gene frequency of non-Asp alleles in that population. In addition, arginine at position 52 of the DQ a chain confers marked susceptibility to type 1. Position 57 of the DQ b and position 52 of the DQ a chains are at critical locations of the HLA molecule that permit or prevent antigen presentation to T-cell receptors and activate the autoimmune cascade ( Fig. 21.4 ). The importance of these and additional amino acid substitutions in HLA DQ and DR in facilitating antigen presentation and contributing to risk for development of diabetes has been confirmed.
| Phenotype | Diabetic (%) | Nondiabetic | Odds Ratio |
|---|---|---|---|
| DR (Serology) | |||
| DR3/DR4 | 33 | 6 | 8.3 |
| DR3/DR3 | 7 | 1 | 9.8 |
| DR3/DRX | 7 | 14 | 0.05 |
| DR4/DR4 | 26 | 0 | — |
| DR4/DRX | 22 | 16 | 1.5 |
| DRX/DRX | 4 | 63 | 0.02 |
| DQ (Molecular Probes) | |||
| Non-Asp/non-Asp | 96 | 19 | 107.2 |
| Non-Asp/Asp | 4 | 46 | 0.04 |
| Asp/Asp | 0 | 34 | 0 |
IDDM2 is a polymorphic marker near the transcription start site of the insulin gene, giving rise to VNTR at the promoter end of the insulin gene on chromosome 11. Each tandem repeat element consists of an approximately 14-bp deoxyribonucleic acid (DNA) segment with a consensus nucleotide sequence. The number of repeats ranges from about 25 to about 200, and the three classes of alleles are based on overall size. Class I insulin VNTR consists of 26 to 63 repeats and confers susceptibility, whereas class III consists of 140 to 200 or more repeats and is protective of diabetes. Together, the gene markers on chromosomes 6 and 11 (i.e., IDDM1 and IDDM2) account for 50% to 60% of the heritability of T1D. However, combinations of certain DQ alleles in association with certain DR alleles may confer susceptibility or protection to the development of T1D (see Table 21.3 ).
In addition, other as yet undefined genetic factors play a role because the same high-risk genotypes are about sixfold more likely to develop diabetes in an individual with a positive family history than in one without a family history without T1D ( Table 21.4 ). Investigation of four genome-wide linkage scans in close to 1500 families with more than one affected member having T1DM identified several susceptibility loci. Of these, about 40% can still be attributed to allelic variation of HLA loci, and the influence of the VNTR in the insulin gene was confirmed.
| High-Risk Genotypes | Risk in an Individual With This Genotype |
|---|---|
| DQB1p0302 (DQ3.2) | 1 in 60 |
| DQ3.2/DQ2 (DR3) | 1 in 25 |
| DQB1p03021 family history of IDDM | 1 in 10 |
| DQ3.2/DQ2 (DR3)1 family history of IDDM | 1 in 4 |
| Complete sharing of both HLA haplotypes | 1 in 2 a |
In addition, the CTLA4 gene on chromosome 2 and PTPN22 gene on chromosome 1p13 were found to contribute significantly to predisposition to T1DM. However, the genome scan identified other potential loci conferring susceptibility on chromosomes 2q31-q33, 10p14-q11, and 16q220q24 and a locus on the long arm of chromosome 6 (6q21) distinct from the HLA region on 6p21. The precise genes in these regions that may predispose to T1DM have not been identified as yet, although some have been excluded and newer candidate genes—such as CBLB interacting with CTLA4 , the decay-accelerating factor gene ( daf , a complement inhibitor), and the interleukin 2a receptor IL2R—are under scrutiny. Reviews of the genetics of T1DM have received considerable attention and a genetic risk score predicts progression of islet cell autoimmunity and clinical diabetes in those at risk. These considerations provide a rational framework for the long-recognized association of type 1 diabetes with genetic factors on the basis of the increased incidence in some families, of the concordance rates in monozygotic twins, and of ethnic and racial differences in prevalence. From multiple family pedigrees and HLA typing data, it has been estimated that if a sibling shares both HLA D haplotypes with an index case, the risk for that individual is 12% to 20%; for a sibling sharing only one haplotype, the risk for IDDM is 5% to 7%; and with no haplotypes in common, the risk is only 1% to 2%. HLA typing is not recommended for routine practice, but for purposes of genetic counseling it can be safely assumed that in whites, the overall recurrence risks to siblings is approximately 6% if the proband is younger than 10 years of age and 3% if older at the time of diagnosis. The risk to offspring is 2% to 5%, with the higher risk in the offspring of a diabetic father.
Factors other than pure inheritance must also be involved in evoking clinical diabetes. For example, DR3 or DR4 is found in approximately 50% of the general population and non-Asp/non-Asp is found in approximately 20% of white nondiabetics in the United States. However, the risk for T1D in these subjects is only 1/10th that in an HLA-identical sibling of an index case with T1D possessing these markers. Even siblings sharing only one haplotype have a 6- to 10-fold greater risk of developing type 1 compared with the normal population (see Table 21.4 ).
Importantly, approximately 10% to 15% of patients with type 1 do not have HLA DR3 or DR4 (see Table 21.3 ). Most compelling is the fact that the concordance rate among identical twins of whom one has insulin-dependent diabetes is only about 50%, suggesting the participation of environmental triggering factors or other genetic factor, such as the postnatal selection of certain autoreactive T-cell clones that bear receptors recognizing “self.” This postnatal process occurs within the thymus and implies that identical twins are not identical with respect to the T-cell receptor repertoire they possess. Identical twins discordant for diabetes have also been shown to possess differential methylation in immune effector cell types suggesting a role for epigenetics in the risk for developing diabetes. Triggering factors might include viral infections. In animals, a number of viruses can cause a diabetic syndrome, the appearance and severity of which depend on the genetic strain and immune competence of the species of animal tested. In humans, epidemics of mumps, rubella, and coxsackie virus infections have been associated with subsequent increases in the incidence of T1D. The acute onset of DM, presumably induced by coxsackievirus B4, has been described. The viruses may act by directly destroying beta cells, by persisting in pancreatic beta cells as slow viral infections, or by triggering a widespread immune response to several endocrine tissues. Low-grade enteroviral infection in the pancreas of newly diagnosed patients with T1D and hyperexpression of HLA class 1 antigen in islet cells as a defining feature of T1DM adds to the evidence for a potential role of viral triggering of the autoimmune processes. A superantigen response may be involved in triggering T cells, bypassing the classic presentation by antigen-presenting cells (APCs) of the processed antigen in the context of restricted HLA molecules to T-cell receptors. Some viruses and certain endotoxins or exotoxins are capable of inducing a superantigen response. In addition, the virus may induce initial beta-cell damage—which results in the presentation of previously masked or altered antigenic determinants. It is also possible that the virus shares some antigenic determinants with those present on or in beta cells, including GAD, such that antibodies formed in response to the virus may interact with these shared determinants of beta cells, resulting in their destruction, an example of molecular mimicry.
Nitrosamines and early exposure to cow’s milk have been suggested as factors that may trigger diabetes in those genetically at risk, thus explaining the reported lower incidence of diabetes among exclusively breastfed infants. This was the basis for a primary prevention study: the trial to reduce insulin-dependent diabetes in those genetically at risk (TRIGR). However, in those who were genetically at risk, the TRIGR study failed to show a significant reduction in development of diabetes via delay or exclusion of cow’s milk.
Antecedent stress and exposure to certain chemical toxins have also been implicated in the development of T1D. Although the rodenticide Vacor has been a cause of diabetes in individuals deliberately or inadvertently poisoned by this agent, some of these patients had ICAs, suggesting that such antibodies are secondary to islet damage or that evolving type 1 disease preceded the drug ingestion. Nitrosamines in cured meat have also been implicated in T1D, as have other environmental toxins.
Evidence supports an autoimmune basis for the development of T1D, but why the beta cell is the specific target remains a mystery. Is the pancreatic beta cell the sole target of immune destruction (homicide) or a contributor to its own demise (suicide)? Histological examination of pancreas from patients with type 1 who die of incidental causes has revealed lymphocytic infiltration around the islets of Langerhans. Later, the islets become progressively hyalinized and scarred, a process suggesting an ongoing inflammatory response that is possibly autoimmune. However, these changes are often patchy in distribution, so that areas that appear to contain normal beta cells are interspersed with areas of beta-cell destruction, similar to the patchy distribution of depigmentation found in vitiligo. Some 80% to 90% of newly diagnosed patients with T1D have ICA directed at cell-surface or cytoplasmic determinants in their islet cells. The prevalence of these antibodies decreases with the duration of established disease. In contrast, after pancreatic transplantation, ICA may reappear in patients whose sera had become negative for ICA before transplantation. Together, these findings suggest that ICA disappears as the antigens intrinsic to pancreatic islets are destroyed and reappear when fresh antigen (transplanted islets) is presented.
Studies in identical twins and in family pedigrees demonstrate that the existence of ICA may precede by months to years the appearance of symptomatic T1D. In vitro, ICA may impair insulin secretion in response to secretagogues and can be shown to be cytotoxic to islet cells—especially in the presence of complement or T cells from patients with T1D. About 80% of patients may have antibodies to GAD, and 30% to 40% of newly diagnosed patients have spontaneous antiinsulin antibodies at initial diagnosis. These antibodies may be detected months to years before clinical diabetes becomes apparent. A more recently described antibody, the zinc transporter, ZnT8, appears to be a major marker for progressive impairment of beta-cell function. There is also evidence of abnormal T-cell function with an alteration in the ratio of suppressor (regulatory) to killer T cells at the onset of the disease. Thus the ability of Treg to modify the activity of T effector cells in causing beta-cell destruction is an area of investigation. These findings suggest that T1D (akin to other autoimmune diseases, such as Hashimoto thyroiditis) is a disease of “autoaggression” in which autoantibodies in cooperation with complement, T cells, cytokines, FAS, and FAS ligand, and other factors, induce apoptosis or destruction of the insulin-producing islet cells.
Thus the inheritance of certain genes (such as those associated with the HLA system on chromosome 6 or other immunoregulatory or immunomodulatory genes) appears to confer a predisposition for autoimmune disease—including diabetes—when triggered by an appropriate stimulus, such as a virus. Evidence of superantigen-triggered T-cell receptor activation was discussed earlier.
Although it is understood that some insulin-dependent diabetic patients have none of the frequently associated HLA antigens, the evidence for an immune basis of islet cell destruction is sufficiently compelling to have fostered several studies of different immunosuppressive agents in the treatment of newly diagnosed diabetics. None of these immunosuppressive or immunomodulatory trials has had long-term positive outcome, and some agents (e.g., cyclosporine) have proven toxic to beta cells. Although newer approaches are being attempted, all must be considered as experimental and not be viewed as established or recommended therapy. The Diabetes Prevention Trial for T1DM [DPT1] was a multicenter randomized but nonblinded study using daily subcutaneous insulin and an annual admission for intravenous [IV] insulin infusion in first-degree relatives with proven risk factors for developing T1DM. Whereas prediction was highly accurate in identifying those most likely to develop T1DM within 5 years of entering the study, insulin injections had no protective effect to prevent the appearance of T1DM. Figs. 21.3 and 21.4 summarize current concepts of the cause of T1D as an autoimmune disease, the tendency for which is inherited and in which autoimmune destruction of beta cells is triggered by an as yet unidentified agent (possibly a virus). The slope of decline in insulin varies, and there may be periods of partial recovery such that the course of decline in insulin secretion is bumpy rather than smooth. The point at which clinical features appear corresponds to approximately 80% destruction of insulin secretory reserve. This process may take months to years in adolescent and older patients, and weeks in the very young patient in whom acute destruction by nonautoimmune mechanisms may play a significant role. Higher titers of spontaneous antiinsulin antibodies and ICA are characteristic of more active islet cell destruction, typically in the younger patient, and may prove useful in predicting evolving diabetes.
Prediction and Prevention
Although no presently available single marker or test can accurately predict T1DM, evidence suggests that a combination of immune and genetic markers for T1D may provide predictability. Some authorities suggest that T1D is a predictable disease, but other authorities have raised objections because predictability is not as robust in their studies. Definitive preventive therapy is not available, thereby raising ethical dilemmas, and it is emphasized that the majority of new cases occur sporadically, in the absence of a positive family history in a first-degree relative.
Most predictive studies have been performed in first-degree relatives of patients with new-onset T1D. Nevertheless, there is increasing evidence that the presence of high titers of islet cell, GAD, IA2, ZnT8, and insulin autoantibodies combined with a consistently diminished first-phase response of insulin to a pulse of IV glucose (corresponding to the ≤ 5th percentile for age in insulin response) can be used to reliably predict the onset of type 1 disease.
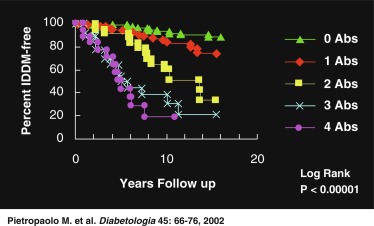
Fig. 21.5 demonstrates that in a set of first-degree relatives, conversion to T1D was highly dependent on the number of antibodies detected in their sera. Of those with three antibodies, about half developed clinical diabetes within 5 years of follow-up. First-phase insulin response and genetic (HLA) markers may be used to augment the predictability. For example, Table 21.5 demonstrates that the relative risk of developing clinical diabetes within 4 years of detecting ICA is almost 230 among those who possess all four heterodimers in HLA DQ β that predispose to diabetes (i.e., Asp57 2/2 and Arg52 1/1).
| ICA Negative | ICA Positive | |||||||
|---|---|---|---|---|---|---|---|---|
| Diabetic heterodimers (dH) | 0 | 1 | 2 | 4 | 0 | 1 | 2 | 4 |
| Developed IDDM after 4 years | 12 | 16 | 37 | 12 | 12 | 18 | 29 | 15 |
| Relative risk | 1.0 | 2.9 | 8.6 | 25.4 | 9.0 | 26.5 | 78.0 | 229.3 |
As technological improvements continue, it is likely that population-wide screening for antibody markers (alone or combined with specific genetic markers) will be available to identify those at risk for developing T1D. Such population-wide screening would be ethically justified if prevention could be proven effective. Presently, the data are sufficiently persuasive to have fostered national trials in Europe and the United States to predict and possibly prevent the clinical onset of T1D through immune intervention strategies. The European Nicotinamide Diabetes Intervention Trial (ENDIT) was a multicenter trial that screened approximately 22,000 first-degree relatives of patients with T1D to identify 500 considered to be at high risk for developing this disease. These at-risk individuals were treated with nicotinamide or a placebo in a double-blind fashion. The results of ENDIT showed no positive protection against development of diabetes. The US DPT1 was based on promising pilot data that suggested preservation of insulin secretion and prevention of progression to DM in at-risk individuals treated with insulin. Daily subcutaneous insulin, coupled with an intensive course of IV insulin every 9 months, prevented diabetes for at least 3 years in five subjects considered to be at risk because of genetic markers, islet cell and insulin autoantibodies, and diminished first-phase insulin response. Among seven similar at-risk subjects who chose not to be treated, six developed insulin-dependent diabetes within 3 years. DPT1 aimed to investigate these promising pilot results in a larger carefully matched cohort and was concluded in 2001; there was no difference in the rates of developing diabetes among the placebo and insulin-treated groups. However, the ENDIT and DPT1 studies proved that large-scale multicenter studies could be successfully undertaken and that the prediction of progression to clinical diabetes was remarkably accurate. Thus in those at highest risk (such as first-degree relatives of patients with T1DM) prediction is feasible and the discovery of successful means of arresting or reversing progression to clinical diabetes is the subject of intense research.
Another study (TRIGR) involved 3000 families in whom half avoided cow’s milk for the first 9 months of life to test the hypothesis that the ingestion of breast milk and avoidance of cow’s milk formula (with its bovine serum albumin [BSA]) may protect participants from the appearance of diabetes. As noted earlier, no benefit accrued to those who avoided cow’s milk. Several other studies are examining the utility of antibodies to the IL2R, CD3 antibodies, immune suppressors, such as mycophenolate mofetil, and immune modulators in preventing diabetes, including oral insulin. These studies are conducted by consortia of participating institutions (see www.trialnet.org ).
In animal models, oral insulin or oral GAD had been successfully used to prevent diabetes. it was postulated that ingestion of T-lymphocyte–dependent antigens may establish immunological tolerance. Such oral strategies have been proposed and oral insulin was tested in humans but again with no definitive benefit. The subjects of primary prevention trials and secondary intervention trials to preserve residual insulin secretion at initial diagnosis are of major interest to investigators and clinicians alike. Progress is likely, but at present, all of these strategies must be viewed as experimental and not currently in the domain of daily clinical practice.
Of immediate relevance are the reports of a decline in the incidence of new-onset T1DM in children vaccinated against rotavirus. If these findings are confirmed, they would add credence to the role of viruses in initiating islet cell damage that may lead to the autoimmune cascade resulting in T1DM and the potential benefits of immunization against these, and yet to be defined other viral agents.
Insulin Biosynthesis
Insulin is synthesized on the ribosomes of pancreatic islet beta cells and released into the circulation as a molecule composed of two separate straight polypeptide chains linked by disulfide bridges between and within these chains. The two chains are not synthesized separately but are derived from a larger precursor, proinsulin, a single coiled chain in which the NH 2 terminus of the A chain is linked to the COOH terminus of the B chain by a connecting peptide, known as C-peptide ( Fig. 21.6 ). An even larger precursor (preproinsulin, containing an additional peptide chain on the NH 2 terminus of the A chain) is first synthesized, but this additional piece (important to the initiation of synthesis) is rapidly excised. Further processing of proinsulin within the beta cell cleaves the C-peptide, consisting of 31 amino acids, from the insulin molecule at the sites indicated in Fig. 21.6 .
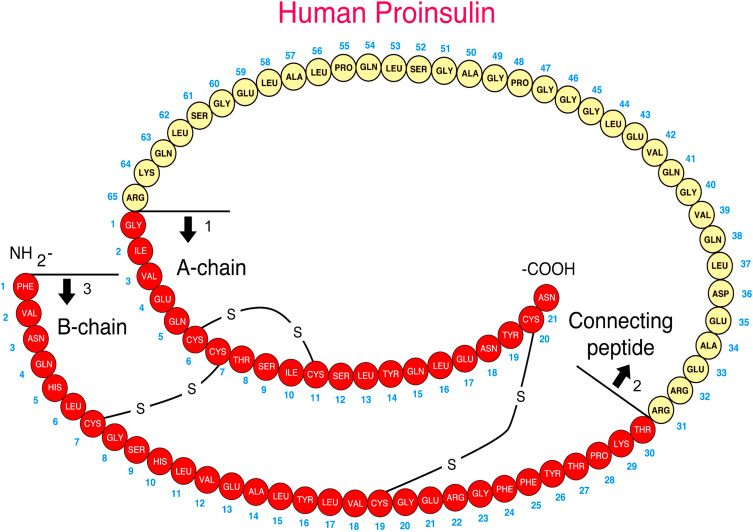
Defects in these cleavage sites are inherited in an autosomal-dominant manner and result in insulin molecules with less-than-normal biological activity that can give rise to two types of familial hyperproinsulinemia. One defect results in B-C proinsulin, cleaved at site 1 but not at site 2 (see Fig. 21.6 ). This intermediate has 50% of the biological activity of insulin, which is sufficient to prevent any abnormality in carbohydrate metabolism. The defect at site 1 yields A-C proinsulin, cleaved at site 2 but not at site 1, which has inadequate biological activity to prevent carbohydrate intolerance. A structural mutation in the proinsulin molecule, between the C-peptide and insulin, has been confirmed. In addition, a defective enzymatic conversion of a normal proinsulin molecule to insulin results in hyperproinsulinemia and mild carbohydrate intolerance.
The proconvertases responsible for correct conversion of proinsulin to insulin are also involved in the processing of other hormones. Thus impaired prohormone processing may lead to severe obesity and secondary hypocortisolism owing to defective processing of proopiomelanocortin (POMC), to hypogonadotropic hypogonadism, and to diabetes insipidus. Native proinsulin has less than 5%, whereas C-peptide has none, of the biological activity of insulin. During synthesis, the role of C-peptide appears to be the provision of the spatial arrangement necessary in the formation of the disulfide bonds. Other defects have been described in insulin biosynthesis involving substitution of amino acids in the B chain that lead to impaired glucose tolerance in the presence of hyperinsulinemia.
The insulin gene has been cloned and localized to chromosome 11, and genetic defects in insulin synthesis may be associated with diabetes—especially the syndromes MODY 1, 3, 4, 5, and 10, the latter being insulin itself. By some estimates, MODY syndromes may constitute 2% to 5% of all lean persons developing clinical diabetes between the ages of 10 and 30 years. The MODY syndromes are briefly discussed later and in detail in Chapter 10 . The association of VNTRs in the insulin gene with genetic predisposition for autoimmune T1DM was described earlier.
Under normal circumstances, only small quantities of proinsulin are released into the circulation—amounting to less than 15% of total insulin as measured by radioimmunoassay (RIA). Even smaller quantities of proinsulin intermediates are also released. However, during insulin secretion induced by all stimuli, one molecule of C-peptide is released with each molecule of insulin. Thus the plasma of normal individuals contains small amounts of proinsulin, proinsulin intermediates, and almost equimolar amounts of insulin and C-peptide. The plasma metabolic half-life of C-peptide is, however, longer than that of insulin. Therefore the molar ratio of C-peptide to insulin in peripheral plasma is always greater than 1 and the peak of C-peptide secretion or the nadir after suppression of release appears to occur later than that of insulin. Although standard RIA of insulin will also measure proinsulin, C-peptide will not be measured because it is immunologically distinct (see Fig. 21.6 ).
Separation of proinsulin from insulin can be achieved by chromatography to separate the larger proinsulin before assay. This is done with the use of an enzyme that degrades insulin but not proinsulin, or with the use of a C-peptide assay that will also measure proinsulin but not insulin. Because C-peptide is immunologically distinct, RIAs for this substance can be used to assess beta-cell secretory reserve even in the presence of insulin antibodies formed in response to injections of human or formerly used bovine-porcine insulin.
Endogenous insulin secretion is accompanied by C-peptide release, whereas exogenous insulin administration suppresses endogenous insulin (and therefore C-peptide) secretion in all circumstances except insulinoma. Results of standard RIA with double-antibody precipitation are high in both circumstances. These attributes are important in distinguishing abuse of individuals by injection of exogenous insulin (high insulin, low C-peptide) from insulinomas or dysregulated insulin secretion (high insulin, high C-peptide) in cases of hypoglycemia. Measurements of C-peptide kinetics or of urinary excretion of C-peptide can be used as an index of endogenous insulin secretion.
Insulin Secretion
Insulin secretion is governed by the interaction of nutrients, hormones, and the autonomic nervous system. Glucose, as well as certain other sugars metabolized by islets, stimulates insulin release. Basal and peak insulin levels are closely related to the glucose concentration, and prolonged fasting will further reduce glucose and insulin levels—which, however, remain in the measurable range at 2 to 5 mU/mL. There is evidence that a product or products of glucose metabolism may be involved in maintaining insulin secretion and that sugars not metabolized by islet cells do not promote insulin release.
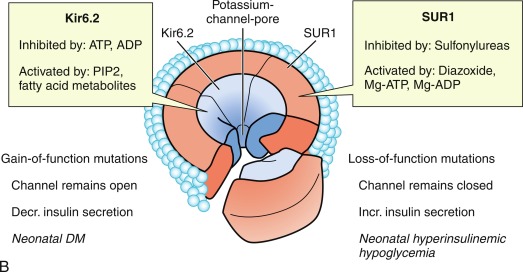
The initial steps of glucose-stimulated insulin release are depicted in Fig. 21.7 and discussed in detail in Chapters 7 and 10 in connection with mutations in the sulfonylurea receptor (SUR)-Kir6 (inward-rectifying potassium channel) complex of the adenosine triphosphate–regulated potassium channel K ATP , along with the subsequent steps that may cause activation of glucose or amino acid–stimulated insulin secretion. This schema involves glucose transport into the beta cell through the GLUT2 glucose transporter and phosphorylation of glucose by means of glucokinase. Defects in the former are associated with T2D, whereas heterozygous inactivating mutations in the latter are associated with MODY2. Homozygous mutations in glucokinase result in permanent neonatal DM (as described in detail in Chapter 10 ). Heterozygous inactivating mutations in glucokinase are generally associated with normal insulin release at higher glucose concentrations, and therefore with a milder type of diabetes that rarely requires treatment and is not associated with microvascular or other diabetes complications. After IV glucose infusion in normal persons, insulin secretion is biphasic—with an initial spike followed by a sustained plateau. It is proposed that the initial spike represents preformed insulin, whereas the sustained plateau represents newly synthesized insulin.
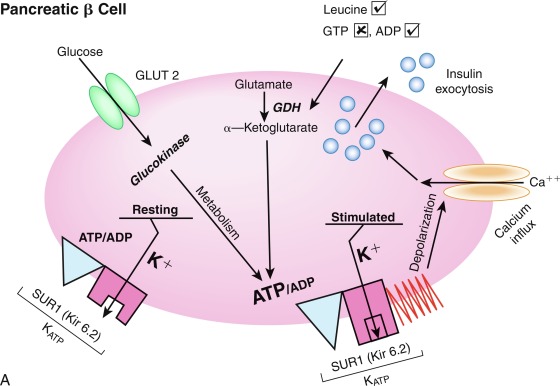
Cyclic adenosine monophosphate (cAMP) is involved in stimulating insulin release. Therefore agents that inhibit phosphodiesterase and reduce cAMP destruction (such as theophylline) augment insulin release. Translocation of calcium ions into the cytoplasm from the exterior, as well as from the intracellular organelles (see Fig. 21.7 ), plays a key role in the contractile forces that propel insulin to the cell surface. There, the membrane of the insulin vesicle fuses with the cell membrane—allowing extrusion of insulin granules into the surrounding vascular space, a process known as emiocytosis. Other ions, including potassium and magnesium, are involved in the insulin secretion. The sulfonylurea receptor is closely linked to potassium channels in the beta cell. Amino acids also stimulate insulin release, although the potency of individual amino acids varies. A group of amino acids is more potent than any single one, and the insulin-secretory response is potentiated in the presence of glucose. Free fatty acids and ketone bodies may also stimulate insulin release. Insulin responses to oral glucose administration are always greater than responses to IV administration of glucose that result in the same blood glucose profile, a finding that led to the concept that gut factors (incretins) modulate and increment insulin secretion. Although a variety of gut hormones participate in promoting insulin release, gastrointestinal polypeptide (gip) pancreatic glucagon and the glucagon-like peptides (GLP) play a major role in stimulating insulin release. These properties have found application as agents, collectively named incretins , in augmenting insulin secretion in persons with T2DM and in some persons with T1DM.
Somatotropin release-inhibiting factor (somatostatin), produced in the delta cells of islets, inhibits insulin and glucagon release and reduces splanchnic blood flow. These properties have found application to reduce insulin secretion in neonates with hyperinsulinemic hypoglycemia of infancy (see Chapter 7 ). Together, these factors may finely regulate nutrient intake and its disposition and form an enteroinsular axis for metabolic homeostasis. In addition to these gut hormones, several other hormones modulate insulin secretion. Growth hormone is involved in insulin synthesis and storage. Persons with congenital growth hormone deficiency have subnormal basal and stimulated insulin responses, whereas in acromegaly, basal and stimulated insulin levels are increased. Human chorionic somatomammotropin (also known as human placental lactogen ), structurally related to growth hormone, likewise affects insulin release. The stimulatory effect of each hormone on insulin secretion is antagonized by the antiinsulin effect at the peripheral level, however. Similarly, glucocorticoids and estrogens evoke greater insulin secretion while inducing peripheral insulin resistance—in part by decreasing insulin receptors on target cells.
Insulin secretion is constantly modulated by the autonomic nervous system. The parasympathetic arm, through the vagus, directly stimulates insulin release. Modulation of insulin secretion by the sympathetic arm depends on whether α – or β-adrenergic receptors are activated. Activation of β 2 receptors by agents, such as isoproterenol, stimulates insulin secretion by a process that involves cAMP generation. Blockade of β-adrenergic receptors by propranolol blunts basal and stimulated insulin release. Conversely, activation of α-adrenergic receptors blunts insulin secretion, and blockade of these receptors by agents, such as phentolamine, augments basal and glucose-stimulated insulin release. Epinephrine and norepinephrine stimulate predominantly α-adrenergic receptors in islets, resulting in impaired insulin secretion—as observed during stress or in patients with pheochromocytoma.
In summary, in normal humans, insulin secretion is constantly modulated by the quantity, quality, and frequency of nutrient intake; by the hormonal milieu; and by autonomic impulses. The ingestion of nutrients, principally carbohydrate and protein, produces intestinal hormonal signals that prime and initiate insulin release. The entry of glucose into the beta cell, the phosphorylation of glucose, and the generation of adenosine triphosphate (ATP) by this or other nutrients result in insulin release. This sequence involves cAMP, β-adrenergic receptors, and ions—principally calcium and potassium. Glucose metabolism within the beta cell provides energy for further synthesis and release of insulin.
Insulin Action
Insulin action on target cells in tissues such as liver, adipocytes, and muscle, begins by binding to specific insulin receptors located on the cell membrane. Binding to these receptors is saturable, occurs with a high energy of association (affinity), and is pH and temperature dependent. The insulin receptor is a heterodimeric glycoprotein consisting of two α and two β subunits linked by disulfide bonds ( Fig. 21.8 ). The α subunit, with a molecular mass of approximately 125,000 kDa, acts as the binding site—whereas the β subunit, with a molecular mass of approximately 90,000 kDa, possesses tyrosine kinase activity for endogenous and exogenous substrates (see Figs. 21.8 and 21.9 .)
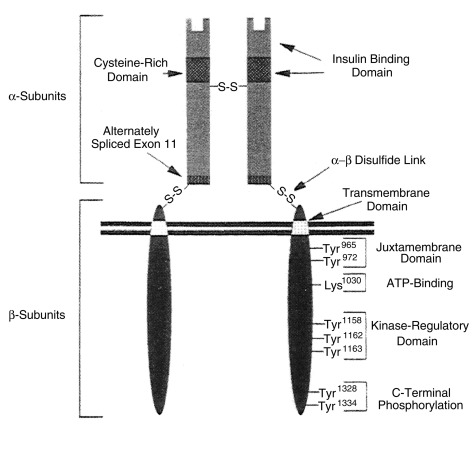
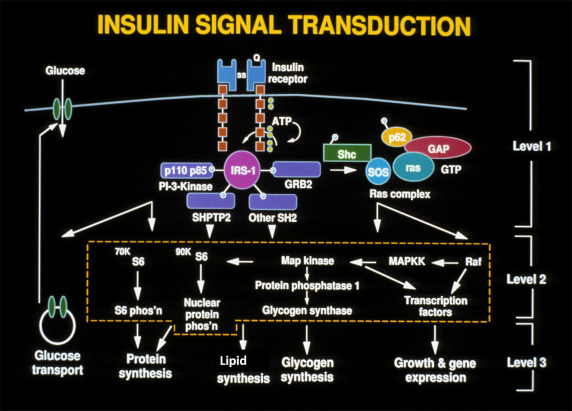
This ability to phosphorylate proteins may underlie some of the manifold actions of insulin. Among the classes of proteins phosphorylated are insulin receptor substrates 1 through 3 (considered an important insulin-signaling effector molecule) and pp 185, another substrate of the insulin receptor (see Fig. 21.9 ). Other insulin mediators may be involved in insulin action. This action may also be mediated in part by hydrolysis of glycan phosphoinositides in the cell plasma membrane. The insulin receptor gene has been cloned and localized to chromosome 19, whereas the structurally related insulin-like growth factor-1 (IGF-1) receptor has been localized to chromosome 15.
Under normal conditions, only a small proportion of the total available cell receptors need be occupied to achieve maximal biological response. Thus ordinarily there are spare receptors. Insulin receptors display two phenomena: downregulation, in which high ambient insulin concentrations reduce the number of available receptors, and negative cooperativity, in which the occupancy of a receptor reduces the affinity of adjoining receptor sites. Scatchard analysis of insulin-binding data in in vitro systems reveals curvilinear plots compatible with negative cooperativity or with two classes of receptors: high-affinity/low-capacity and low-affinity/high-capacity. Total receptor number and the affinities of both classes of receptor sites can be calculated with use of these Scatchard plots.
After binding to the cell surface, the receptor-insulin complex is internalized within the cell and processed by lysosomal enzymes, with release of free insulin and potential recycling of the receptor back to the cell membrane. Binding of insulin to the cell-surface receptor, perhaps with the participation of internalization that permits insulin action at the level of the nucleus, leads to the complex biochemical processes characteristic of insulin action in a given tissue. With postreceptor events assumed to be normal, however, the biological response to insulin in a tissue is a function of the number of receptor/insulin complexes formed—which in turn is directly related to the circulating insulin concentration and to the receptor concentration. Thus a reduction in receptor number could be compensated for by an increase in insulin concentration as long as the critical number of receptors necessary to produce maximal biological response remains. Conversely, reduced insulin concentration could be compensated for by an increase in receptor number, provided the minimum amount of insulin necessary to produce a maximal biological response is present.
Insulin receptors and their signaling proteins (see Figs. 21.8 and 21.9 ) are widely distributed in various tissues. Using targeted deletions of individual components or various combinations of components of the insulin receptor pathway has provided remarkable insight into the contribution of liver, muscle, fat, the beta cell, and brain to overall glucose homeostasis. Key concepts that have emerged are that the insulin receptor signal cascade on beta cells is critically important in maintaining normal insulin secretion. Thus mutations causing insulin resistance at the beta cell eventually lead to relative hypoinsulinemia that can interact with the insulin resistance in peripheral tissues to produce the hallmark of T2D (i.e., peripheral insulin resistance plus relative insulinopenia).
In addition, studies with targeted deletion of the insulin receptor in the brain—the so-called NIRKO mouse (neuron-specific insulin receptor knockout)—demonstrate that these animals developed obesity, increased body fat, insulin resistance with modest hyperinsulinemia, and elevated levels of triglycerides. Reproductive function in both males and females is impaired as a result of abnormal regulation of luteinizing hormone secretion, and serum leptin levels are elevated. Thus insulin signaling in the brain joins the emerging list of factors important in regulating energy homeostasis and reproduction.
Primary defects in insulin receptor number or affinity may produce the same profound derangements in intermediary metabolism as deficient insulin secretion, and similar disturbances may result despite normal insulin concentration and normal receptor characteristics if postreceptor steps are defective. Insulin signaling for the regulation of metabolism has been the subject of considerable research and is extensively reviewed. Examples of each type of defect in the individual components of this integrated system that comprises insulin biosynthesis, secretion, and action exist and can account for the metabolic abnormalities that characterize DM. An approach based on the principles of insulin biosynthesis secretion and action also permits a rational classification of DM.
Pathophysiology
Normal insulin secretion in response to feeding is exquisitely modulated by the interplay of neural, hormonal, and substrate-related mechanisms to permit controlled disposition of ingested foodstuff as energy for immediate or future use in metabolism and growth. Mobilization of energy during the fasted state depends on low plasma levels of insulin. Thus in normal metabolism, there are regular swings between the postprandial high-insulin anabolic state and the fasted low-insulin catabolic state that affect three major tissues: liver, muscle, and adipose tissue ( Table 21.6 ).
| High Plasma Insulin (Postprandial State) | Low Plasma Insulin (Fasted State) | |
|---|---|---|
| Liver | Glucose uptake | Glucose production |
| Glycogen synthesis | Glycogenolysis | |
| Absence of gluconeogenesis | Gluconeogenesis | |
| Lipogenesis | Absence of lipogenesis | |
| Absence of ketogenesis | Ketogenesis | |
| Muscle | Glucose uptake | Absence of glucose uptake |
| Glucose oxidation | Fatty acid and ketone oxidation | |
| Glycogen synthesis | Glycogenolysis | |
| Protein synthesis | Proteolysis and amino acid release | |
| Adipose tissue | Glucose uptake | Absence of glucose uptake |
| Lipid synthesis | Lipolysis and fatty acid release | |
| Triglyceride uptake | Absence of triglyceride uptake |
Insulin is the key anabolic hormone that promotes the synthesis and storage of carbohydrates, lipids, and proteins while simultaneously restraining their degradation. The uptake of glucose, fatty acids, and amino acids is stimulated—as is the activity or expression of enzymes that promote glycogen, fat, and protein synthesis. Conversely, the activity or expression of enzymes that break down these metabolites is restrained. All of these anabolic actions of insulin are reversed during the low-insulin state of starvation. T1DM, as it evolves, becomes a permanent low-insulin catabolic (starvation) state in which feeding cannot reverse but rather exaggerates these catabolic processes.
It is important to emphasize that liver is more sensitive than muscle or fat to a given concentration of insulin. That is, endogenous glucose production from the liver by means of glycogenolysis and gluconeogenesis can be restrained at insulin concentrations that do not fully augment glucose utilization by peripheral tissues. Consequently, with progressive failure of insulin secretion, the initial manifestation is postprandial hyperglycemia. Fasting hyperglycemia is a late manifestation that reflects severe insulin deficiency and indicates excessive endogenous glucose production.
Although insulin deficiency is the primary defect, several secondary changes that involve the stress hormones (i.e., epinephrine, cortisol, growth hormone, and glucagon) accelerate and exaggerate the rate and magnitude of metabolic decompensation.
Increased plasma concentrations of these counterregulatory hormones magnify metabolic derangements by further impairing insulin secretion (e.g., epinephrine), by antagonizing its action (e.g., epinephrine, cortisol, and growth hormone), and by promoting glycogenolysis, gluconeogenesis, lipolysis, and ketogenesis (e.g., glucagon, epinephrine, growth hormone, and cortisol) while decreasing glucose utilization and glucose clearance (e.g., epinephrine, growth hormone, and cortisol). With progressive insulin deficiency, especially with concurrently elevated stress hormones, excessive glucose production, and impairment of its utilization result in hyperglycemia with glucosuria when the renal threshold of approximately 180 mg/dL (10 mmol/L) is exceeded.
The resultant osmotic diuresis produces polyuria, urinary losses of electrolytes, dehydration, and compensatory polydipsia. These evolving manifestations, especially dehydration, represent physiological stress—resulting in hypersecretion of epinephrine, glucagon, cortisol, and growth hormone that amplifies and perpetuates metabolic derangements and accelerates metabolic decompensation. The acute stress of trauma or infection may likewise accelerate metabolic decompensation to ketoacidosis in evolving or established diabetes.
Hyperosmolality, commonly encountered as a result of progressive hyperglycemia, contributes to the symptomatology—especially to cerebral obtundation in diabetic ketoacidosis (DKA). Serum osmolality can be estimated with the following formula.
Serum osmolalitymOsm/kg=(serumNamEq/L+KmEq/L)×2+Glucose mmol/LNote that1mmol/Lof glucose is equivalent to18mg/dL.
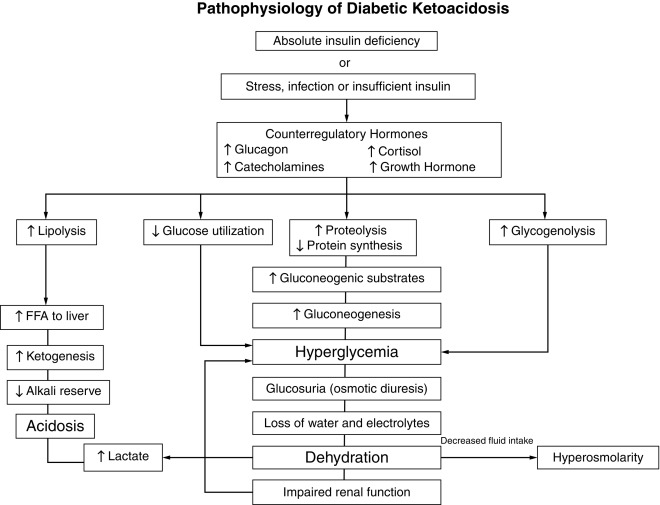
Consideration of serum osmolality has important implications in the treatment of DKA. The combination of insulin deficiency and elevated plasma values of the counterregulatory hormones is also responsible for accelerated lipolysis and impaired lipid synthesis, with resulting increased plasma concentrations of total lipids, cholesterol, triglycerides, and free fatty acids. The hormonal interplay of insulin deficiency and glucagon excess shunts the free fatty acids into ketone body formation. The rate of formation of these ketone bodies, principally β-hydroxybutyrate and acetoacetate, exceeds the capacity for peripheral utilization and for their renal excretion. Accumulation of these ketoacids results in metabolic acidosis and in compensatory rapid deep breathing in an attempt to excrete excess carbon dioxide (Kussmaul respiration).
Acetone, formed by nonenzymatic conversion of acetoacetate, is responsible for the characteristic fruity odor of the breath. Ketones are excreted in the urine in association with cations and thus further increase losses of water and electrolytes ( Fig. 21.10 and Table 21.7 ). With progressive dehydration, acidosis, hyperosmolality, and diminished cerebral oxygen use, consciousness becomes impaired—with the patient ultimately becoming comatose. Thus insulin deficiency produces a profound catabolic state—an exaggerated starvation in which all of the initial clinical features can be explained on the basis of known alterations in intermediary metabolism mediated by insulin deficiency in combination with counterregulatory hormone excess. Because the counterregulatory hormonal changes are usually secondary, the severity and duration of the symptoms reflect the extent of primary insulinopenia. Greater details of these considerations are provided in the discussion of diabetic ketoacidosis, which follows later.
| Approximate Daily Maintenance Requirements | Average (range) Losses per Kg c | |
|---|---|---|
| Water | Holliday-Segar method First 10 kg: 100 mL/kg/d Second 10 kg: 50 mL/kg/d Each additional 1 kg: 20 mL/kg/d alternatively Surface area method 1500 mL/m 2 /d a | 70 mL (30–100) |
| Sodium | 2–4 mmol b | 6 mmol (5–13) |
| Potassium | 2–3 mmol | 5 mmol (3–6) |
| Chloride | 2–3 mmol | 4 mmol (3–9) |
| Phosphate | 1–2 mmol | 0.5–2.5 mmol |
a This method should not be used for children < 10 kg.
b Maintenance electrolyte requirements are expressed per 100 mL of maintenance fluid.
c Losses are expressed per unit of body weight because the losses remain relatively constant in relation to total body weight.
Clinical Manifestations of Diabetes Mellitus
The classic presentation of diabetes in children is a history of polyuria, polydipsia, polyphagia, and weight loss. Polyuria may be heralded by the recurrence of bedwetting in a previously toilet trained child and polydipsia by a child constantly requesting fluids to drink. Unexplained weight loss should raise suspicion of the existence of diabetes that should be confirmed or excluded by measurement of blood glucose concentration, first in the postprandial and later in the fasting state. The urine should also be checked for the presence of glucosuria. The duration of these symptoms varies; it often is less than 1 month, but careful history may reveal weeks of thirst, enuresis, fatigue, and weight loss. Most children who are diagnosed with T1DM have been seen by a physician within a week or so of diagnosis, but diabetes was not considered, and a glucose measurement in blood or urine was not performed.
An insidious onset with lethargy, weakness, and weight loss is also quite common. The loss of weight despite increased dietary intake is readily explicable by the following example. The average healthy 10-year-old child has a daily intake of 2000 or more calories, of which approximately 50% are derived from carbohydrates. With the development of diabetes, daily losses of water and glucose may be as much as 5 L and 250 g, respectively. This represents 1000 calories lost in the urine, or 50% of average daily caloric intake. Therefore despite the child’s compensatory increased intake of food and water, the calories cannot be used, excessive caloric losses continue, and increasing catabolism and weight loss ensue.
Pyogenic skin infections and candidal vaginitis in girls or candidal balanitis in uncircumcised boys are occasionally present at the time of diagnosis of diabetes. They are rarely the sole clinical manifestations of diabetes in children, and a careful history will invariably reveal the coexistence of excessive urination or recurrence of enuresis in a previously toilet-trained child, excessive thirst, and perhaps weight loss. Ketoacidosis is responsible for the initial presentation of many (about 25%–40%) diabetic children. Ketoacidosis is likely to be present more often in children younger than 5 years of age because the diagnosis may not be suspected and a history of polyuria and polydipsia may be difficult to elicit. The early manifestations may be relatively mild and consist of vomiting, polyuria, and dehydration.
In more prolonged and severe cases, Kussmaul respiration is present—and there is an odor of acetone on the breath. Kussmaul respiration may be confused with bronchiolitis or asthma and if erroneously treated with steroids or adrenergic agents, worsen diabetes. Abdominal pain or rigidity may be present and may mimic appendicitis or pancreatitis. Cerebral obtundation and (ultimately) coma ensue and are related to the degree of hyperosmolarity. Laboratory findings include glucosuria, ketonuria, hyperglycemia, ketonemia, and metabolic acidosis. Leukocytosis is common, and nonspecific serum amylase levels may be elevated. The serum lipase level is usually not elevated. In those with abdominal pain, it should not be assumed that these findings are evidence of a surgical emergency before a period of appropriate fluid, electrolyte, and insulin therapy to correct dehydration and acidosis. The abdominal manifestations frequently disappear after several hours of such treatment.
Diagnosis
The diagnosis of DM must be considered in children who have the following manifestations: those who have a history suggestive of diabetes, especially symptoms of polyuria with polydipsia, and failure to gain weight or a weight loss despite a healthy appetite; those who have confirmed glucosuria; and those who have clinical manifestations of metabolic acidosis with or without stupor or coma. In all instances, the diagnosis of DM is dependent on the demonstration of hyperglycemia in association with glucosuria with or without ketonuria. When classic symptoms of polyuria and polydipsia are associated with hyperglycemia and glucosuria that meet the criteria for diagnosing DM as defined by the ADA or World Health Organization (WHO), a glucose tolerance test is contraindicated.
Renal glucosuria may be an isolated congenital disorder or a manifestation of the Fanconi syndrome and other renal tubular disorders owing to severe heavy metal intoxication, ingestion of certain drugs (e.g., outdated tetracycline), or inborn errors of metabolism (e.g., cystinosis). When vomiting, diarrhea, and inadequate intake of food are complicating factors in any of these conditions, starvation ketosis may ensue and simulate DKA. The absence of hyperglycemia eliminates the possibility of diabetes. It is also important to recognize that not all urinary sugar is glucose, and infrequently galactosemia, pentosuria, and the fructosuria will require consideration as diagnostic possibilities.
The discovery of glucosuria, with or without a mild degree of hyperglycemia, during a hospital admission for trauma or infection (or even during the associated emotional upheaval) may herald the existence of diabetes. In most of these instances, the glucosuria remits during recovery. Because this circumstance may indicate a limited capacity for insulin secretion, which is unmasked by elevated plasma concentrations of stress hormones, these patients should be rechecked at a later date for the possibility of hyperglycemia, clinical features of DM, and family history of diabetes.
A family history of DM in two preceding generations should suggest the possibility of a MODY syndrome; absence of the common antibodies to beta cells, such as IA2, GAD65, ZnT8, or ICA, strengthens the possibility of a diagnosis of MODY. Under these circumstances, a glucose tolerance test may be useful to establish a diagnosis. Glucose tolerance testing should be performed several weeks after recovery from the acute illness, with a glucose loading dose adjusted for weight. Evidence indicates that the test is most likely to be abnormal in those with HLA DR3 and DR4, in whom ICA or insulin autoantibodies are detected, or who have MODY. Transient hyperglycemia is common in patients with asthma treated with epinephrine and steroids. Further testing in such patients is not indicated. Screening procedures, such as postprandial determinations of blood glucose or oral glucose tolerance tests, have yielded low detection rates in children—even among those considered at risk, such as siblings of diabetic children. Accordingly, such screening procedures are not recommended in children.
Diabetic ketoacidosis pathophysiology and treatment
Diabetic Ketoacidosis
DKA is the entity of severe metabolic decompensation caused by the combined effects of deficiency of circulating insulin, together with increased levels of the counterregulatory hormones: catecholamines, glucagon, cortisol, and growth hormone, as well as proinflammatory cytokines (see Fig. 21.10 ). Typical symptoms and signs are polyuria, enuresis, vomiting, dehydration, increased thirst, Kussmaul respiration, the odor of acetone on the breath, together with characteristic biochemical features, which include hyperglycemia, hyperketonemia, metabolic acidosis, and electrolyte abnormalities.
Severe insulin deficiency occurs as DKA evolves in previously undiagnosed T1DM, or when treated patients deliberately or inadvertently do not take insulin, especially the long-acting component of a multiple daily injection (MDI) regimen, or markedly reduce the doses of insulin, for example, during an illness, such as gastroenteritis. Patients who use an insulin pump can rapidly develop DKA when insulin delivery is interrupted for any reason because pumps deliver only short-acting insulin and there is no long-acting component on board as there is with MDI. Relative insulin deficiency occurs when the concentrations of counterregulatory hormones increase in response to stress (e.g., sepsis, trauma, or febrile illness) and lead to metabolic decompensation despite administration of the usual dose of insulin. Although less common than in T1DM, the SEARCH for Diabetes in Youth Study in the United States reported that nearly 6% of youth with T2DM presented with DKA.
The combination of absolute or relative insulin deficiency and high counterregulatory hormone concentrations causes an accelerated catabolic state with increased glucose production by the liver and kidney (via glycogenolysis and gluconeogenesis) together with impaired peripheral glucose utilization, which result in hyperglycemia and hyperosmolality (see Fig. 21.10 ). The combination of low insulin and high counterregulatory hormones also increases lipolysis and ketogenesis that result in hyperketonemia and metabolic acidosis from the accumulating ketoacids predominantly β-hydroxybutyrate. Hyperglycemia exceeding the usual renal threshold, approximately 10 mmol/L (180 mg/dL), causes osmotic diuresis, dehydration, and loss of electrolytes in urine, which often is aggravated by vomiting associated with severe ketosis. These changes stimulate further stress hormone production, which induces more severe insulin resistance and worsening hyperglycemia and hyperketonemia. Lactic acidosis from hypoperfusion or sepsis may contribute to the acidosis. Unless this cycle is interrupted by fluid and electrolyte therapy and administration of exogenous insulin, fatal dehydration and metabolic acidosis will ensue.
DKA is a life-threatening medical emergency that requires prompt recognition and treatment. It must be differentiated from acidosis and coma from other causes, such as hypoglycemia, uremia, gastroenteritis with metabolic acidosis, lactic acidosis, salicylate intoxication, encephalitis, and other intracranial lesions.
The biochemical criteria for the diagnosis of DKA are : hyperglycemia (blood glucose > 11 mmol/L [200 mg/dL]), venous pH under 7.3 or serum bicarbonate less than 15 mmol/L, ketonemia or ketonuria (typically ≥ 2 + positive, “moderate or large”), or blood beta-hydroxybutyrate (BOHB) concentration of 3 mmol/L or higher is indicative of DKA. Partially treated children and children who have consumed little or no carbohydrate (anorexia or religious fasting, a low-carbohydrate high-fat diet) may have only modestly elevated blood glucose concentrations, referred to as euglycemic ketoacidosis . Recently, euglycemic ketoacidosis has been described in patients using sodium glucose transport protein 2 (SGLT2)-inhibitors (not currently approved for use in children). The severity of DKA is defined by the degree of acidosis: mild, venous pH 7.2 to 7.3 or serum bicarbonate 10 to 15 mmol/L; moderate, pH 7.1 to 7.2 or serum bicarbonate 5 to less than 10 mmol/L; severe, pH under 7.1 or serum bicarbonate less than 5 mmol/L.
The frequency of DKA at the time of diagnosis varies widely worldwide and inversely correlates with the regional incidence of T1DM, ranging from approximately 15% to 70% in Europe and North America. At the time of diagnosis, approximately 30% to 50% of all children have DKA even in developed countries. Programs that heighten awareness have decreased rates of DKA. DKA is the leading cause of complications, death, and excessive healthcare use and costs in patients with T1DM.
DKA is more common in younger children (especially < 2 years of age, including infants with neonatal diabetes), often the consequence of diagnostic error and delayed treatment. DKA at diagnosis is also more common in ethnic minorities and in children who do not have ready access to medical care for social or economic reasons. In children with established T1DM the risk of DKA is 1% to 10% per patient per year. Risk is increased in children who omit insulin ; children with poor metabolic control or previous episodes of DKA; intercurrent illness, especially gastroenteritis with persistent vomiting and inability to maintain hydration; children with psychiatric disorders, including those with eating disorders; children living in stressful or dysfunctional family circumstances; and peripubertal and adolescent girls. DKA is a well-recognized hazard associated with use of recreational drugs and binge alcohol consumption in adolescents and young adults. Insulin omission or failure to follow sick day or pump failure management guidelines accounts for almost all episodes of recurrent DKA.
DKA must be distinguished from hyperglycemic hyperosmolar state (HHS), formerly referred to as hyperosmolar nonketotic coma , a syndrome characterized by extremely elevated serum glucose concentrations and hyperosmolality without significant ketosis. The criteria for HHS include plasma glucose concentration over 33.3 mmol/L (600 mg/dL), venous pH greater than 7.25 (arterial pH > 7.30), serum bicarbonate over 15 mmol/L, small ketonuria, absent to small ketonemia, effective serum osmolality greater than 320 mOsm/kg, obtundation, combativeness, or seizures (occur in approximately 50%).
Although much less common in children and adolescents than DKA, the incidence of HHS is increasing ; a recent study found HHS at presentation in 2% of youth with T2DM (often associated with morbid obesity). Unlike the usual symptoms of DKA (hyperventilation, vomiting and abdominal pain), which typically bring children to medical attention, the gradually increasing polyuria and polydipsia of HHS may go unrecognized, eventually resulting in profound dehydration and severe electrolyte losses at the time of presentation; fluid losses in HHS have been estimated to be twice those of DKA. Furthermore, obesity and hyperosmolality make the clinical assessment of dehydration especially challenging because hypertonicity preserves intravascular volume; thus despite severe volume depletion and electrolyte losses signs of dehydration may be less evident. Reports have described a high incidence of preexisting neurological damage. Profound hyperglycemia may develop over a period of several days; initially, the obligatory osmotic polyuria and dehydration may be partially compensated for by increased fluid intake. However, with progression, thirst becomes impaired, possibly the result of altered function of the hypothalamic thirst center caused by hyperosmolarity. In some instances, this is the consequence of a preexisting defect in the hypothalamic osmoregulatory mechanism.
The characteristic features of HHS and DKA may overlap. Some patients with HHS, especially those with severe dehydration and prerenal azotemia, have mild or moderate acidosis because of hypoperfusion and lactic acidosis. Conversely, children with T1DM may have severe hyperglycemia, especially if high-carbohydrate–containing beverages have been consumed to quench thirst.
The low production of ketones is mainly attributed to hyperosmolarity, which in vitro blunts the lipolytic effect of epinephrine, and to the concomitant antilipolytic effect of residual insulin. Blunting of lipolysis by the therapeutic use of β-adrenergic blockers may also contribute to the syndrome. A key difference between DKA and HHS is the degree of insulinopenia, which is nearly absolute in DKA, whereas in HHS there is sufficient residual insulin activity to limit lipolysis in adipose tissue but inadequate insulin to suppress gluconeogenesis and permit normal peripheral glucose utilization at a time of increased glucose production induced by the increased concentrations of stress or counterregulatory hormones. Depression of consciousness correlates with the degree of hyperosmolarity in both HHS and DKA, and hemoconcentration predisposes to cerebral arterial and venous thromboses ( Box 21.2 ).
- 1.
Expand intravascular volume
- 2.
Correct derangements in fluid, electrolyte, and acid-base status
- 3.
Correct intermediary metabolism with insulin
- 4.
Identify and treat any precipitating event, such as infection
Management of Diabetic Ketoacidosis
Treatment of DKA consists of three basic elements: meticulous monitoring of vital signs and biochemical responses; replacement of fluids and electrolytes, with the volume and content based on an estimate of the degree of dehydration and daily maintenance requirements; and provision of IV insulin (see Table 21.7 ). Treatment should be instituted as soon as the clinical diagnosis is confirmed. Acute management should follow the general guidelines for Pediatric Advanced Life Support (PALS), with particular attention to the following: immediately measure blood glucose and blood BOHB concentrations with bedside meters or measure urine ketones with test strips (that measure only acetoacetic acid) if bedside blood ketone measurements are not available. Perform a clinical evaluation to identify a possible infection. Weigh the patient and, if body surface area is used for fluid therapy calculations, measure height or length to determine surface area. The current weight should be used for fluid calculations.
Clinical estimation of the degree of dehydration is imprecise ; useful signs include prolonged capillary refill time (normal capillary refill is ≤ 1.5–2 seconds), abnormal skin turgor (“tenting” or inelastic skin), dry mucus membranes, sunken eyes, absent tears, weak pulses, and cool extremities. More signs of dehydration tend to be associated with more severe dehydration ; weak or impalpable peripheral pulses, hypotension, and oliguria suggest 10% or greater dehydration.
Assess level of consciousness using Glasgow Coma Scale (GCS)— Table 21.8 . In the unconscious or severely obtunded patient without normal airway protective reflexes, secure the airway and empty the stomach by continuous nasogastric suction to prevent pulmonary aspiration. Intubation should be avoided if possible; an increase of pCO 2 during or following intubation above the level that the patient had been maintaining may cause cerebrospinal fluid (CSF) pH to decrease and contribute to worsening of cerebral edema.
| Best Eye Response | Best Verbal Response | Best Verbal Response (Nonverbal Children) | Best Motor Response |
|---|---|---|---|
|
|
|
a Inappropriate words, random, or exclamatory articulated speech, but no sustained conversational exchange.
b Attention can be held; patient responds to questions coherently, but there is some disorientation and confusion.
Give oxygen to patients with circulatory impairment or shock. A cardiac monitor should be used for continuous electrocardiographic monitoring to assess T waves for evidence of hyper- or hypokalemia.
A second peripheral IV catheter should be placed for repetitive blood sampling. Unless absolutely necessary, avoid inserting a central venous catheter because of the high risk of thrombosis, especially in the very young child.
Give antibiotics to febrile patients after obtaining appropriate cultures of body fluids.
Bladder catheterization usually is not necessary, but if the child is unconscious or unable to void on demand (e.g., infants and very ill young children) the bladder should be catheterized.
Obtain a blood sample for laboratory measurement of:
- •
Serum or plasma glucose
- •
Serum BOHB
- •
Slectrolytes (including serum bicarbonate)
- •
Blood urea nitrogen, creatinine
- •
Serum osmolality
- •
Venous pH, pCO 2
- •
Hemoglobin, hematocrit. An increased white blood cell count in response to stress is characteristic of DKA and is not indicative of infection
- •
Albumin, calcium, phosphate, magnesium concentrations (if possible)
- •
Urine ketones (if serum BOHB has not been measured)
- •
Obtain appropriate specimens for culture (blood, urine, throat) if there is evidence of infection (e.g., fever)
- •
If laboratory measurement of serum potassium is delayed, perform an e lectrocardiogram (ECG) for baseline evaluation of potassium status
- •
Although not essential for management of DKA per se, hemoglobin (Hb)A1c may be useful in specific patients as it provides information about the duration of hyperglycemia
Where Should the Child With Diabetic Ketoacidosis be Managed?
Successful management of DKA and HHS requires meticulous monitoring and recording of the patient’s clinical and biochemical response to treatment so that timely adjustments in treatment can be made when indicated by the patient’s clinical or laboratory data. After initial resuscitation, the child should receive care in a unit that has written guidelines and experienced nursing staff trained in management of DKA in children and adolescents. Children with severe DKA and those at increased risk for cerebral injury (e.g., < 5 years of age, severe acidosis, low pCO 2 , high blood urea nitrogen) should be treated in an intensive care unit (ICU).
Clinical and Biochemical Monitoring
- •
Hourly (more frequently as indicated) vital signs including heart rate, respiratory rate, blood pressure
- •
Hourly (more frequently as indicated) neurological observations (GCS; see Table 21.8 ) for warning signs and symptoms of cerebral injury (see later in section on cerebral edema)
- •
Amount of administered insulin
- •
Hourly (or more frequently as indicated) fluid input and output
- •
Laboratory tests: serum glucose, electrolytes, blood urea nitrogen, calcium, magnesium, phosphate, hematocrit, and blood gases should be repeated 2 to 4 hourly, or more frequently, as clinically indicated, in more severe cases
- •
Blood BOHB concentrations, if available, every 2 to 4 hours
- •
Point-of-care BOHB measurements correlate well with a reference method up to 3 mmol/L, but are not accurate above 5 mmol/L
- •
Useful calculations:
- •
Anion gap = Na – (Cl + HCO 3 ): normal is 12 ± 2 mmol/L. In DKA the anion gap is typically 20 to 30 mmol/L; an anion gap greater than 35 mmol/L suggests concomitant lactic acidosis
- •
“Corrected sodium” = measured Na + 2([plasma glucose – 5.6]/5.6) mmol/L or measured Na + 2([plasma glucose – 100]/100) mg/dL
- •
Effective osmolality (mOsm/kg) = 2 ×(plasma Na) + plasma glucose mmol/L
- •
Fluids and Electrolyte Therapy
Fluid and electrolyte replacement therapy is a cornerstone of DKA management. The aims are to restore circulating volume, replace sodium and the extracellular and intracellular water deficits, improve glomerular filtration, and enhance clearance of glucose and ketones from the blood. Patients with DKA have a deficit in extracellular fluid (ECF) volume usually in the range of 5% to 10% of body weight. Shock with hemodynamic compromise is rare in pediatric DKA. In moderate DKA assume 5% to 7% and in severe DKA 7% to 10% dehydration. It is useful to calculate the corrected sodium concentration (earlier formula) to help assess the magnitude of the deficit of sodium and water. The corrected sodium represents the expected serum sodium concentration in the absence of hyperglycemia. As the plasma glucose concentration decreases (in response to fluid and insulin), the measured serum sodium concentration should increase and the corrected sodium concentration should slowly decrease or remain in the normal range. A rapid and ongoing rise in serum sodium concentration may indicate loss of free water in the urine from diabetes insipidus, an agonal complication of cerebral edema.
There has been considerable controversy concerning the rate of fluid or sodium administration and a possible role of rapid administration of hypotonic fluid in the development of cerebral edema. A recent randomized clinical trial compared acute and long-term neurological outcomes in 1389 episodes in 1255 children with DKA treated with slower versus more rapid fluid administration using either 0.45% saline or 0.9% saline. Neither the rate nor the sodium chloride content of IV fluids significantly influenced neurologic outcomes, suggesting that a range of fluid infusion rates and fluid sodium content may be safely used to treat DKA in children. Therefore an assumed fluid deficit between 5% and 10% of body weight should be replaced over 24 to 48 hours, together with maintenance fluids, using fluids with a sodium content between 0.45% and 0.9% saline. Most importantly, clinicians should not restrict fluid administration if clinical signs suggest the need for circulatory volume expansion.
Resuscitation Fluids
Immediately begin volume expansion with 0.9% saline 10 mL/kg infused over 30 to 60 minutes to restore the peripheral circulation. If tissue perfusion is poor, the initial fluid bolus is given more rapidly (e.g., over 15–30 minutes) and a second fluid bolus may be needed to ensure adequate tissue perfusion.
Deficit Replacement Fluids
Subsequent fluid management can be with 0.45% to 0.9% saline or a balanced salt solution (Ringer’s lactate, Hartmann’s solution or Plasmalyte). In addition to providing the usual daily maintenance fluid requirement, replace the estimated fluid deficit at an even rate over 24 to 48 hours ( Table 21.9 provides an illustrative example). When plasma glucose concentrations fall during treatment, vascular volume will decrease; therefore it is essential to provide sufficient fluid and salt to maintain adequate tissue perfusion. Except for severely ill individuals, oral intake typically begins within 24 hours. Although rehydration is generally planned to occur over longer periods, in a study of 635 episodes of DKA the mean time to correction of DKA and complete restoration of the circulation was 11.6 ± 6.2 hours. Any remaining deficits are replenished by oral intake once DKA has resolved and patients are transitioned to subcutaneous insulin. Satisfactory outcomes have also been reported using an alternative simplified method: after initial fluid administration of 20 mL/kg of normal saline, 0.675% saline (3/4 normal saline, 115.5 mmoL sodium) is infused at 2 to 2.5 times the usual maintenance rate of fluid administration regardless of the degree of dehydration, and decreased to 1 to 1.5 times the maintenance rate after 24 hours, or earlier if acidosis resolved.
| Replacement Fluids | Approximate Accumulated Losses With 10% Dehydration | Approximate Requirements for Maintenance (36 Hours) | Approximate Totals for Replacement and Maintenance (36 Hours) | ||
|---|---|---|---|---|---|
| Water (mL) | 3000 | 2250 | 5250 | ||
| Sodium (mmol) | 300 | 70 | 370 | ||
| Potassium (mmol) | 180 | 65 | 245 | ||
| Chloride (mmol) | 180 | 65 | 245 | ||
| Phosphate (mmol) | 75 | 35 | 110 | ||
| Replacement Schedule (Continuous Intravenous Infusion) | |||||
| Approximate Duration | Fluid (Composition) | Sodium mmol | Potassium mmol | Chloride mmol | Phosphate mmol |
| Hour 1 | 600 mL 0.9% NaCl (isotonic saline) | 92 | — | 92 | — |
| Hours 2–6 (200 mL/h for 5 hours) | 1000 mL 0.9% NaCl plus 40 mmol KCl/L | 154 | 40 | 194 | — |
| Hour 7–12 (200 mL/h for 6 hours) | 1200 mL 0.45% NaCl with 20 mmol/L potassium chloride and 20 mmol/L potassium phosphate | 92 | 48 | 101 | 24 |
| Subtotal initial 12 hours | 2800 mL | 338 | 88 | 387 | 24 |
| Next 24 hours 100 mL/h | 2400 mL 5% glucose in 0.45% NaCl with 20 mmol/L potassium chloride and 20 mmol/L potassium phosphate | 185 | 96 | 233 | 48 |
| Total over 36 hours | 5200 mL | 523 | 184 | 620 | 72 |
Clinical assessment of hydration status and calculated effective osmolality are useful guides to fluid and electrolyte therapy. The aim is gradually to reduce serum effective osmolality to normal. There should be a concomitant increase in serum sodium concentration by 0.5 mmol/L for each 1 mmol/L decrease in glucose concentration. The sodium content of the fluid should be increased if measured serum sodium concentration is low and does not rise appropriately as the plasma glucose concentration falls.
The use of large amounts of chloride-rich fluids (combined with preferential renal excretion of ketones over chloride) may be associated with the rapid development of hyperchloremia (defined as a ratio of chloride:sodium [Cl − :Na + ] > 0.79) and hyperchloremic metabolic acidosis. Hyperchloremic acidosis is more common in patients who receive large amounts of 0.9% sodium chloride than in those who receive fluid containing 0.45% sodium chloride. The acidifying effect of chloride can mask recognition of resolution of ketoacidosis when total base deficit is used to monitor biochemical improvement. When hyperchloremia develops, a persisting base deficit or low bicarbonate concentration can be erroneously interpreted as being caused by ongoing ketosis. Measurement of bedside BOHB levels will prevent any confusion and demonstrate that ketoacidosis has resolved. Hyperchloremic acidosis resolves spontaneously. Although the anion gap is useful to track resolution of ketosis, it has two limitations in this setting: it is unable to differentiate a mixed metabolic acidosis (hyperchloremic and ketotic), and the degree of hyperchloremic acidosis is not quantifiable. Normally, the difference between the serum sodium and chloride concentrations is 30 to 35 mmol/L. To partition the chloride component of the base deficit, the following formula has been proposed to enable clinicians to track resolution of ketoacidosis at the bedside: chloride-induced base deficit = (plasma sodium – plasma chloride – 32). The chloride load can be reduced by not giving potassium as potassium chloride (use potassium acetate instead) and by using fluids, such as Ringer’s lactate or Plasmalyte, in which a portion of the chloride is replaced, respectively, by lactate or acetate. Table 21.9 illustrates fluid and electrolyte therapy for a 30-kg child with severe DKA estimated to be 10% dehydrated.
Insulin Therapy
Rehydration alone causes a marked decrease in blood glucose concentration ; however, insulin therapy is essential to suppress glycogenolysis, gluconeogenesis, lipolysis, and ketogenesis; promote normal cellular glucose utilization; and to normalize blood glucose concentrations. Start continuous insulin infusion, 0.05 to 0.1 U/kg/h administered by IV infusion controlled by an infusion pump, at least 1 hour after starting fluid replacement therapy; that is, after the patient has received initial volume expansion. An IV bolus should not be used at the start of therapy; it is unnecessary, may increase the risk of cerebral edema, can precipitate shock by rapidly decreasing osmotic pressure, and can exacerbate hypokalemia. The dose of insulin should usually remain at 0.05 to 0.1 U/kg/h at least until resolution of DKA (pH > 7.30, serum bicarbonate > 15 mmol/L, BOHB < 1 mmol/L, or closure of the anion gap), which invariably takes longer than normalization of blood glucose concentrations. If the insulin effect is adequate serum BOHB should decrease by approximately 0.5 mmol/L per hour. If the patient shows marked sensitivity to insulin (e.g., some young children with DKA, patients with HHS, and some older children with established diabetes), the insulin dose may be decreased provided that metabolic acidosis continues to resolve. For example, if a young child is receiving 0.05 U/kg/h, it may be necessary to reduce the insulin dose to 0.03 U/kg/h to prevent hypoglycemia despite the addition of IV glucose. For mild and moderate DKA (pH > 7.1–7.2), 0.05 U/kg/h (0.03 U/kg/h for age < 5 years with mild DKA) is usually sufficient to resolve the acidosis.
To prevent hypoglycemia, 5% glucose should be added to the IV fluid when the plasma glucose falls to approximately 14 to 17 mmol/L (250–300 mg/dL) or sooner if the rate of fall is precipitous. It may be necessary to use 10% or even 12.5% dextrose to prevent hypoglycemia while continuing to infuse insulin to correct the metabolic acidosis.
In circumstances where continuous IV administration is not possible and in patients with uncomplicated DKA, hourly or 2-hourly subcutaneous (SC) rapid-acting insulin analog is safe and as effective as IV regular insulin infusion. Initial dose SC: 0.3 U/kg, followed 1 hour later by SC insulin lispro or aspart at 0.1 U/kg every hour, or 0.15 to 0.20 U/kg every 2 to 3 hours. If blood glucose falls to under 14 mmol/L (250 mg/dL) before DKA has resolved, reduce SC insulin lispro or aspart to 0.05 U/kg/h to keep blood glucose around 11 mmol/L (200 mg/dL) until resolution of DKA. SC administration of short-acting insulin (regular) every 4 hours is also a safe and effective alternative to IV insulin infusion in children with pH 7.0 or over. A suggested starting dose is 0.8 to 1 U/kg/24 h; the calculated 24-hour dose is divided by 6 to provide an insulin dose injected every 4 hours. Doses are increased or decreased by 10% to 20% based on the blood glucose level before the next insulin injection (e.g., if a child weighs 45 kg: 45 × 0.8 = 36 units; the starting dose is 6 units).
Potassium Replacement
Children with DKA have total body potassium deficits on the order of 3 to 6 mmol/kg. Intracellular potassium is depleted from transcellular shifts caused by hypertonicity (increased plasma osmolality causes solvent drag in which water and potassium are drawn out of cells), acidosis, and glycogenolysis and proteolysis secondary to insulin deficiency also cause potassium efflux from cells. Vomiting and osmotic diuresis are major causes of potassium loss from the body, and secondary hyperaldosteronism in response to volume depletion promotes urinary potassium excretion. Despite total body potassium depletion, serum potassium levels may be normal, increased, or decreased at presentation. Renal dysfunction reduces potassium excretion and contributes to hyperkalemia ; whereas, insulin administration and correction of acidosis drives potassium back into the cells and rapidly decreases serum potassium levels. An abrupt decrease in serum potassium concentration can predispose to a cardiac arrhythmia. Therefore potassium replacement is required regardless of the serum potassium concentration, except when there is renal failure. If the patient has hypokalemia, start potassium replacement (20 mmol/L should be used) at the time of initial volume expansion and before starting insulin therapy. Otherwise, start replacing potassium after initial volume expansion and concurrent with starting insulin therapy. If the patient has hyperkalemia, defer potassium replacement therapy until urine output has been documented. If immediate serum potassium measurements are unavailable, an ECG may help to determine whether the child has hyper- or hypokalemia. Prolongation of the PR interval, T wave flattening and inversion, ST depression, prominent U waves, and apparent long QT interval (because of fusion of the T and U waves) indicate hypokalemia. Tall, peaked, symmetrical, T waves and shortening of the QT interval are signs of hyperkalemia. The initial potassium concentration in the infusion should be 40 mmol/L, and subsequent potassium replacement therapy should be based on serum potassium measurements. Potassium phosphate may be used together with potassium chloride or acetate; for example, 20 mmol/L potassium chloride and 20 mmol/L potassium phosphate or 20 mmol/L potassium phosphate and 20 mmol/L potassium acetate. Administration of potassium exclusively as potassium chloride contributes to the risk of hyperchloremic metabolic acidosis, whereas administration entirely as potassium phosphate can result in hypocalcemia. The maximum recommended rate of IV potassium administration is usually 0.5 mmol/kg/h. If hypokalemia persists despite a maximum rate of potassium replacement, then the rate of insulin infusion can be reduced. Profound hypokalemia (< 2.5 mmol/L) in untreated DKA is rare and necessitates vigorous potassium replacement, while delaying the start of insulin therapy until serum potassium levels are above 2.5 mmol/L to reduce the risk of cardiopulmonary and neuromuscular compromise.
Phosphate
Osmotic diuresis causes phosphaturia and depletion of intracellular phosphate. Plasma phosphate levels fall after starting treatment, exacerbated by insulin, which promotes entry of phosphate into cells. Phosphate depletion has been associated with a variety of metabolic disturbances. Phosphate is essential for the formation of 2,3-diphosphoglycerate (2,3-DPG), which governs the oxygen dissociation curve. Deficiency of 2,3-DPG shifts the oxygen dissociation curve to the left (i.e., more oxygen is retained by hemoglobin and less is available to tissues, a situation that predisposes to lactic acidosis). Acidosis per se shifts the hemoglobin-oxygen dissociation curve toward the right (Bohr effect) and thus partially “compensates” for 2,3-DPG deficiency. Because acidosis is corrected by the provision of insulin, the effects of 2,3-DPG deficiency may no longer be compensated for and release of oxygen to tissues may again be impaired. Exogenous phosphate contributes to the formation of new 2,3-DPG, permitting the oxygen dissociation curve to shift to the right, which facilitates release of oxygen to tissues. Despite the earlier pathophysiological considerations, prospective studies have not shown clinical benefit from routine phosphate replacement.
Clinically significant hypophosphatemia may occur if IV therapy without food consumption is prolonged beyond 24 hours. Severe hypophosphatemia with cellular phosphate depletion is uncommon but can have severe consequences depending on the severity and chronicity of the phosphate depletion. Symptoms usually do not occur until plasma phosphate is less than 1 mg/dL (0.32 mmol/L). Although severe hypophosphatemia can occur during treatment of DKA, symptoms are uncommon because it usually is acute, typically without antecedent chronic phosphate deficiency. Many organ systems can be affected. Manifestations include: metabolic encephalopathy, impaired myocardial contractility, respiratory failure because of weakness of the diaphragm, muscle dysfunction with proximal myopathy, dysphagia and ileus, and rare hematological effects include hemolysis, decreased phagocytosis and granulocyte chemotaxis, defective clot retraction, and thrombocytopenia. Acute hypophosphatemia in a patient with preexisting severe phosphate depletion can lead to rhabdomyolysis. Severe hypophosphatemia associated with any of the earlier symptoms should be treated. Potassium phosphate salts may be safely used as an alternative to or combined with potassium chloride or acetate, provided that careful monitoring of serum calcium is performed to avoid hypocalcemia.
Acidosis
Even severe acidosis is reversible by fluid and electrolyte therapy and insulin replacement; insulin arrests ketoacid production and allows ketoacids to be metabolized, which generates bicarbonate. Treatment of hypovolemia improves tissue perfusion and renal function, thereby increasing the excretion of organic acids. Controlled trials have not shown a clinical benefit from bicarbonate administration. Concern regarding the therapeutic administration of bicarbonate centers on four considerations: shifting the hemoglobin-oxygen dissociation curve to the left may diminish the release of oxygen to tissues and predispose to lactic acidosis; bicarbonate administration accelerates the entry of potassium into cells and may cause hypokalemia ; provision of bicarbonate according to the calculated base deficit overcorrects and may result in alkalosis; and bicarbonate may lead to paradoxical worsening of cerebral acidosis (and cause cerebral depression) during the time when the plasma pH is being restored to normal because HCO 3 − combines with H + ; H 2 CO 3 then dissociates to CO 2 and H 2 O. Whereas HCO 3 − slowly crosses the blood-brain barrier, CO 2 diffuses freely, thereby potentially exacerbating cerebral acidosis.
Severe acidosis decreases respiratory minute volume, may cause hypotension by peripheral vasodilation, impairs myocardial function, and may cause insulin resistance. For these reasons, bicarbonate administration may be beneficial in the rare patient with life-threatening hyperkalemia or unusually severe acidosis (vpH < 6.9) and compromised cardiac contractility. If bicarbonate is considered necessary, cautiously give 1 to 2 mmol/kg over 60 minutes. Bicarbonate must not be given by bolus infusion because it may precipitate cardiac arrhythmias.
Transition to Subcutaneous Insulin Injections
The transition to SC insulin and introduction of oral fluids should occur when substantial clinical improvement has occurred and DKA has resolved. Absence of ketonuria should not be used as an endpoint for determining resolution of DKA and clinicians must appreciate that persistent ketonuria for 1 or more days may not reliably reflect the clinical improvement and should not be interpreted as evidence of a poor therapeutic response. Measurement of urine ketones with test strips (based on chemical reaction with nitroprusside), which measure acetoacetate and acetone (produced by nonenzymatic decarboxylation of acetoacetate) but not BOHB. The usual ratio of BOHB to acetoacetate is approximately 3:1 or 4:1 during fasting, but is commonly greater than or equal to 8:1 in DKA. With correction of acidosis, BOHB is oxidized to acetoacetate and persistent ketonuria typically occurs for several hours after serum BOHB levels have returned to normal.
When ketoacidosis has resolved, oral intake is tolerated, and the change to SC insulin is planned, a dose of basal (long- or intermediate-acting) insulin should be administered in addition to rapid- or short-acting insulin. There may be benefits to earlier administration of a dose of long-acting insulin while the patient is still receiving IV insulin infusion. For example, in one study, 0.3 U/kg of SC insulin glargine was given in the first 6 hours of management and led to faster resolution of DKA. Another retrospective uncontrolled study showed that coadministration of insulin glargine (approximately 0.4 U/kg) early in the course of DKA treatment was well tolerated, did not increase the risk of hypoglycemia, but was associated with more frequent hypokalemia. To prevent rebound hyperglycemia, the first SC injection should be given 15 to 30 minutes (with rapid-acting insulin) or 1 to 2 hours (with regular insulin) before stopping the insulin infusion to allow sufficient time for the insulin to be absorbed. The blood glucose level should be monitored before and 2 hours after each meal, and the insulin dose adjusted to maintain blood glucose concentration in the range of 80 to 180 mg/dL. The specific insulin regimen, dose, and type of SC insulin should be according to local preferences and circumstances (see section Insulin Therapy).
The essential steps in managing DKA are summarized in Boxes 21.3 and 21.4 .
- 1.
Confirm diagnosis
Obtain:
- •
Blood glucose
- •
Blood beta-hydroxybutyrate (BOHB)
- •
Serum electrolytes
- •
Blood gas analysis: venous pH, pCO 2 , HCO 3
- •
Consider:
- •
Urine microscopy/culture
- •
Chest radiograph
- •
Blood culture
- •
Throat culture
- •
Electrocardiogram
- •
Indications for admission to an intensive care unit:
- •
pH ≤ 7.00
- •
Age ≤ 2 years
- •
Unconscious
- •
Blood glucose ≥ 1000 mg/dL
- •
- 2.
Begin intravenous fluids.
- •
10–20 mL/kg of 0.9% (normal) saline (NaCl) over 30–60 minutes
- •
- 3.
Reassess the patient: what precipitated this episode?
- •
Delayed diagnosis
- •
Infection
- •
Noncompliance
- •
Trauma
- •
- 4.
Follow protocol guidelines in Table 21.9 . Begin insulin 0.05–0.1 U/kg/h with hour 2 of IV therapy as outlined in Table 21.9
- 5.
Measure glucose every 2 hours; electrolytes and acid-base status every 2 to 4 hours for the first 24 hours
- 6.
Continue treatment with IV insulin as long as acidosis persists. When plasma glucose approaches 300 mg/dL (17 mM) add 5% glucose to IV fluid and consider reducing insulin to 0.05 U/kg/h
- 7.
If acidosis is not improving despite fluids and insulin infusion of 0.1U/kg/h, consider:
- •
Severe sepsis causing lactic acidosis and/or insulin degradation
- •
Error in preparing intravenous insulin or insulin dose
- •
- 8.
In children age < 10 years (and especially age < 5 years), anticipate possible clinical cerebral edema after 4 to 6 hours of treatment (see Table 21.10 for symptoms and signs)
- 9.
If cerebral edema is clinically apparent:
- •
Reduce rate of IV fluid administration; adjust rate to ensure maintenance of normal blood pressure
- •
Give mannitol 0.5 to 1 g/kg IV over 10 to 15 minutes (3% hypertonic saline 2.5–5 mL/kg is an acceptable alternative)
- •
Repeat in 30 minutes if inadequate response
- •
Elevate the head of the bed to 30 degrees and keep head in midline position
- •
- •
Cerebral edema
- •
Hypokalemia
- •
Hyperchloremic acidosis
- •
Hypoglycemia
- •
Inadequate rehydration
Cerebral Edema
Although most patients appear to recover uneventfully from an episode of DKA, clinically overt cerebral edema manifesting as an abrupt decline in neurological status occurs in 0.5% to 1% of all episodes of DKA and is the major cause of morbidity and mortality, accounting for 60% to 90% of all DKA deaths. In a retrospective analysis involving almost 7000 episodes of DKA, the following risk factors were identified: low partial pressure of arterial carbon dioxide (pCO 2 ) and high serum urea nitrogen concentrations at presentation, and treatment with bicarbonate. In 5% of children, radiographically apparent cerebral edema was apparent before initiation of therapy, and in another study one in five episodes of cerebral edema was evident at initial presentation before any fluid or insulin therapy could have contributed to water accumulation in the brain. These biochemical risk factors may simply reflect the initial severity of biochemical derangements. Thus avoidance of DKA (especially in young children) by early recognition of the signs and symptoms of DM is currently the only way to prevent cerebral edema, and patients with the clinical and biochemical features described earlier require even more careful monitoring.
Despite treatment with hyperosmolar agents (see later), approximately 20% to 25% of patients die and 15% to 35% of survivors have permanent neurological disabilities. Although most patients do not exhibit any obvious neurological decline during treatment of DKA, subtle alterations of neurological function are often detectable after recovery, including deficits in memory, attention, and intelligence quotient. Changes in cerebral morphology have also been demonstrated by magnetic resonance imaging (MRI).
The cause of cerebral edema is controversial. An earlier theory posited that rapid fluid administration, which abruptly reduces serum osmolality, results in osmotic brain swelling (cytotoxic edema), and many treatment protocols advocate slow rehydration with isotonic fluids. It has been observed, however, that the degree of cerebral edema that develops during DKA correlates with the degree of dehydration and hyperventilation at presentation, but not with initial osmolality or osmotic changes during treatment. More recent investigations have not shown associations between the rate of fluid administration and brain injury and a large multicenter prospective randomized controlled trial showed that neither the salt content of the hydrating fluid (0.45% vs. 0.9% saline) nor its rate of administration influenced the development of cerebral edema or affected neurocognitive outcomes. Studies of children and rodent models have found similarities between DKA-related brain injury and ischemia-reperfusion injury: low cerebral blood flow and brain cell swelling, low levels of high-energy phosphates in the brain and elevated lactate levels during untreated episodes of DKA, and cerebral hyperemia and vasogenic edema during treatment of DKA. MRI studies have shown a decrease in the apparent diffusion coefficient after recovery, indicating more pericellular and not intracellular water during treatment. In addition, symptomatic and even fatal brain injury has been reported to occur before initiation of treatment for DKA. The severity of cerebral hypoperfusion per se is unlikely to be sufficient to cause brain injury; therefore other factors probably contribute. DKA is also known to be associated with marked increases in systemic inflammatory cytokines and chemokines that may contribute to brain injury by activating cerebrovascular endothelia and increase leukocyte adhesion ; and increased levels of metalloproteinase may promote blood-brain barrier dysfunction. A current alternative hypothesis posits that cerebral hypoperfusion (from dehydration and hyperventilation) and the effects of reperfusion together with neuroinflammation and cerebrovascular endothelial dysfunction are primarily involved in causing DKA-related brain injury. A prolonged duration and more severe biochemical derangements before therapy may predispose to cerebral ischemia. Younger children would be more prone because of the higher metabolic rate and oxygen requirement of a child’s brain relative to an adult’s brain. In addition, there may be a longer time for idiogenic osmoles to accumulate in the brain. An unexplained conundrum is that many children have evidence of raised intracranial pressure on imaging studies (e.g., computed tomography or MRI) consistent with subclinical cerebral edema frequently associated with mild mental status abnormalities, but only a minority develop clinically overt cerebral edema.
Clinically significant cerebral edema usually becomes apparent within the first 12 hours after therapy has started and when there has been improvement in blood glucose level, acid-base status, and state of hydration, but can be present at initial presentation or, rarely, 24 to 48 hours after the start of treatment. A previously alert patient may become drowsy, complain of severe headache, develop abnormal neurological findings, progress to coma, and have respiratory arrest with herniation of the brainstem. A constellation of bedside clinical observations may facilitate the recognition of developing cerebral edema ( Table 21.10 ). Although useful, it should be noted that the criteria proposed by Muir and colleagues have not been independently corroborated.
| Diagnostic Criteria | Major Criteria | Minor Criteria |
|---|---|---|
|
|
|
a Rapidly increasing serum sodium concentration suggests loss of free water in the urine from diabetes insipidus (consider that it may have been caused by interruption of blood flow to the pituitary gland because of cerebral herniation).
| Insulin Type | Onset of Action (h) | Peak of Action (h) | Duration of Action (h) |
|---|---|---|---|
| Ultrarapid acting analog (faster aspart) a,c | 0.1–0.2 | 1–3 | 3–5 |
| Rapid-acting analogs (aspart, glulisine, and lispro) | 0.15–0.35 | 1–3 | 3–5 |
| Regular/soluble (short acting) | 0.5–1 | 2–4 | 5–8 |
| NPH | 2–4 | 4–12 | 12–24 a |
| Basal long–acting analogs | |||
| Glargine b | 2–4 | 8–12 | 22–24 a |
| Detemir | 12 | 4–7 | 20–24 a |
| Glargine U300 | 2–6 | Minimal peak | 30–36 |
| Degludec c | 0.5–1.5 | Minimal peak | > 42 |
a The duration of action may be shorter.
b Biosimilar glargine approved in some countries.
c Not yet approved worldwide or not for pediatric indication.
Survival and neurological outcome are markedly improved with prompt recognition and intervention with mannitol or hypertonic saline, respiratory support by means of endotracheal intubation, and hyperventilation. Greater awareness, early recognition, and prompt treatment account for the reported decline in mortality (see Table 21.10 and Box 21.5 ).
- •
Hypocalcemia, hypomagnesemia
- •
Severe hypophosphatemia
- •
Hypochloremic alkalosis
- •
Central nervous system complications: dural sinus thrombosis, basilar artery thrombosis, intracranial hemorrhage, cerebral infarction
- •
Venous thrombosis
- •
Pulmonary embolism
- •
Sepsis
- •
Rhinocerebral or pulmonary mucormycosis
- •
Aspiration pneumonia
- •
Pulmonary edema
- •
Adult respiratory distress syndrome (ARDS)
- •
Pneumothorax, pneumomediastinum, and subcutaneous emphysema
- •
Rhabdomyolysis
- •
Ischemic bowel necrosis
- •
Acute kidney injury including renal failure
- •
Acute pancreatitis
Treatment of Hyperosmolar Hyperglycemic Syndrome
The goal of initial fluid therapy is to expand the intra- and extravascular volume and restore normal renal perfusion. During therapy decreasing serum osmolality (from increased glucosuria and insulin-mediated glucose uptake) causes movement of water out of the intravascular space resulting in decreased intravascular volume; pronounced osmotic diuresis may continue for many hours in patients with extremely increased plasma glucose concentrations. Early in the course of treatment of HHS, urinary fluid losses may be considerable and, because intravascular volume may decrease rapidly, the rate of fluid replacement should be more rapid than is recommended for DKA to prevent vascular collapse. The initial bolus should be 20 mL/kg or more of isotonic saline (0.9% NaCl) and a fluid deficit of approximately 12% to 15% of body weight should be assumed. Additional fluid boluses should be given rapidly, if necessary, to restore adequate tissue perfusion. Thereafter, 0.45% to 0.75% NaCl should be administered to replace the deficit over 24 to 48 hours aiming for a gradual decline in corrected serum sodium concentration and serum osmolality. Because isotonic fluids are more effective in maintaining circulatory volume, isotonic saline should be restarted if perfusion and hemodynamic status appear inadequate as serum osmolality declines. Serum sodium concentrations should be measured frequently and the sodium concentration in IV fluids adjusted to promote a gradual decline in corrected serum sodium concentration. Mortality has been associated with failure of the corrected serum sodium concentration to decline with treatment, which may be an indication for hemodialysis.
Although there are no data to indicate an optimal rate of decline in serum sodium concentration, 0.5 mmol/L per hour has been recommended for hypernatremic dehydration. With adequate rehydration alone (i.e., before commencing insulin therapy), serum glucose concentrations should decrease by 4.1 to 5.5 mmol/L (75–100 mg/dL) per hour. A more rapid rate of decline in serum glucose concentration is typical during the first several hours of treatment when an expanded vascular volume leads to improved renal perfusion. If there is a continued rapid fall in serum glucose (> 5 mmol/L, 90 mg/dL per hour) after the first few hours, consider adding 2.5% or 5% glucose to the rehydration fluid. Failure of the expected decrease of plasma glucose concentration should prompt reassessment and evaluation of renal function. Unlike treatment of DKA, replacement of urinary losses is recommended. The typical urine sodium concentration during an osmotic diuresis approximates 0.45% saline; however, when there is concern about the adequacy of circulatory volume, urinary losses may be replaced with a fluid containing a higher sodium concentration.
Insulin Therapy
Whereas tissue hypoperfusion in HHS commonly causes lactic acidosis, ketosis usually is minimal and early insulin administration is unnecessary. Fluid administration alone causes a marked decline in serum glucose concentration as a result of dilution, improved renal perfusion leading to increased glucosuria, and increased tissue glucose uptake with improved circulation. The osmotic effect of glucose within the vascular space contributes to the maintenance of blood volume; therefore a rapid fall in serum glucose concentration and osmolality after insulin administration may lead to circulatory compromise and venous thrombosis unless fluid replacement is adequate. Patients with HHS also have extreme potassium deficits; a rapid insulin-induced shift of potassium to the intracellular space can trigger an arrhythmia. Insulin administration should be initiated when or if serum glucose concentration is no longer declining at a rate of at least 3 mmol/L (~ 50 mg/dL) per hour with fluid administration alone. In patients with more severe ketosis and acidosis, however, insulin administration should be initiated earlier. Continuous administration of insulin at a rate of 0.025 to 0.05 U/kg/h can be used initially, with the dosage titrated to achieve a decrease in serum glucose concentration of 3 to 4 mmol/L (~ 50–75 mg/dL) per hour. Insulin boluses are not recommended.
Electrolytes
Deficits of potassium, phosphate, and magnesium are also greater in HHS than in DKA. Potassium replacement (40 mmol/L) should begin as soon as serum potassium concentration is within the normal range and adequate renal function has been confirmed. Higher rates of potassium administration may be necessary after starting an insulin infusion. Serum potassium concentrations should be monitored every 2 to 3 hours along with electrocardiographic monitoring. Hourly potassium measurements may be necessary if the patient has hypokalemia. Bicarbonate therapy is contraindicated; it increases the risk of hypokalemia and may adversely affect tissue oxygen delivery. Severe hypophosphatemia may lead to rhabdomyolysis, hemolytic uremia, muscle weakness, and paralysis. Although administration of phosphate is associated with a risk of hypocalcemia, an IV solution that contains a 50:50 mixture of potassium phosphate and another potassium salt (potassium chloride or potassium acetate) generally permits adequate phosphate replacement while avoiding clinically significant hypocalcemia. Serum phosphate concentrations should be measured every 3 to 4 hours. Patients with HHS frequently have large magnesium deficits, but there are no data to determine whether replacement of magnesium is beneficial. Replacement of magnesium should be considered in the occasional patient who experiences severe hypomagnesemia and hypocalcemia during therapy. The recommended dose is 25 to 50 mg/kg per dose for 3 to 4 doses given every 4 to 6 hours with a maximum infusion rate of 150 mg/min and 2 g/h.
Complications
Venous thrombosis associated with use of central venous catheters is a common complication in HHS. Prophylactic use of low-dose heparin has been suggested in adults, but there are no data to indicate benefit from this practice. Heparin treatment should be reserved for children who require central venous catheters for physiological monitoring or venous access and are immobile for more than 24 to 48 hours. Rhabdomyolysis (myalgia, weakness, and dark urine) may occur in children with HHS resulting in acute kidney failure, severe hyperkalemia, hypocalcemia, and muscle swelling causing compartment syndrome. Monitoring creatine kinase concentrations every 2 to 3 hours is recommended for early detection. For unknown reasons, several children with HHS have had clinical manifestations consistent with malignant hyperthermia, a condition associated with a high mortality rate. Patients with a fever associated and a rise in creatine kinase concentrations may be treated with dantrolene, which reduces release of calcium from the sarcoplasmic reticulum and stabilizes calcium metabolism within muscle cells. Nonetheless, of the three reported patients with HHS treated with dantrolene only one survived. Altered mental status is common when serum osmolality exceeds 330 mOsm/kg; however, cerebral edema is rare. Among 96 cases of HHS reported in the literature in 2010, including 32 deaths, there was only one instance of cerebral edema. A decline in mental status after hyperosmolality has improved with treatment is unusual and should be promptly investigated.
Mixed Hyperosmolar Hyperglycemic Syndrome and Diabetic Ketoacidosis
Treatment must take into consideration potential complications of both DKA and HHS. Mental status must be closely monitored and frequent reassessment of circulatory status and fluid balance is absolutely necessary to guide therapy. To maintain an adequate circulatory volume, the rate of fluid and electrolyte administration usually exceeds that required for the typical case of DKA. Insulin is essential to resolve ketosis and arrest hepatic gluconeogenesis; however, insulin infusion should be deferred until after the patient has received an initial fluid bolus and the circulation has been stabilized. Serum potassium and phosphate concentrations should be carefully monitored as described earlier for HHS ( Box 21.6 ).
- •
Rapidly infuse isotonic saline (0.9% NaCl) ≥ 20 mL/kg
- •
Assume a fluid deficit of 12% to 15% of body weight
- •
If necessary, additional fluid boluses should be given rapidly, to restore peripheral perfusion
- •
Thereafter, use 0.45% to 0.75% NaCl and aim to replace fluid deficit over 24 to 48 hours
- •
Start insulin infusion when plasma glucose is no longer declining ≥ 50 mg/dL per hour with fluid alone
- •
In patients with mixed HHS and DKA, initiate insulin earlier
- •
IV insulin at 0.025 to 0.05 U/kg/h; titrate dosage to achieve a decrease in plasma glucose of around 50–75 mg/dL/h
- •
Begin potassium replacement (40 mmol/L) as soon as serum potassium concentration is within normal range and adequate renal function has been established
Treatment of type 1 diabetes mellitus
General Principles
Optimal management of the child with T1DM (and T2DM) requires an integrated approach, taking into account the overall level of functioning of the child and family, the nutritional and lifestyle patterns specific to that child, and attention to the overall developmental stages of childhood and adolescence. There is no one appropriate insulin regimen or meal plan. The overriding principle should be that the diabetes care plan should fit wherever possible into the surrounding home and school environments, and that the primary childhood tasks of education, socialization, growth, and maturity continue unhindered by the extra responsibilities that diabetes care entails.
This daunting task of assisting families in managing diabetes is best accomplished by a multidisciplinary team, consisting of physicians, nurse educators and practitioners, dietitians, and mental health professionals, all trained and experienced in the nuances of diabetes care in children. Children with diabetes should be seen by the team at frequent intervals (usually every 3 months in established patients) for assessment of glycemic control, growth, and development; evaluation for related disorders and complications; education; troubleshooting; problem-solving; and screening for adjustment problems that may affect diabetes or the overall health of the child.
Goals of Therapy
The Diabetes Control and Complications Trial (DCCT) established that intensive glycemic management leading to near normal glucose and A1c levels significantly reduced the risk of developing long-term complications and the benefits of this reduced risk outweighed the threefold increase in the risk of severe hypoglycemia. Slowing the development of early retinopathy was observed in the DCCT subgroup of intensively treated adolescents, as well as in adults in the study. In the Epidemiology of Diabetes Interventions and Complications (EDIC) Study, the observational follow-up to the DCCT, a continued increase in risk of complications was seen in the former conventional treatment group years after the end of the randomized controlled trial despite improved metabolic control in the former conventional treatment group, indicating that near normal glucose and A1c levels should be achieved and maintained in patients with T1DM as early in the course of the disease as possible. As a result of this evidence, current recommendations mandate that youth with T1DM should aim to achieve plasma glucose and HbA1c levels as close to normal as possible, as early in the course of the disease as possible, and with as few severe hypoglycemic events as possible.
With respect to specific targets, the ADA treatment guidelines indicate that HbA1c targets should be less than 7.5% and the International Society of Pediatric and Adolescent Diabetes (ISPAD) lowered this to under 7%, although both sets of guidelines emphasize individualizing targets for patients and families to also minimize hypoglycemia and enhance quality of life. Previously, higher HbA1c levels were suggested for very young children because of the potential risk of recurrent hypoglycemia on the developing brain. There are many problems with this approach, including increasing evidence that chronic hyperglycemia is also detrimental to the developing brain and that lower HbA1c can be achieved without increased risk of severe hypoglycemia in children younger than 6 years of age.
Types of Insulin
Currently available insulins are classified based on their duration of action as rapid, short, intermediate, and long-acting, and each is available in a concentration of 100 U/mL (U-100). A higher concentration (U-500) of human regular insulin is available for the patient who has severe insulin resistance. Appropriate dilutions can be prepared for younger patients requiring low doses. The development of recombinant DNA technology to synthesize human insulin and human insulin analogs has changed the face of insulin treatment.
The aim of insulin replacement therapy is to simulate the normal pattern of insulin secretion as closely as possible ( Fig. 21.11 ). This aim can best be achieved through the use of basal-bolus therapy using MDI or continuous subcutaneous insulin infusion (CSII) pump therapy. Until recently, options for insulin formulations were limited. Today, there are more than 10 varieties of biosynthetic human and analog insulins, including human regular insulin, human neutral protamine Hagedorn (NPH) insulin, long-acting insulin analogs, rapid-acting insulin analogs, and several kinds of premixed insulins (see Table 21.11 ).
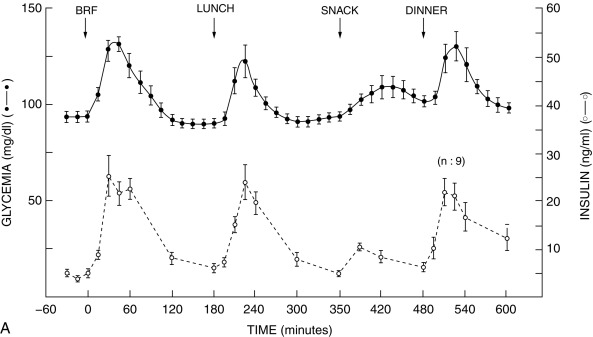
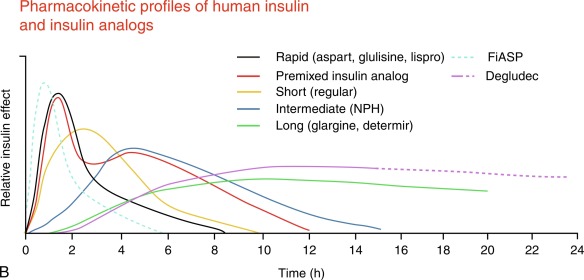
Human Regular Insulin
Human regular insulin was a mainstay of insulin management of youth with T1D until the early 2000s when the advent of rapid-acting insulin analogs virtually eliminated its use in children and adolescents, except for IV administration. The delayed absorption and prolonged duration of action of the large premeal bolus doses of regular insulin that are required by adolescents with T1D to overcome the insulin resistance of puberty contributed to problems with hyper- and hypoglycemia in this age group. Regular insulin remains the insulin of choice for IV infusion in the treatment of DKA. A special U-500 (500 units/mL) formulation of regular insulin is available for use in patients with severe insulin resistance who require very large daily doses of insulin.
Rapid-Acting Analogs
Lispro (Eli Lilly), aspart (Novo Nordisk), and glulisine (Sanofi) insulins are produced by amino acid substitutions in the C-terminal region of the B chain that reduce the affinity of insulin molecules to self-aggregate into hexamers. These modifications allow more rapid absorption of the analog into the bloodstream after subcutaneous injection. A new fast-acting insulin, Fiasp (Fast insulin aspart, Novo Nordisk) has recently been approved for use in children. Compared with regular insulin, the faster absorption of rapid-acting analogs results in higher and sharper peaks and shorter duration of action, pharmacokinetic and pharmacodynamic effects that reduce the risk of late postprandial hypoglycemia and temper early postmeal hyperglycemia. Puberty does not appear to alter the pharmacokinetics of premeal boluses of rapid analogs, but the insulin resistance of puberty reduces the ability of these insulins to stimulate glucose metabolism. Rapid-acting insulin may be safely mixed with intermediate-acting insulins, but mixing with long-acting insulin is not recommended, as such mixing markedly attenuates the peak action of the rapid-acting analog. All three rapid-acting analogs may be used in an insulin pump, and studies have shown them to be safe and effective. Lispro and aspart insulin may be diluted to concentrations less than U-100, such as U-50 or U-25, using diluents obtained from the manufacturer. Diluted insulin is used in very young children and others who are sensitive to insulin and could benefit from the more accurate dosing. Rapid-acting insulin analogs can be given IV, but they have not been shown to be superior to regular insulin. A newer insulin analog is Fiasp, which has a slightly faster onset of action and peak and shorter duration of action.
Intermediate-Acting Insulin
NPH is now the only available intermediate-acting insulin. Although the delay in peak action of NPH given before breakfast provides a means to cover lunchtime glucose excursions, NPH is less than satisfactory for overnight basal insulin replacement. As with regular insulin, the advent of long-acting insulin analogs has largely replaced NPH in basal-bolus MDI treatment in pediatrics. However, NPH is still an effective, intermediate duration insulin, particularly useful in special circumstances, such as poor adherence and in those who may be less economically affluent.
Long-Acting Insulin Analogs
Glargine (Lantus manufactured by Sanofi) and detemir (Levemir manufactured by Novo Nordisk) were the first two commercially available long-acting insulin analogs developed to meet the body’s basal insulin requirements for regulating hepatic glucose production. Insulin glargine is an analog of human insulin with C-terminal elongation of the beta chain by two arginine residues and replacement of asparagine in position A21 by glycine. This analog is soluble in the acidic solution in which it is packaged but relatively insoluble in the physiological pH of the extracellular fluid. Consequently, microprecipitates of glargine insulin are formed following subcutaneous injection, which markedly delays its absorption into the systemic circulation. The action of insulin detemir is prolonged by the addition of a fatty acid side chain that promotes reversible binding with albumin in the interstitial fluid and in the circulation.
Pharmacokinetic and pharmacodynamic studies have demonstrated that these long-acting insulin analogs have flat and prolonged time-action profiles. However, compared with glargine, detemir has been shown to have a more consistent pharmacokinetic profile in children and a more consistent pharmacodynamic profile in adults with T1DM. Basal insulin replacement with insulin detemir is more frequently likely to require two daily injections than treatment with insulin glargine.
Insulin degludec is a new, ultralong-acting insulin that is a product of coupling of Des-B30 threonine insulin to fatty acid side chains. After injection, degludec self-associates, forming long chains of insulin that dissociate very slowly. Plasma insulin levels rise reaching peak concentrations 10 to 12 hours after an injection and the half-life is between 17 to 21 hours, roughly double the duration of action of insulin glargine. Degludec has been shown to be safe and effective in children and adolescents with T1DM.
Premixed Insulin
Various premixed insulin formulations, combining either rapid-acting insulin analogs or regular insulin with NPH or intermediate-acting insulin analogs, are currently available. The percentage of rapid acting/regular to intermediate acting varies with the formulation. The practical advantage of premixed insulins to cover both short- and intermediate-term insulin needs in a single shot is also their greatest limitation. There is less flexibility when using premixed insulin for adjusting the individual insulin components, and this can be particularly problematic in young children or those with variable food intake. Use of premixed insulin has been generally limited to patients and families who have difficulties managing more complicated treatment regimens or in resource limited settings.
Syringes Versus Pens
Insulin syringes come in a variety of sizes that are particularly useful in young children. In addition to the traditional 100-unit (1-mL) syringe marked in 2-unit increments, 50-unit (0.5-mL) and 30-unit (0.3-mL) syringes are available that are marked in single-unit increments, and 30-unit syringes with 1/2-unit markings can also be ordered. These syringes are available with needle lengths from 8 to 13 mm. Insulin pens are also available, both as disposable pens and reusable pens with disposable cartridges. Half-unit dosing is available and may be useful in smaller children.
Initiating Insulin Therapy
Most newly diagnosed patients who present with symptoms of diabetes or are in DKA require upward of 1 U/kg/day at the start of insulin treatment. For asymptomatic patients who are “incidentally” diagnosed with diabetes, for example, during a routine sports physical examination or a well-child examination, starting doses may only need to be around 0.5 U/kg/day or less. The goal of initial insulin therapy in children with T1D should be to achieve near normoglycemia over the first few weeks of treatment to give the child the opportunity to enter the “honeymoon,” or partial remission phase. The honeymoon period results from a combination of improved function of residual beta cells and reversal of the insulin resistance that accompanies uncontrolled diabetes. Prompt achievement of optimal control rather than the methods used to achieve good control appears to be the most important factor in obtaining these outcomes. The ability to achieve target A1c levels with little or no severe hypoglycemia is greatly enhanced in T1D patients with residual beta-cell function.
Some centers admit all newly diagnosed patients to the hospital for initial diabetes education and insulin dose titration, but others have effective outpatient treatment protocols. During the 2 to 3 weeks following discharge, insulin doses are titrated toward target premeal glucose values of 70 to 130 mg/dL during daily telephone contact; patients are seen in follow-up clinic visits, approximately 2, 6, 13, 26, 39, and 52 weeks following diagnosis.
Insulin regimens
Plasma insulin levels in nondiabetic individuals are characterized by relatively low basal levels on which are superimposed meal-stimulated spikes in insulin concentrations. Current intensive treatment regimens attempt to simulate this pattern of plasma insulin fluctuations by using a basal-bolus approach to insulin replacement. Because exogenous insulins are injected or infused subcutaneously rather than directly into the portal vein, their rates of absorption may vary. Also the dose that is injected is determined empirically, so it lacks the precision of endogenously secreted insulin. Thus no insulin replacement regimen will precisely duplicate the pattern of normal insulin secretion; there will be periods of increased plasma insulin concentrations that may produce hypoglycemia and periods of low insulin levels that lead to hyperglycemia. Therefore the goal of current insulin regimens is to minimize the frequency and severity of excursions into the hyper- and hypoglycemic range.
The DCCT and its follow-up, the EDIC studies, established basal-bolus therapy using either MDI or CSII as the gold standard of treatment of T1D. However, insulin only works if the youngster receives it, and other factors must be addressed when determining the best insulin regimen for an individual patient. These factors include the availability of an adult parent/guardian to supervise insulin administration, the ability to count carbohydrates and monitor glucose levels with a glucose meter or a continuous glucose monitor (CGM), and the willingness to wear a pump or take four or more injections of insulin daily.
Multiple Daily Injection Regimens
MDI regimens attempt to replicate normal insulin secretion through the use of a long-acting insulin analog to replace basal insulin needs along with bolus injections of rapid-acting insulin analog to cover food intake and to correct elevations in blood glucose levels. Either once or twice daily basal insulin coverage may be used. Typically, basal insulin accounts for approximately 40% to 50% of the insulin total daily dose (TDD). However, children younger than 5 years of age often require basal insulin doses that are 30% to 40% of TDD, and there is considerable variability between patients. Once-daily glargine or detemir may be given either in the morning or in the evening. Patients treated with detemir may be more likely to need twice-daily injections than those treated with glargine. Some pediatric practitioners mix long- and rapid-acting insulin to reduce the number of injections, but studies indicate that such mixing markedly blunts and delays the absorption and action of the rapid-acting insulin component of the mixture.
Any one of the rapid-acting insulin analogs may be used to cover bolus insulin needs. Ideally, the rapid-acting insulin bolus is given 10 to 15 minutes before eating, but this is a difficult goal to achieve in many youths with T1D. For the most precise dosing of bolus insulin, it is necessary to use an insulin-to-carbohydrate ratio (ICR) and insulin sensitivity or correction factor, as well as the rate and direction of change in sensor glucose levels in patients using continuous glucose monitoring devices. The ICR is defined as the grams of carbohydrate that 1 unit of insulin will cover. This ratio may be determined using the 500 rule, namely, dividing 500 by the TDD will give a starting point for the carbohydrate ratio. For example, in a teenager with a TDD of 50 units, 1 unit of insulin will cover 10 grams of carbohydrate (500/50 = 10). It should also be noted that the ICR frequently differs by time of day because more insulin is often needed per gram of carbohydrate before breakfast and less may be given to cover bedtime snacks. These are intended as guides to then individualize insulin dosing based on glucose results. Accuracy in determining the carbohydrate content of meals is of utmost importance but often a problem in adolescents. Teens tend to underestimate the number of carbohydrates in their meal, and refresher meetings with a dietitian can reinforce the importance of maintaining mastery of this skill. Also carbohydrates are not the sole source of nutrients that require insulin for optimum metabolism; formulas exist for adjusting insulin requirements for protein and fat content. In addition to meal coverage, a correction dose of rapid-acting insulin should be given at meal times to “fix” an elevated blood glucose level. Correction doses may also be given at other points in the day for the same reason. Traditional “sliding scale” insulin doses based on blood glucose levels have given way to more sophisticated dosing algorithms based on an insulin sensitivity factor (ISF); namely, how much will blood glucose be lowered by 1 unit of insulin. The ISF may be determined using the 1800 rule: divide 1800 by the TDD. The correction dose can then be calculated according to the following equation:
Actualbloodglucose(BG)−TargetBG/ISF=Number of units of insulin
Related posts:

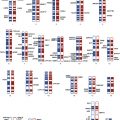
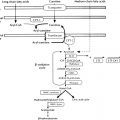
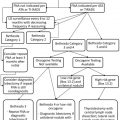
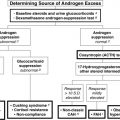
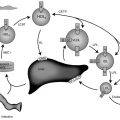
Stay updated, free articles. Join our Telegram channel

Full access? Get Clinical Tree


