Fig. 3.1
Prevalence of type 2 diabetes in Cameroon, 1994–2003 (prevalence standardised to new world population distribution)
Current predictions estimate that the number of people living with diabetes on the continent will almost double over the coming 20 years [1, 51, 110]. This, together with the growing incidence of type 2 diabetes in younger age groups (including in some obese children even before puberty), constitutes a serious cause for concern. In developed countries, most people with diabetes are above the age of retirement (>60 years), whilst in developing countries, those most frequently affected are in the middle, productive years of their lives, aged between 35 and 64 [16]. All types of diabetes are on the increase, particularly type 2 diabetes, and the number of people with diabetes will increase by 55 % by 2035 [1] (Fig. 3.2) (IDF 2015). This underlines the fact that the economic burden of diabetes in developing countries will be amplified by its effect on the working age group.
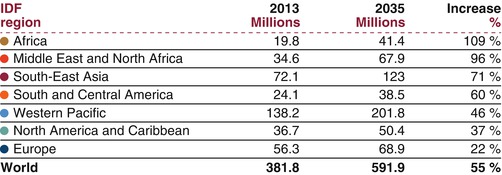

Fig. 3.2
The number of people living with diabetes in 2013 and projections for 2035 (in millions of cases), with projected percent changes (Source of data: IDF Diabetes Atlas [17]. AFR Africa, MENA Middle East and North Africa, EUR Europe, NAC North America and Caribbean, SACA South and Central America, SEA South-East Asia, WP Western Pacific)
Risk Factors for Diabetes in Africa [9]
Age, Gender and Family History
Similar to data from other parts of the world, studies from sub-Saharan Africa (SSA) show that diabetes prevalence increases with age (Fig. 3.3) [18–21]. Therefore, as living standards improve in SSA with a resulting increase in life expectancy, the prevalence of diabetes is expected to increase accordingly. In addition, the age at onset of diabetes may shift more towards younger adults due to the effects of urbanisation and westernisation – increasing obesity, sedentary lifestyle and other diabetes risk factors in younger age groups.
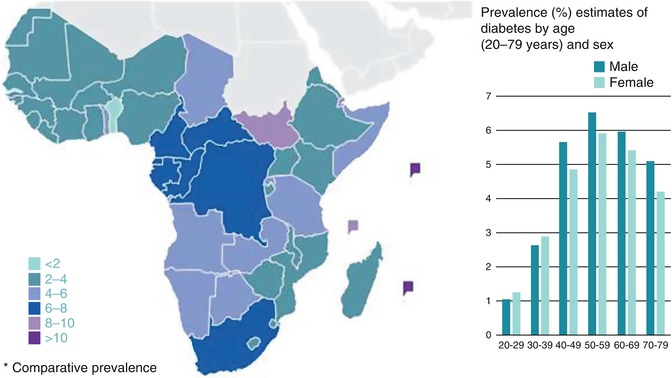

Fig. 3.3
An estimated number of adults with diabetes in sub-Saharan Africa by age group and sex (Source of data: IDF [1])
There is no discernable gender difference in either the prevalence or distribution of diabetes in SSA [22]. This is consistent with observations from other parts of the world as well as with global estimates [23]. It must also be noted that a positive family history of diabetes is an independent diabetes risk factor [18, 19, 24].
Ethnicity, Urbanisation, Migration and Diabetes
Studies from Tanzania and South Africa have shown that diabetes prevalence is lower in the indigenous African community [20, 25, 26] than in migrant Asian Indians [27–29] and when compared with a population of mixed ancestry (Khoi-East Indian-Europid) [30] (Table 3.1). The prevalence rates in Caucasians in SSA have been quite similar to those in Europe (6–10 %), also relatively high [31].
Table 3.1
Ethnic differences in the prevalence of diabetes mellitus (D) and impaired glucose tolerance (IGT) and the effect of migration in Africa
Country | Author year | Ethnic group | Prevalence (%)a | |
|---|---|---|---|---|
Locality | (Reference) | D | IGT | |
Tanzania | McLarty (1989) [26] | Native African | 1.1 | 8.4 |
Ramaiya (1991) [27] | Asian Indian | 9.1 | 16.2 | |
Swai (1990) [28] | Asian Indian | 7.1 | 21.5 | |
South Africa | ||||
KwaZulu Natal | Omar (1993) [25] | Native African | 5.3 | 7.7 |
Omar (1994) [29] | Asian Indian | 13.0 | 6.9 | |
Cape Province | Levitt (1993) [20] | Native African | 8.0 | 7.0 |
Levitt (1999) [30] | Mixed ancestry (Khoi-East Indian-Europid) | 10.8 | 10.2 | |
Sudan | Elbagir (1996) [19] | Native African | 3.4b | 2.9b |
Elbagir (1998) [18] | Mixed Egyptian ancestry | 10.4 | 9.8 | |
Nigeria | Cooper (1997) [32] | Native African | 2.0 | – |
Caribbean | African – origin | 7.2 | – | |
United States | African – origin | 10.8 | – | |
United Kingdom | African – origin | 10.6 | – | |
Cameroon Rural | Mbanya (1999) [33] | Native African | 0.8 | 6.4/3.1c |
Cameroon Urban | Native African | 2.0 | 1.6/4.6c | |
Caribbean | African – origin | 8.5 | 16.3/19.6c | |
United Kingdom | African – origin | 14.6 | 11.1/14.4c | |
SSA is experiencing the fastest rate of urbanisation worldwide, with an average annual rate of change of the urban population of more than 3 % [34]. Currently, more than one-third of the population in SSA live in urban areas. It is estimated that this could increase to 45 % by 2025, with a demographic inflection point to be attained by 2035 – more urban than rural residents [35]. This increase in the urban population is influenced by both the inherent growth of the urban population due to persistent high fertility and longer life expectancy, and also a massive rural-urban migration [34]. This rapid urbanisation in SSA has been identified as a major determinant of the rising burden of diabetes and other cardiovascular diseases [12, 23, 36, 37].
Many studies have clearly demonstrated a positive rural-urban gradient in the prevalence of diabetes and its risk factors, particularly obesity. Urban residence is associated with a two- to fivefold increased risk of prevalent diabetes or impaired fasting glycaemia (Fig. 3.4) [18, 21, 33, 36, 38–42]. Most of these studies considered only the current residence and so may be confounded by the effects of recent rural-urban migration or vice versa. A study from Cameroon [43] that examined both current urban residence as well as total lifetime exposure to an urban environment found that both lifetime exposure to an urban environment and current residence were independently associated with diabetes. Lifetime exposure to an urban environment was strongly associated with fasting blood glucose (r = 0·23; P < 0·001), with the prevalence of diabetes or IFG being higher for individuals with a longer exposure to the urban environment.
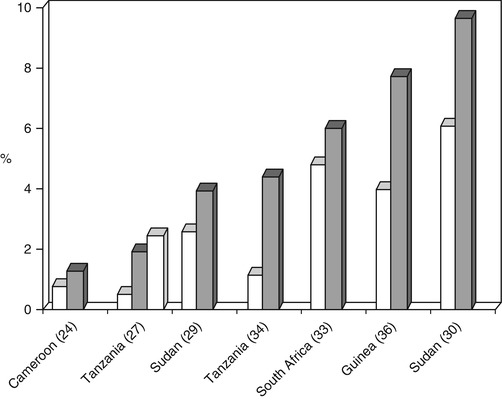

Fig. 3.4
Prevalence of diabetes mellitus (D) in rural [ ] and urban [
 ] communities in community studies in Africa, using randomly selected samples
 ] and urban [
 ] communities in community studies in Africa, using randomly selected samples
Most of these studies from SSA are cross-sectional studies, requiring that inferences about causality or direction be made with caution. Longitudinal studies to provide more robust data on direction and magnitude of change are almost inexistent. In a prospective study of recent rural-to-urban migrants in Tanzania [42], during the first 6 months of urban residence, there was no significant change in their HbA1c level compared to an age, sex and village-matched nonmigrant cohort. However, there was an increase in mean body mass index (BMI) in the recent migrants compared to the nonmigrants. More data is needed to provide answers about societal changes and their influence on human behaviour and cardiovascular risk factors such as diabetes.
A limitation to the discussion on urban and rural differences is the lack of a universally accepted definition for an urban area. Studies of rural-urban differences in diabetes have used local or national norms to define urbanised regions, which may not be similar across studies. The existence of geographically separate residential areas by social class within urban areas may further confound observed differences between studies. Apart from heterogeneity in the definition and attributes of ‘urban area’ across studies, the degree of urbanisation may influence the magnitude of differences in estimates of diabetes or its risk factors. A study in Benin [44] that recruited participants from rural, semiurban and urban areas observed a positive rural and semiurban to urban gradient in metabolic syndrome and obesity, but not for blood glucose or prevalence of diabetes. The prevalence of high fasting blood glucose was significantly lower in urban dwellers compared to their semiurban or rural counterparts.
The impact of environmental influence (migration) in populations of similar genetic origin has been confirmed in two studies which showed that diabetes prevalence was lower in native West African populations in Nigeria and Cameroon than in West African–origin communities living abroad, in the Caribbean, United Kingdom and United States [32, 33] (Table 3.1). In a study comparing rural and urban Ghanaians in Ghana with Ghanaians in the Netherlands [45] adjusting for age and educational level, the Ghanaians living in the Netherlands were more likely to be obese than those in rural Ghana.
Currently, there are growing concerns about the diabetes burden in indigenous populations because these populations may be experiencing a very rapid lifestyle transition. Active subsistence lifestyle is rapidly giving way to sedentary ‘Western’ lifestyles. Indigenous populations are generally neglected in terms of healthcare and research, hence the scanty nature of data about them. A study from South Africa reported a diabetes prevalence of about 5 % among the QwaQwa people [46]. There is currently an increasing global awareness of the vulnerability of indigenous peoples as a result of their socioeconomic disadvantage, limited access to care and marginalisation from the majority of the population [17].
From the above data, it appears to be difficult to categorise ethnicity, urbanisation and migration as distinct and separate risk factors for diabetes. Instead, the correlation should be noted and further study undertaken in this area.
Diabetes and Obesity
Published studies indicate a simultaneous rise in overweight/obesity and diabetes prevalence in most SSA countries [47] (Fig. 3.5). Most people with diabetes are obese at the time of diagnosis [48]. Studies conducted in African countries (Ghana [49, 50], Togo [51], Rwanda [52], South Africa [53] and Nigeria [69]) have reported significant associations between type 2 diabetes and obesity. Many studies of people living with diabetes in Africa have consistently reported excess body weight in >50 % of studied samples. However, there is lack of agreement regarding which of the anthropometric variables used to measure obesity can best predict the development of diabetes. One case-control study conducted in a Ghanaian sample [50] suggests that measures of central, rather than general, obesity appear to be significantly related to type 2 diabetes in Africans. There is little or no data from longitudinal studies with hard endpoints that can shed more light on the predictive value of these different measures of obesity in Africans. This means that there are no African-specific cut-off points for estimating obesity risk, hence the continued use of Caucasian cut-off points for Africans. Further research is needed to establish cut-off points based on African data [55].
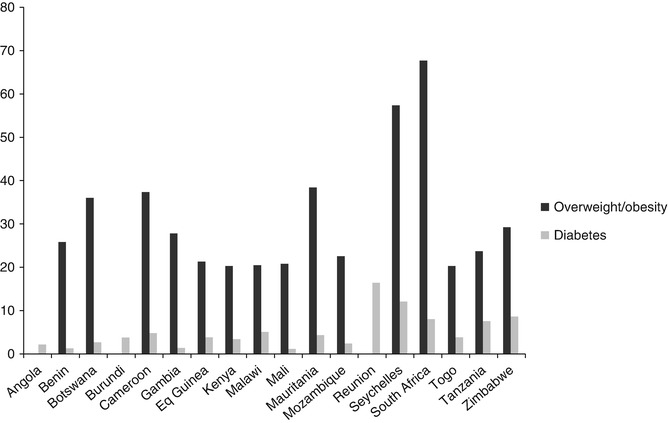

Fig. 3.5
Comparison of overweight/obesity and diabetes prevalence in sub-Saharan Africa (SSA)
Adiposity
In most studies in sub-Saharan Africa (SSA), adiposity has generally been found to be associated with diabetes. These studies have shown that diabetes prevalence is higher with increased BMI (BMI-specific rates) [24, 26, 32, 56], waist-hip ratio (WHR-specific rates) [20, 24, 57] and waist circumference (WC-specific rates) [24]. This means that overall obesity (BMI) as well as central obesity (WC and WHR) are associated with an increased risk for diabetes.
Some researchers have been proposing theories suggesting that some alternate distributions of body fat (such as in the hips, thighs or legs) could confer lower risk for diabetes. The protective role of hip circumference as observed in rural South Africans, confirming recent findings in Australians, requires further evaluation in Africa [24].
Emerging evidence is demonstrating that present day lifestyle habits are not the only contributing factor to adiposity. The developmental origins of adult disease suggest that intrauterine growth retardation and the resulting low birth weight predispose individuals to metabolic disorders in their adulthood [58–60]; the high prevalence of stunting and malnutrition [61, 62] in SSA might escalate the development of these disorders. This combination of childhood stunting and adulthood obesity has led to the proposition that such individuals in their early years acquire the contentious ‘thrifty phenotype’ such that when they rapidly adapt to sedentary lifestyles and high-calorie diets later in their lives, they will be highly prone to obesity-related disorders [59, 63]. The thrifty phenotype hypothesis seems to apply better for the sub-Saharan African populations rather than the thrifty gene hypothesis (theorises that genes derived from times of deprivation may result in adaptations that have adverse effects in times of plenty) [59, 64]. This is because the prevalence rates of T2DM and obesity have been on the increase since the advent of dramatic nutritional/lifestyle changes.
Physical Activity, Diet and Diabetes
Available data strongly links the current epidemiological transition in SSA with rapid urbanisation and westernisation of lifestyle. This changing lifestyle is characterised by decreased levels of physical activity and increased consumption of energy dense or high-fat diets. Although the suggestion of lower physical activity in urban areas compared to rural areas is intuitively plausible, most of the studies on physical activity levels have used self-reported information, mainly using physical activity questionnaires which have not been validated in the population [30, 43, 65–69]. Few studies have used locally validated physical activity questionnaires to demonstrate an urbanisation gradient [42, 70] and the increased risk of diabetes associated with reduced physical activity levels [30].
Studies documenting temporal trends of physical activity levels in SSA using comparable methods are lacking. The adoption and use of the WHO STEPS Global Physical Activity Questionnaire for surveillance of habitual physical activity by many SSA countries [71] will hopefully provide some answers in the near future about trends in population levels of physical activity over time – despite the limitations of self-reported physical activity [68, 69].
Most of the studies which have used objective methods to measure physical activity or energy expenditure are small etiologic studies in specific populations or questionnaire validation studies [65–67, 70, 72–74] and may not be representative of the general population. However, a study in Cameroon [65] using the doubly labelled water method to measure physical activity in free-living adults found physical activity energy expenditure to be inversely associated with 2-h glucose levels independent of age, sex, adiposity or aerobic fitness. Larger studies in Cameroon and Kenya have used a combined heart rate and motion sensor to objectively measure physical activity in free-living individuals [39, 75, 76]. These studies demonstrate a significantly higher physical activity level in rural compared to urban dwellers, and a beneficial association between physical activity and abnormal glucose tolerance.
A high-fat, high-calorie diet is associated with the development of obesity and diabetes. The difficulties of assessing diet and nutritional data in free-living individuals in epidemiologic studies pose an even bigger challenge in many resource-limited settings. Consequently, population level dietary data relevant to diabetes and other chronic NCDs in SSA are scanty [77–79]. A study in South African Blacks showed a temporal trend of increasing consumption of fat and decreasing carbohydrates in both urban and rural areas [77]. However, urbanisation may also lead to a better supply of fruits and vegetables which improve the micronutrient and fibre content of the diet in urban compared to rural areas [79]. The notion of increased consumption of fat as a marker of urbanisation and westernisation of the African diet is not supported by the findings of a study by Mennen et al. which reported the highest consumption of fat in rural Cameroonians, compared to urban Cameroonians, Black Jamaicans and Blacks in Manchester, UK [78].
Impact of HIV/AIDS
In SSA, chronic NCDs such as diabetes receive limited attention due in part to misconceptions that the adult population will be decimated by HIV/AIDS and that few will live long enough to develop such diseases. However, a South African study [80], which modelled the impact of HIV/AIDS for the years 1995 and 2010, clearly showed that the total number of people with diabetes and the number of people with diagnosed diabetes (patient load) will increase regardless of the expected impact of HIV/AIDS on population growth rates and any change (no change, increase) in diabetes prevalence. Since this analysis did not take into consideration the potential impact of antiretroviral therapy (ART) on improving survival rates or possible increase in diabetes incidence, it is likely to be a conservative estimate. However, the ART of choice in sub-Saharan Africa, with its limited healthcare resources, has been linked with an increase in the numbers of people developing prediabetes, and its increased use in the treatment of HIV/AIDS is also projected to cause adverse metabolic abnormalities among patients in SSA [81]. Because of the sheer numbers of people with HIV/AIDS, this effect could directly influence the emerging diabetes crisis in sub-Saharan Africa. Long-term studies to examine the effect of ART on the rising burden of diabetes in SSA are needed.
Clinical Manifestations
The presence of atypical forms of diabetes in sub-Saharan Africa makes it sometimes difficult to classify persons living with diabetes based on established clinical criteria. The disease process may involve peripheral resistance to insulin, increased hepatic production of glucose and lack of insulin production from the pancreas. There are also other causes of diabetes such as genetic abnormalities, surgery, drug usage and infectious diseases [82].
Diabetes mellitus is defined as a “metabolic disorder caused by different factors characterized by a chronic high level of blood sugar with disturbances to carbohydrate, fat, and protein metabolism resulting from defects in insulin secretion, insulin action, or both” [83]. Scientists have divided diabetes into three different types: Type 1 diabetes mellitus (formerly insulin-dependent diabetes mellitus – IDDM) or type 1 diabetes is also known as juvenile onset diabetes. Type 2 diabetes mellitus (non-insulin-dependent diabetes mellitus (formerly non-insulin-dependent diabetes, NIDDM) or type 2 diabetes – adult-onset diabetes) is found in individuals who are insulin-resistant and who usually have relative insulin deficiency. Gestational diabetes mellitus (GDM), the third type, is defined as any degree of glucose intolerance with onset or first recognition during pregnancy. Recently, diabetologists have added a fourth category, tropical diabetes, suggested first in 1907, but made popular by Hugh Jones (J-type diabetes) during the mid-1950s by his study of 13 Jamaican patients [84, 85]. However, tropical diabetes is less than 1 % of the diabetes cases in Africa and is thought to be related to malnutrition [31].
The diagnosis of diabetes usually involves symptoms of diabetes plus either casual plasma glucose concentration ≥200 mg/dl (11.1 mmol/l), a fasting plasma glucose ≥126 mg/dl (7.0 mmol/l) or a 2-h post-load glucose ≥200 mg/dl (11.1 mmol/l) during an oral glucose tolerance test (OGTT) conducted as per WHO recommendations using a glucose load containing the equivalent of 75 g anhydrous glucose dissolved in water [48]. In 2010, a WHO expert committee further adopted cut-off points for using glycated haemoglobin (HbA1c) in the diagnosis of diabetes. It concluded that HbA1c can be used as a diagnostic test for diabetes providing that stringent quality assurance tests are in place and assays are standardised to criteria aligned to the international reference values, and there are no conditions present which preclude its accurate measurement. An HbA1c of 6.5 % was therefore recommended as the cut-off point for diagnosing diabetes, though a value less than 6.5 % does not exclude diabetes diagnosed using glucose tests [86]. The practicality of using HbA1c for diabetes diagnosis in Africa still faces challenges, particularly the high cost of the test relative to blood glucose measurements and also the high prevalence of haemoglobinopathies such as sickle cell anaemia. As the OGTT is much more demanding in terms of time and logistics, HbA1c offers real hope for widespread use in both clinical and research settings even in remote parts of the continent.
Beran et al. surveyed the availability of diagnostic testing tools in a sample of healthcare settings in three countries and found that in Mozambique, urine glucose strips were available in only 18 % of health facilities surveyed, ketone testing strips in 8 % and blood glucose metres in 21 %, whilst availability in Mali was 54, 43 and 13 % and in Zambia 61, 54 and 49 %, respectively [87, 88]. Low levels of adequate glucose control in those diagnosed with diabetes were reported in several prevalence studies [89, 90]. Only 27 % of people diagnosed with type 2 diabetes receiving treatment in a study conducted in Cameroon had adequately controlled glucose levels [89]. Of the 99 people with type 1 diabetes in a Tanzanian survey, only one person achieved suggested glucose targets [90]. None of the 99 people with type 1 diabetes had the ability to monitor their glucose levels at home, and hospitals were unable to routinely do this [68]. A regular supply of insulin was unaffordable for many people with diabetes, with 1 month’s insulin supply costing 19.6 days wages in Malawi [91] and 25 % of the minimum wage in Tanzania [92]. One Sudanese study found that 65 % of a family’s annual household expenditure on health was spent on caring for a diabetic child [93].
Beran and Yudkin found that state interventions affected insulin price, reporting that an annual supply of insulin cost 5 % of GDP in Mozambique, where it was subsidised by the government, whereas it cost 25 % of GDP in Mali without subsidies [88]. One study investigated insulin availability and reported that one in five hospitals and none out of six health centres surveyed had a regular insulin supply [87].
Economic Cost of Diabetes
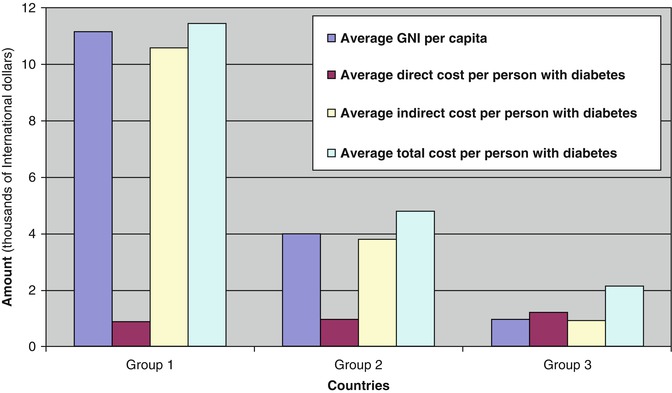
Healthcare in most of SSA is almost entirely privately purchased, even though the majority of the poorest people on earth live in SSA. A recent study by Kirigia et al. [94] clearly demonstrates that the cost of diabetes care is going to be overwhelming for the poorest countries of the region. This study shows that whilst the direct cost of diabetes per person with diabetes is only a fraction (<25 %) of the GNI per capita for the 12 richest countries, the direct cost for the 34 poorest countries of the region is 125 % of their GNI per capita (Fig. 3.6). For these poorest countries, the total cost (direct and indirect costs) of diabetes per person with diabetes is more than double the GNI per capita.
