Fig. 9.1
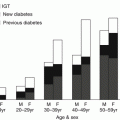
Diabetes or high blood sugar levels by Indigenous status and age (Sources: 2012–2013 Australian Aboriginal and Torres Strait Islander Health Survey and 2011–2012 Australian Health Survey)
Although this overall age pattern was similar to non-Indigenous Australians, diabetes tended to occur earlier. The prevalence of diabetes for Indigenous people aged 35–44 years was 9.0 % which is similar to that for non-Indigenous people aged 55–64 years (8.2 %). Similarly, the prevalence for those aged 45–54 years was 17.8 %, similar to that for those aged 65–74 in the non-Indigenous population (15.0 %). This pattern was apparent for both known diabetes and newly diagnosed diabetes [15].
Minges et al. performed a systematic review of diabetes prevalence in Indigenous Australians prior to the 2012–2013 Australian Aboriginal and Torres Strait Islander Health Survey [16]. Among 24 studies, sample sizes varied from 152 to 29,687 participants, with 71 % of studies having a sample size over 500 people. The mean sample study age ranged from 21 to 51 years. Eighteen studies included blood testing with 14 using WHO diagnostic criteria and 4 the ADA criteria, while 25 % presented self-reported data and 13 % used medical records. The prevalence estimates of diabetes ranged from 3.5 % to 33.1 %. Even when only considering the 16 studies with a mean sample age of 30–40 years, the diabetes prevalence still varied between 6.5 % and 26.2 %. Consequently, the authors were unable to establish a true single prevalence estimate due to the marked heterogeneity of the data. These differences may have been the result of major differences in the Indigenous populations, the Indigenous communities, or in the way studies were conducted.
The most recent study which included 2 h OGTT testing was the DRUID (Diabetes and Related conditions in Urban Indigenous people in the Darwin region) study [17] which included 861 people aged 15 years or older. The overall prevalence of diabetes was 19.4 %. There was a sharp rise in diabetes prevalence with age with 31.7 % of those aged 35 years and over and 52.4 % of those 55 years and over having diabetes. Of the people with diabetes, 48 (28.7 %) were newly diagnosed of whom 24 (50 %) would not have been diagnosed without an OGTT.
The Australian Health Survey reported that 4.7 % of the Indigenous population had impaired fasting glucose (IFG) indicating an increased risk for future diabetes. After taking age differences into account, Indigenous people were nearly twice as likely to be at high risk of diabetes compared with non-Indigenous Australians. The prevalence of IFG increased with age with 7.5 % of those aged 55 and over having IFG [3]. The review by Minges et al. included five studies which reported an IGT prevalence of 4.7–21.1 % [16]. With the exception of one study, there was a greater prevalence of diabetes than IGT. IFG was only assessed in one study of an island population in the top end of Australia and reported a prevalence of 5.1 %. The DRUID study [17] reported a prevalence for IGT of 12 %. In contrast to diabetes, both IGT and IFG remained relatively stable in the age groups above 25.
Type 2 Diabetes in Young People
Craig et al. determined the incidence of type 2 diabetes in young people <19 years old and their characteristics in the Indigenous group in a prospective population-based study. From 2001 to 2006, there were 128 incident cases of type 2 diabetes (62 boys, 66 girls). The median age at diagnosis was 14.5 years (interquartile range, 13.0–16.4), and 90 % were overweight or obese (BMI >85th percentile for age). Mean annual incidence was 2.5/100,000 person-years (95 % CI, 2.1–3.0) in 10–18-year-olds. Of the ethnic groups represented, white Australian comprised 29 %, Indigenous 22 %, Asian 22 %, North African/Middle Eastern 12 %, and Maori/Polynesian/Melanesian 10 %. The incidence of type 2 diabetes was significantly higher in the Indigenous compared with the non-Indigenous group (incidence rate ratio, 6.1; 95 % CI, 3.9–9.7; P < 0.001), but incidence rates of type 1 diabetes were similar (15.5 vs. 21.4/100,000, respectively). Type 2 diabetes accounted for 11 % of incident cases of diabetes in 10–18-year-olds [18].
Type 2 diabetes among Indigenous children and adolescents appears to be increasing in incidence, and the burden is much greater than that experienced by non-Indigenous young people [19]. Indigenous children and adolescents with type 2 diabetes typically have a family history of type 2 diabetes and are overweight or obese and may have signs of hyperinsulinism such as acanthosis nigricans [20]. Onset of type 2 diabetes is usually during early adolescence, and patients are often asymptomatic at presentation. Data on comorbidities at diagnosis are lacking and may be a reflection of poor screening.
There is evidence that young-onset type 2 diabetes is a more lethal phenotype of diabetes and is associated with a greater mortality, more diabetes complications, and unfavorable cardiovascular disease risk factors when compared with type 1 diabetes. Long-term clinical outcomes and survival in young-onset type 2 diabetes were compared with type 1 diabetes with a similar age of onset using an ambulatory diabetes center database. Outcomes in 354 people with type 2 diabetes with age of onset between 15 and 30 years were compared with 470 type 1 diabetes subjects with similar age of onset. The median observation period was similar at 21.4 (interquartile range, 14–30.7) and 23.4 (15.7–32.4) years for the type 2 and the type 1 diabetes cohorts, respectively. A significant mortality excess was noted in the type 2 diabetes subjects compared with the type 1 diabetes subjects (11 vs. 6.8 %, P = 0.03), with an increased hazard for death (hazard ratio, 2.0 [95 % CI 1.2–3.2], P = 0.003). Death in the type 2 diabetes subjects occurred after a significantly shorter disease duration (26.9 [18.1–36.0] vs. 36.5 [24.4–45.4] years, P = 0.01) and at a relatively young age, and there were more cardiovascular deaths (50 vs. 30 %, P < 0.05). Despite equivalent glycemic control and shorter disease duration, the prevalence of albuminuria and less favorable cardiovascular risk factors was greater in the type 2 diabetes subjects and neuropathy scores, and macrovascular complications were also increased [21].
Risk Factors for Diabetes
Obesity
The National Aboriginal and Torres Strait Islander Health Survey showed that four in every ten (39.8 %) Indigenous persons were obese, and these obese individuals were around seven times more likely than normal weight or underweight individuals to have diabetes (17.2 % compared with 2.4 %) [15].
Daniel et al. reported the risk of having IGT and diabetes relative to body mass index (BMI) among 2626 aboriginal men and women aged 15–94 years. The population was divided into five strata of BMI (<22, 22–24.9, 25–29.9, 30–34.9, and ≥35 kg/m2). The prevalence of IGT and diabetes, respectively, adjusted for age and BMI, was 13.9 % and 14.2 % among men and 15.7 % and 15.2 % among women. Odds ratios (95 % CI) for IGT and diabetes for increasing BMI strata ≥22 kg/m2 ranged from 1.7 (1.0–2.9) to 5.1 (2.4–10.5) for IGT and from 2.0 (1.2–3.5) to 6.1 (3.3–11.1) for diabetes. For IGT and diabetes, across genders, the population-attributable risk percentages (95 % CI) for BMI ≥22 kg/m2 were 34.1 % (26.2–41.9 %) for IGT and 46.4 % (38.5–54.5 %) for diabetes [22].
The DRUID study reported the association between various indices of obesity and diabetes after adjusting for age. Among males, the odds ratios for diabetes in the highest quartile compared to the lowest quartile were 10.4 (95 % CI 1.2–90.6) for WHR, 6.0 (1.2–29.6) for waist circumference, and 2.0 (0.6–6.3) for BMI. Among females, the corresponding odds ratios were WHR 25.9 (6.0–112.0), waist circumference 7.5 (2.9–19.2), and BMI 4.8 (2.1–10.8) [17].
Low Birth Weight
Child health, and especially low birth weight, is considered an important factor in the development of diabetes. In 2011, the low birth weight rate for babies born to Indigenous mothers was twice the rate for those with a non-Indigenous mother (13 % compared with 6 %) and was significantly higher in remote areas (15 %) than in non-remote areas (12 %) [23]. Despite these high rates, there has been a significant 9 % decline in low birth weight rates between 2000 and 2011 in Indigenous mothers.
A major factor in low birth weight is smoking. Fifty percent of Indigenous women smoked during pregnancy in 2011, four times the rate for non-Indigenous women, and 51 % of low birth weight births to Indigenous mothers has been attributed to smoking, compared with 19 % for non-Indigenous mothers. After adjusting for age differences and other factors, it is estimated that if the smoking rate for Indigenous pregnant women was the same as for other Australian mothers, the proportion of low birth weight babies could be reduced by 26 % [14].
Social Determinants
There remains a significant gap between Indigenous and non-Indigenous Australians in several parameters which can impact health. These include education attainment rates, employment, household incomes (43 % of Indigenous adults were in the lowest quintile compared with 17 % of non-Indigenous adults), and homelessness [14].
Genetic Studies
There have been a limited number of gene-related studies including studies on diabetes susceptibility genes in Indigenous Australians [24]. Busfield et al. studied an Indigenous Australian community with a phenotype characterized by severe insulin resistance. A genome-wide scan for type 2 diabetes susceptibility genes in a large multi-generation pedigree from this community identified a region of significant positive linkage with type 2 diabetes on chromosome 2q with several candidate genes identified in the region [25]. Another genome-wide analysis found peaks on chromosomes 1 and 21. On chromosome 1, the gene had a strong association with type 2 diabetes, hyperlipidemia, and blood pressure in type 2 diabetes in European populations. The gene with a strong association with type 2 diabetes on chromosome 21 is involved with regulating insulin [26]. Further studies are required to replicate these findings in other Indigenous and international populations.
Gestational Diabetes
Ishak and Petocz investigated the prevalence, trends, and risk factors of gestational diabetes mellitus (GDM) in Indigenous Australians compared with the non-Indigenous population in a retrospective population analysis of 230,011 deliveries from an administrative database in the state of South Australia between 1988 and 1999. The age-standardized GDM rate for Indigenous mothers was more than 2.5 times higher than that for non-Indigenous mothers (4.3 vs. 1.8 %) with no significant trend changes over the time period of the study [27]. However, a more recent systematic review of diabetes in pregnancy included 11 studies which reported prevalence of GDM in Indigenous Australians. The overall rate of GDM was higher at 8.4 % compared with 2–5 % worldwide [28].
People Living in Rural and Remote Areas
Australia’s population is largely concentrated in the east and southeast of the country, and most Australians live in capital cities with the majority living in major cities (71 %), 18 % in inner regional areas, 9 % in outer regional areas, 1.4% in remote areas, and 1% in very remote areas. The proportion living in major cities has increased over the past decade, while the population in very remote areas has fallen [29].
Health outcomes, such as higher rates of death, are worse outside of major cities related to differences in access to services, risk factors, and the remote environment, although it is not possible to apportion the generally poorer health outcomes outside major cities to these factors [30]. With respect to health services, there are lower rates of some hospital surgical procedures, lower rates of primary care physician consultation, and generally higher rates of hospital admission in regional and remote areas than in major cities. There are also significant differences in interregional health behavior and risk factors. People in regional and remote areas are more likely than their urban counterparts to be a daily smoker (outer regional and remote 22 % and inner regional 18 % compared with 15 % in major cities), be overweight or obese (70 % and 69 % compared with 60 %), be insufficiently active (60 % and 63 % compared with 54 %), drink alcohol in harmful quantities (24 % and 21 % compared with 19 %), and have high blood cholesterol (37 % and 38 % compared with 31 %) [31]. In addition, over half of outer regional, remote, and very remote residents live in areas classified as the lowest socioeconomic status compared with around one-quarter of people in major cities and 77 % in very remote areas.
Another contributing factor to the health status of people living in rural and remote areas is the higher proportion of Indigenous people and their generally poorer health outcomes. Most Indigenous Australians live in urban areas – 35 % in major cities, 22 % in each of inner and outer regional areas, and the remaining 21 % in either remote or very remote areas. Nevertheless, they make up a relatively large proportion of the population living in remote areas of Australia – 45 % of all people living in very remote areas and 16 % living in remote areas [30].
Overall, death rates increase with increasing remoteness. In 2012, the age-standardized rate was highest in very remote areas (840 per 100,000 population), followed by remote (670 per 100,000 population), outer regional (640 per 100,000 population), inner regional (610 per 100,000 population), and major cities (550 per 100,000 population) [31]. Death rates in regional and remote areas are between 10 % and 70 % as high as in major cities. Cardiovascular diseases are responsible for nearly a third of the elevated male death rates outside major cities. Male death rates from diabetes are 1.3 times as high in inner regional areas and 3.7 times as high in very remote areas compared with major cities [31].
In 2010, 5.4 % of all deaths that year were attributed to diabetes and causes related to diabetes, although as is well known this will be an underestimate. Diabetes-related death rate was 55 % higher among males than females (39 deaths per 100,000 males and 25 deaths per 100,000 females) [32]. Death rate from diabetes-related causes increased with increasing remoteness – 28 deaths per 100,000 population among people living in major cities, 32 deaths per 100,000 population among people living in inner regional areas, and 43 deaths per 100,000 population among people living in outer regional, remote, and very remote areas.
Diabetes prevalence is also linked with region of residence. Overall in Australia, the age-standardized prevalence of diabetes in 2011–2012 was 4.2 %. Rates of diabetes were 3.9 % in major cities and 4.9 % in outer regional and remote areas [3].
The situation is worse for Indigenous people living in remote areas with around one in five (20.8 %) having diabetes compared with around one in ten people in non-remote areas (9.4 %). This difference is particularly pronounced for newly diagnosed diabetes, which was five times as high in remote areas than in non-remote areas (4.8 % compared with 0.9 %) [3]. In addition, Indigenous adults in remote areas are less likely to have their diabetes effectively managed (25.1 % compared with 43.5 %) and two and a half times more likely to have chronic kidney disease (33.6 % compared with 13.1 %).
People from Culturally and Linguistically Diverse Backgrounds
Around 28 % of Australia’s population was born overseas with migration from more than 200 countries around the world [33]. The proportion of the population born overseas has grown steadily from one in ten (10 %) in 1947. Between 2004 and 2014, Australia’s overseas-born population increased from 4.8 million to 6.6 million people. The largest proportion was born in the United Kingdom (5.2 %) followed by New Zealand (2.6 %), China (excluding Hong Kong) (1.9 %), India (1.7 %), the Philippines (1 %), Vietnam (1.0 %), Italy (0.9 %), South Africa (0.8 %), Malaysia (0.7 %), and Germany (0.5 %) [33]. The relative proportion of Australian residents born overseas is changing with a decrease in those born in the United Kingdom and an increase in those born in New Zealand, China, and India. Of overseas-born Australians, the biggest proportion come from Northwest Europe (including the United Kingdom) (25 %) followed by Southeast Asia (14 %), Southern and Eastern Europe (12 %), Oceania (including New Zealand) (12 %), Northeast Asia (12 %), and Southern and Central Asia (10 %). This increase in cultural diversity has implications for health services and the demographics of health in Australia [30].
Culturally and linguistically diverse (CALD) communities in Australia experience both significant health disparities and a lack of access to services. A systematic review of the literature on the effectiveness of culturally appropriate interventions to manage or prevent chronic disease in CALD communities found that the health of Australia’s CALD population is poor in comparison to the general population. Hospital admissions for CALD people were more than double, particularly for chronic and disabling conditions, such as diabetes, traumatic injury, heart and kidney disease, and respiratory problems [34].
Stay updated, free articles. Join our Telegram channel

Full access? Get Clinical Tree


