Country, income level [1]
GNI per capita, $ (2014) [1]
Total population, millions (2014) [1]
Life expectancy at birth, years (2013) [1]
Diabetes – related deaths (20–79), per 100,000 population 2013 [5]
Armenia, LMIC
3,780
3,006
75
32.6
43.12012
Azerbaijan, UMIC
7,590
9,538
71
24.1
7.82007
Belarus, UMIC
7,340
9,470
72
79.6
3.62009
Georgia, LMIC
3,720
4,504
74
32.9
10.42010
Moldova, LMIC
2,550
3,556
69
37.1
10.72010
Russian Federation, HIC
13,210
143,8
71
137.2
6.32010
Ukraine, LMIC
3,560
45,36
71
45.5
4.92012
Latvia, HIC
15,660
1,990
74
57.9
23.62012
Classification and Unique Aspects of the Pathophysiology of Type 1 and Type 2 Diabetes in Region
Diabetes Epidemiology in Eastern Europe
Several epidemiologic diabetes-related features of seven Eastern European countries and Latvia were taken from the latest International Diabetes Federation (IDF) review [5] and presented in Table 11.2. The first glance at these data causes many questions and concerns.
Diabetes prevalence among adults in all countries of Eastern Europe except Russia is given as a summary of epidemiologic studies conducted in other countries, e.g., diabetes prevalence in Ukraine and Azerbaijan is evaluated, based on studies, and performed among rural residents of Albania. The same assessments for Belarus are made according to research from Turkey, Poland, Russia, and Bulgaria [8]. It is surprising that the data from Turkey was not used for Azerbaijan, as the population of these countries is ethnically related, and extrapolations for Belarus are not limited by Polish data but are conducted according to Turkish and Bulgarian data among others [8].
The biggest surprise is caused by diabetes prevalence data from Russia. The only paper, referenced by IDF experts [8], is a study about type 2 diabetes prevalence among several Siberian ethnic minorities [9]. To project these results onto all of Russia’s territory, let alone to use it for epidemiologic descriptions of other counties, is wrong in our opinion. There are recent epidemiologic studies of diabetes prevalence in Russia according to glucose tolerance test data that included 3,208 randomly selected persons from four Russian regions (Moscow, Rostov, Ekaterinburg, and Nizhniy Novgorod) aged 30–70 year. There were 1,757 (55 %) women and 1,454 (45 %) men included in the study. During the screening process, the general prevalence of diabetes in the above regions was 1.9 % [CI 95 % 1,48–2,47] (n = 62 persons), impaired glucose tolerance 2.8 % [CI 95 % 2.29–3.47] (n = 91 persons). Prevalence of previously undiagnosed type 2 diabetes in the above population is 1.9 %, which approximately corresponds to known T2D prevalence; thus, the actual diabetes prevalence in the studied population was 4.1 % [10]. An error during interpretation or presentation of data from Dogadin et al. [9] can be seen, as some of these same results were published in Russian [11] indicating a 1.1 % prevalence of previously undiagnosed diabetes among 18+ years old residents of Krasnoyarsk (Russia) [11]. Thus, the claim of IDF experts [5] that Russia is a European country with highest number of people with diabetes cannot be confirmed.
The extrapolations regarding diabetes prevalence in Ukraine are not any less doubtful. Indeed, the assumption about the number of adults (20–79 years) living with diabetes (1,043,580 persons) does not significantly differ from the known number of diabetes patients in Ukraine, which allows to anticipate a significantly higher prevalence of diabetes. A recently started investigation of fasting glycemia and glucose tolerance in rural areas of Ukraine revealed that 12 % of persons over 44 years old have diabetes [12, 13] (Table 11.3).
Table 11.2
Some diabetes-related epidemiologic characteristics of the Eastern European countries extracted from the IDF diabetes atlas sixth edition [5]
Country | Adult population (20–79) in 1000s | Diabetes cases (20–79) in 1000s | Diabetes national prevalence (%) | Diabetes comparative prevalence (%) | Diabetes-related deaths (20–79) | Incidence type 1 diabetes (0–14) per 100,000 | Mean diabetes-related expenditure per person with diabetes (USD) |
|---|---|---|---|---|---|---|---|
Armenia | 208,211 | 5,495 | 2,64a | 2,46 | 979 | n.a. | 187 |
Azerbaijan | 642,069 | 14,634 | 2,28a | 2,45 | 2,300 | n.a. | 521 |
Belarus | 711,219 | 44,525 | 6.26a | 5.07 | 7,534 | 5.6 | 357 |
Georgia | 315,113 | 9,342 | 2.96a | 2.45 | 1,481 | 4.6 | 383 |
Moldova | 260,604 | 7,209 | 2.77a | 2.44 | 1,320 | n.a. | 287 |
Russian Federation | 10,892,897 | 1,092,411 | 10.03 | 8.28 | 197,299 | 12.1 | 899 |
Ukraine | 3,485,802 | 104,358 | 2.99a | 2.45 | 20,654 | 8.1 | 314 |
Latvia | 155,223 | 9,570 | 6.17 | 4.58 | 1,152 | 7.5 | 1,135 |
Table 11.3
Most recent diabetes-related epidemiologic characteristics of the Eastern European countries extracted from the national informational sources
Country, reference | Prevalence of the diagnosed diabetes cases, (%) | Prevalencea of the insulin-treated diabetes cases, (%) | Diabetes screening data, % (age group, population type) | Diabetes mellitus incidence in children and adolescents per 100,000 (age group available, years) | Diabetes mellitus prevalence in children and adolescents per 100,000 (age group available, years) |
|---|---|---|---|---|---|
Armenia [14] | 2.0 | 0.3 | n.a. | 7.9 (0–14) | 38.9 (0–14) |
Azerbaijan [15] | 2.0 | 0.3 | n.a. | n.a. | n.a. |
2.9 | 0.7 | n.a. | 13.4 (0–14) | 70.1 (0–14) | |
1.7 | n.a. | n.a. | 10.4 (0–14) | 42.7 (0–14) | |
Moldova [21] | 2.4 | 0.4 | n.a. | n.a. | 47.0 (0–18) |
2.6 | 0.6 | 1.9 (30–70, urban) | 12.0 (0–14) | 72.8 (0–14) | |
15.3 (15–17) | 186.4 (15–17) | ||||
3.0 | 0.5 | 12.7 (45+, rural) | 16.4 (0–14) | 86.9 (0–14) | |
13.7 (30–80, mixed) | 13.1 (15–17) | 210.1 (15–17) | |||
4.1 | 0.9 | n.a. | 16.2/22.1 (0–9) (mal/fem) | 67.3/78.9 (0–9) (mal/fem) | |
15.0/17.0 (10–19) (mal/fem) | 247.6/232.2 (10–19) (mal/fem) |
Diabetes Mortality Trends in Ex-Soviet Eastern European Countries
Economic and political crisis of the last Soviet years and the first decade of independence led to a significant deterioration of the Soviet healthcare system, which in its turn should have led to increase of mortality in post-Soviet countries. It is notable that health systems play a key role in the control and management of diabetes [30], and lower middle-income countries (LMIC) are facing an epidemiological transition, with increases in the prevalence and mortality related to noncommunicable diseases, such as diabetes [2].
Deterioration of insulin access for T1D patients was of course the most anticipated reason for a rise in mortality among diabetics. The term “insulin supply crisis” was sometimes used to refer to problems with free insulin supply in Ukraine [31]. In 2001, Maria Telishevska et al. demonstrated results of a regional (Lviv, West Ukraine) study. Its purpose was to reveal causes of a high death rate among young people with diabetes in Ukraine [32]. It seems that in other post-Soviet countries this issue was ignored until now.
Recently, chief Russian endocrinologists/diabetologists, Ivan Dedov and Marina Shestakova (2013), reported that adult T1D mortality in 2007 and 2012 was 4.81 and 3.26 cases per 100,000 persons, respectively, i.e., according to the authors, there was a “decrease of 28.4 %” [24]. Unfortunately in this case, there is no T1D patient mortality data for previous years, which prevents a more precise tendency assessment. We thought it would be reasonable to use an electronic WHO resource [6] to perform such mortality assessment for seven countries (Fig. 11.1).
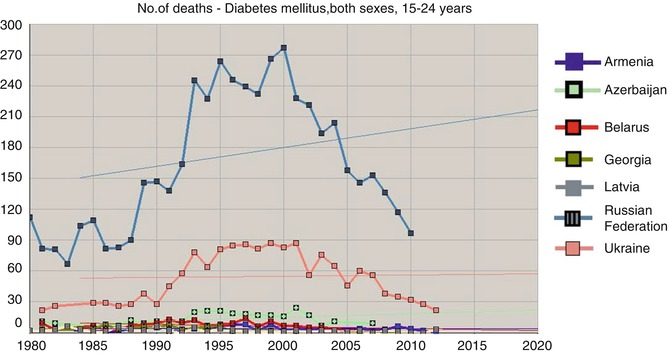

Fig. 11.1
Number of death cases due to diabetes mellitus, both sexes, 15–24 years (Extracted from WHO mortality database [6])
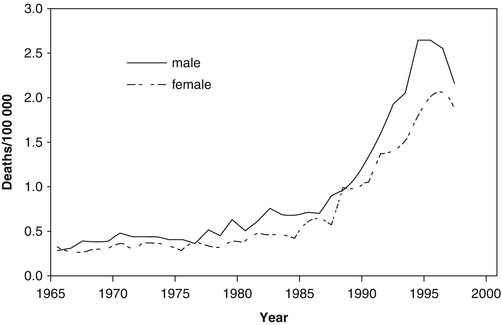
The age of the deceased (15–24 years) allows us to relate them to T1D with high chances and that in its turn makes us assume that a multifold increase of mortality among young persons from 1985 to 2000 can reflect problems with insulin supply. Using the same source [6] and taking into account the number of people of the corresponding gender and age in Russia, Ukraine, and Belarus, we have calculated diabetes mortality indicators for males (Fig. 11.3a) and females (Fig. 11.3b) aged 15–34 years. The data are approximated by a parabolic relation (with high determination factor for Ukraine R 2 = 0.897 and Russia R 2 = 0.879 for males; R 2 = 0.859 and R 2 = 0.889 for females accordingly). For Belarus, the model was credible but less convincing, and, for four other counties, mortality during these years was not assessed or approximated due to a small number of cases.
It must be noted that WHO mortality database [6] only has data about mortality due to diabetes and not about all deceased persons with diabetes. During the Soviet period, all statistical indicators did not have any protection from manipulations at different levels. Sometimes a local health manager could demand for another cause of death to be recorded in a person with T1D, for example, pneumonia (that could have caused a fatal diabetic ketoacidosis) or chronic renal failure so that statistical indicators could be “improved” and diabetes remained unmentioned. Decrease of administrative pressure that started after 1986 in USSR could have led to a more honest classification of mortality causes; thus, an assessment of diabetes mortality growth marked in countries including Ukraine at the end of the twentieth century (Fig. 11.2) cannot be absolutely unambiguous.
In 60 out of 64 insulin-treated subjects who died in Lviv Oblast in 1998 and the first 8 months of 1999 and were under 50 years of age, as identified by Maria Telishevska, diabetes mellitus was listed as the underlying cause of death, and so they would have been recorded in official statistics as dying from diabetes [32]. Chronic renal failure was recorded in 44 (69 %) and ketoacidosis in 4 (6 %) of the cases. Thus, the main cause of death in this cohort was not insufficient insulin access (confirmed in one out of four lethal cases of ketoacidosis) [32] but more likely the absence of renal replacement opportunity. But such possibilities were extremely limited during previous decades, so when explaining the causes of a multifold growth of diabetes-related mortality in Ukraine and other post-Soviet countries, seen during the last decade of the twentieth century (Fig. 11.3a, b), we should note the factor of correct data classification and reporting.
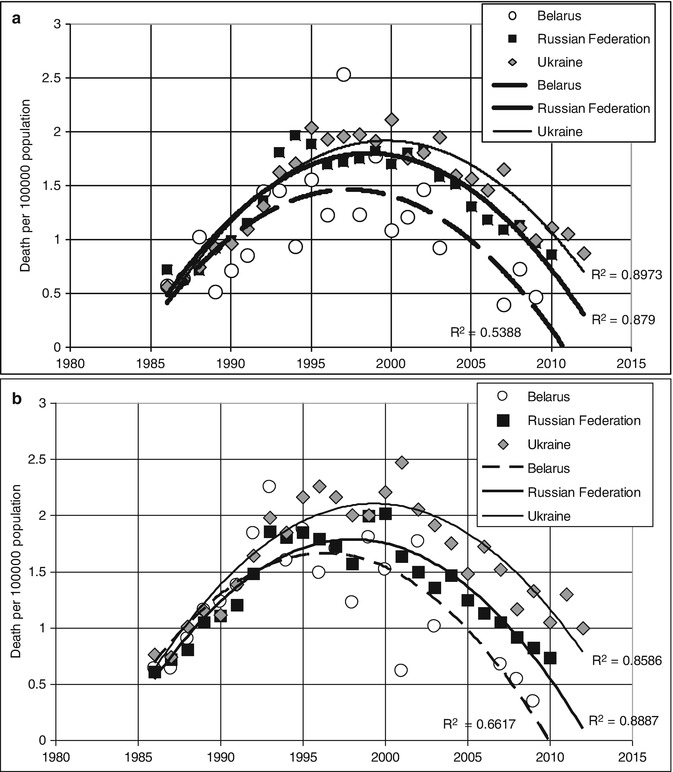

Fig. 11.3
(a) Changes of annual mortality due to diabetes (male, 15–34 years) for three countries. (b) Changes in diabetes mortality (females 15–34 years old) for three countries (Crude data extracted from WHO mortality database [6] with following annual mortality calculation and model approximation)
Diabetes related mortality indexes in Russian young adults (15–34 years old) that we calculated according to WHO mortality database [6] increased from 0.7 to 1.8 in men and from 0.6 to 2.0 in women per 100,000 population (1986 and 1999, respectively) with a gradual decrease to almost initial levels by 2010 (0.85 and 0.7). Taking into account recent recommendations about differentiation of diabetes mellitus clinical types, which use age at diagnosis <35 years as one of the two main hallmarks of the T1D [33, 34], most diabetes-related death cases in young adults (15–34 years old) can be considered T1D. These indicators are significantly lower than those, given by Russian authors for 2007 and 2012 (4.81 and 3.26 death cases per 100,000 adult population, respectively) as portrayal of T1D mortality [24]; however, in the latter case the data involves mortality of T1D adults of any age from all causes. The data about mortality dynamics, recently reported by Russian authors, are based on information from a diabetes patient register, updated annually since 2007 [24]; therefore, it would be logical to expect an evaluation of mortality cases in relation to the number of registered patients, i.e., with due account for the number of person-years (PY) of observation, and not relative to adult population. Such exact mortality evaluations can be seen in an assessment of data from a Latvian diabetes register: Mortality in a population with diabetes decreased statistically significantly from 57.76 per 1,000 PY in 2000 to 45.33 per 1,000 PY in 2012. The age-standardized mortality ratio of the population with diabetes to the population of Latvia decreased from 1.71 (95 % CI 1.62–1.81) in 2000 to 1.23 (95 % CI 1.19–1.27) in 2012 [35]. Mortality tendency for men and women with diabetes in Latvia are shown in Fig. 11.4. Unfortunately, there is no analysis of mortality tendencies of two main types of diabetes (T1D and T2D) according to this register’s data.
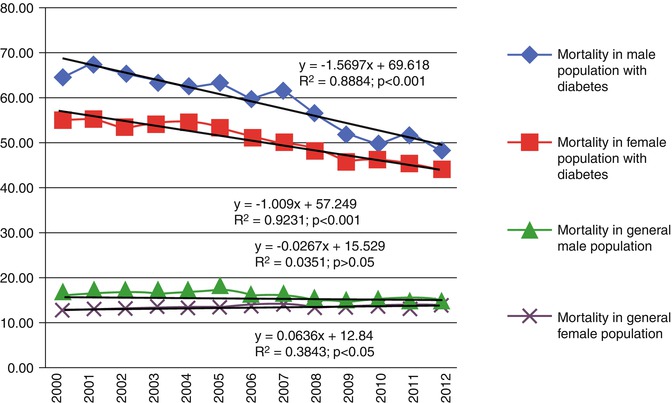

Fig. 11.4
Mortality rate differences by gender in a population with diabetes and general population of Latvia 2000–2012, per 1,000 PY (The figure is reproduced from Pildava et al. [35] with permission of the publisher, Elsevier)
Ivan Dedov [36] points out that the average life expectancy among men with T2D in Russia somewhat exceeds the one for the general Russian population (according to Russian official healthcare data in 2009 average life expectancy was 62.9 years for men and 75 years for women). According to the author, this is associated with a thorough health monitoring of T2D patients, who frequent the doctor to correct glucose-lowering treatment and other risk factors of cardiovascular mortality: arterial blood pressure, lipid metabolism, and blood clotting [36]. These reasons can be accepted only as explanation for the increasing of average age at death of diabetic patients, recently recorded by various population registers (in Ukraine [37, 38], Belarus [17], and Russia [24]). Comparing average life expectancy (according to age at the time of death) of T2D patients in this case is inappropriate, as the frequency of T2D grows with age, i.e., it is wrong to compare average life expectancy in general population at birth with a T2D population, the average age at the time of diagnosis in Ukraine was 57.3 years [38]. That is why, for example, patients with Alzheimer’s disease die later, comparing to the general population not because of a more intensive treatment but due to this illness being diagnosed later in life.
Our cross-sectional analysis of nationwide Ukrainian diabetes mellitus patients register discovered an increase of age at the time of death among T2D patients in 2007, comparing to 2002. This increase was much greater for those being treated with oral antidiabetic drugs (OAD) comparing to insulin-treated patients [37, 38]. Age at death of insulin-treated T2D patients, from 2002 to 2007, increased by 1.54 (95 % CI 0.81–2.26) years, and those who used OAD – by 6.27 (95 % CI 3.67–8.87) years. Life expectancy for the general population of Ukraine, which survived until they were 55 years old in 1989, was about 22 years (Fig. 11.5 ). According to WHO life tables, life expectancy for Ukrainians in 55–59 age group was 20.4 years in 2006. Life expectancy at age 60 years for Ukrainians was 17 in 2000 and 18 years in 2012 [39]. In other words, life expectancy for type 2 diabetes patients achieved in 2007 (age at the time of death = 68.68 years for insulin treated and 72.72 years for OAD treated) remains lower than in the general Ukrainian population. These data correspond to an analysis based on the data from the Framingham Heart Study, according to which diabetic men and women 50 years and over lived on average 7.5 and 8.2 years less than their nondiabetic equivalents [40].
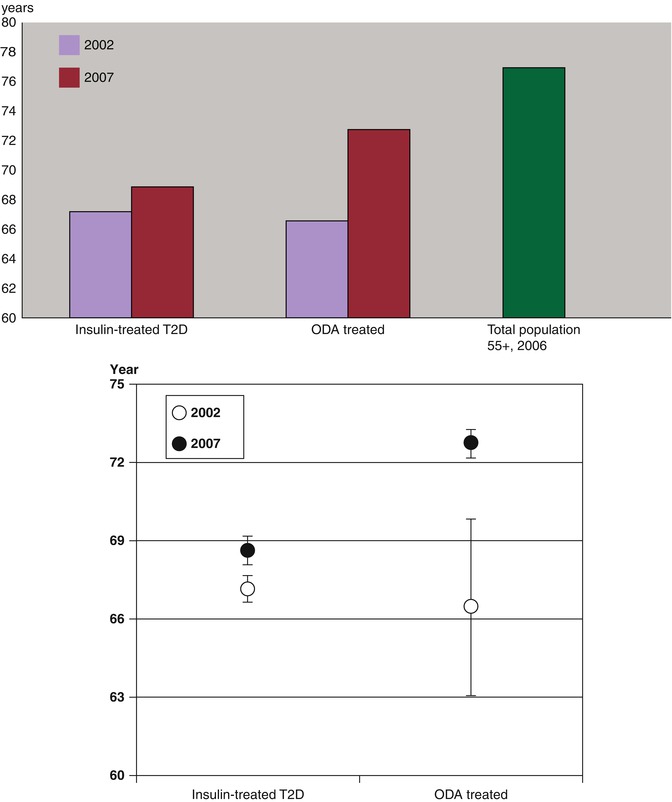

Fig. 11.5
Changes in life expectancy of type 2 diabetes patients in Ukraine, estimated by analyzing the average age at the time of death of those who died in 2002 (N = 1228) and 2007 (N = 2050) according to the analysis of diabetes register. Lower panel presents mean age and 95 % CI of the insulin-treated and OAD-treated T2D groups [37]
Gender and Age-Related Aspects of Diabetes Patient Mortality: Issues of Recording and Classifying Death Cases
Using a constantly functioning patient register1 allows to study the epidemiology of T1D diagnosed in adults and to consider gender differences. The aim of this study is to analyze mortality among T1D patients in Ukraine within the gender aspect. We have used a database with 384,080 DM patients with the first entry made on 12 February 1998 and the last entry on 28 December 2007. We have grouped patients according to probable DM type (T1D – age at the time of diagnosis <30 years in case of receiving insulin treatment), as well as grouping according to gender and age. General assessment of observation duration in age groups of this cohort was performed using the calculation of person-years. We have analyzed the vital status in groups from 15 to 64 years during the whole observation period, as well as for 2003, 2004, and 2005 (for each year separately). Standardization according to age group and gender was conducted according to official Ukrainian mortality data in 2003. Odds ratios (ORs) and 95 % confidence intervals (CIs) were calculated. In the same way, the relation of mortality risk, associated with the male gender, was evaluated using ORs in T1D patients. Data about general mortality in Ukraine was taken from the official WHO website 11 December 2006.
We have created a large cohort of T1D patients (29,791 persons, Table 11.4). In general, mortality among men exceeds such among women: mortality ORs for men and women = 1.37 (95 % CI 1.24–1.5) p < 0.0001. Women with T1D from this cohort also have higher average age and disease duration (p < 0.0001) comparing to men. At the same time, average life expectancy, calculated according to average age at the time of death, did not significantly differ depending on gender (p = 0.47). We should note a very low (40.23 years) average life expectancy of T1D patients in Ukraine.
Characteristics | All | Men | Women |
|---|---|---|---|
Number of patients, n (%) | 29,721 (100) | 15,187 (51.1) | 14,515 |
Total mortality cases, n (%) | 1,917 (6.45) | 1,119* | 798 |
Mean age, years (SD) | 32.54 (11.91) | 31.98 (11.45)* | 33.12 (12.34) |
Mean age at diagnosis, years (SD) | 17.74 (7.5) | 17.96 (7.46) | 17.52 (7.52) |
Mean age at death, years (SD) | 40.23 (13.04) | 40.41 (12.50) | 39.98 (13.76) |
Mean T1D duration, years | 13.91 (11.05) | 13.34 (10.83)* | 14.52 (11.25) |
Follow-up period in age groups: | 151,018 | 76,566 | 74,452 |
15–24 years, PY | |||
25–34 years, PY | 246,252 | 134,602 | 111,650 |
35–44 years, PY | 222,302 | 114,382 | 107,920 |
45–54 years, PY | 175,750 | 81,125 | 94,625 |
55–64 years, PY | 62,639 | 29,122 | 33,517 |
65–74 years, PY | 21,456 | 9,966 | 11,490 |
75 + years, PY | 3,126 | 1,396 | 1,730 |
Stratification of observation period duration according to age groups is given in Table 11.4. The highest number of person-years of observation coincides with the age period between 15 and 64 years, which justifies further analysis of mortality in these age groups. We should mention that only a small preponderance of person-years of observation for women starts only at 45 years old which differs significantly from the gender-age distribution of the general population of Ukraine.
Table 11.5
Relative mortality rate of T1D patients who are in the Ukrainian register of diabetes in comparison to general population of Ukraine by age groups (15–64 years old)
Age | 2003 | 2004 | 2005 | |||
|---|---|---|---|---|---|---|
OR | 95 % CI | OR | 95 % CI | OR | 95 % CI | |
A – women | ||||||
15–24 | 9.44 | 6.21–14.3 | 9.6 | 6.25–14.7 | 8.6 | 5.34–13.8 |
25–34 | 10.6 | 8.08–13.9 | 6.64 | 4.72–11.34 | 8.37 | 6.21–11.3 |
35–44 | 6.67 | 5.0–8.89 | 5.71 | 4.18–7.8 | 4.14 | 2.86–5.99 |
45–54 | 3.18 | 2.28–4.44 | 4.08 | 3.06–5.43 | 2.5 | 1.75–3.56 |
55–64 | 2.38 | 1.51–2.36 | 2.15 | 1.38–3.36 | ||
B – men | ||||||
15–24 | 3.21 | 2.14–4.83 | ||||
25–34 | 3.09 | 2.43–3.95 | 3.28 | 2.59–4.14 | 2.41 | 1.83–3.16 |
35–44 | 2.77 | 2.21–3.46 | 2.69 | 2.15–3.37 | 1.95 | 1.49–2.54 |
45–54 | 1.49 | 1.12–1.99 | 1.54 | 1.17–2.02 | ||
55–64 | ||||||
Relation of mortality risks for persons with T1D in relation to the general population of Ukraine somewhat decrease with age and is significantly higher for women than for men (Table 11.5a, b). For women with T1D aged 15–34 years, there is no mortality gender difference, usually for the general population of Ukraine (Table 11.6).
Table 11.6
Risks of all-cause mortality for men relative to women among T1D patients and the general population Ukraine stratified by age
Age group, years | T1D | Total population (Ukraine, 2002) | ||
|---|---|---|---|---|
OR (95 % CI) | P | OR (95 % CI) | P | |
15–24 | 0.197 | 2.95 (2.81–3.09) | <0.001 | |
25–34 | 0.110 | 3.49 (3.37–3.61) | <0.001 | |
35–44 | 1.79 (1.50–2.13) | <0.001 | 3.64 (3.56–3.73) | <0.001 |
45–54 | 1.60 (1.32–1.93) | <0.001 | 3.22 (3.17–3.28) | <0.001 |
55–64 | 1.39 (1.06–1.82) | 0.021 | 2.61 (2.58–2.65) | <0.001 |
Thus, according to a short observation period of nearly all Ukraine T1D population, the absolute mortality of young women and men of the corresponding age turned out to be the same, unlike in the general population. And relative mortality of young women was several times higher, comparing to relative mortality among males.
The comparison of mortality rate indicators of diabetic patients with the mortality of the general population of Latvia showed that women with diabetes had higher relative mortality rate than men (Table 11.7). For example, in the 20- to 29-year-old women group with diabetes, the mortality rate was 11 times higher than that of women in the population of Latvia in the same age group, but in the 30–39 age group – nearly seven times bigger. The mortality rate of men with diabetes compared to that of men in the population of Latvia was increased most in the 20–29 age group – by more than four times [35].
Table 11.7
The relative mortality rate of diabetic patients who are in the register of diabetes in comparison to general population of Latvia by age groups
Age group | Male | Female | ||
|---|---|---|---|---|
RR | 95 CI | RR | 95 CI | |
<20 | 2.37 | 1.13–4.97 | 2.47 | 0.93–6.59 |
20–29 | 4.47 | 3.31–6.02 | 11.34 | 7.34–17.45 |
30–39 | 4.33 | 3.37–5.03 | 6.67 | 5.21–8.78 |
40–49 | 2.47 | 2.23–2.69 | 3.42 | 2.99–3.89 |
50–59 | 1.62 | 1.54–1.70 | 2.25 | 2.12–2.39 |
60–69 | 1.34 | 1.29–1.38 | 1.99 | 1.93–2.06 |
70–79 | 1.30 | 1.27–1.34 | 1.65 | 1.62–1.69 |
80+ | 1.04 | 0.99–1.08 | 1.12 | 1.09–1.15 |
This way, analysis of diabetic registers in Ukraine and Latvia shows a significantly higher risk of all-cause mortality in young women with diabetes comparing to women without diabetes, than in men with diabetes comparing to women without diabetes.
Investigation of a T1D patient cohort from the UK, which like the Ukrainian diabetic register was created based on data from primary care doctors (7,713 patients, last observation 1999), concluded that the risk of death in relation to persons without diabetes is the highest for young T1D patients, and it is greater among young women, than men [52]. A study from Ukraine [48] confirms this conclusion, complementing the fact that the gender difference of mortality among T1D patients 15–34 years old can disappear. This increase of mortality risk among young women with T1D has not been sufficiently explained. One possible explanation can be the following: Ischemic heart disease (IHD) in T1D patients is observed at a younger age [53], and women get it at the same frequency as men [54]. Premenopausal women, due to higher levels of nitrogen oxide that men, have a more intensive endothelium-dependent vasodilation. Diabetes leads to endothelial disfunction which neutralizes this difference between men and women [55]. Data about the increase of general mortality relative risk for women with T1D that were obtained as a result of analyzing population registers of some Eastern European and Baltic states can be seen as an epidemiologic confirmation of the need to continue fundamental research into the reasons of gender differences of the clinical progression and consequences of T1D.
While trying to reveal causes of the described phenomenon, we performed a meta-analysis (Fig. 11.6a, b) of diabetes-related mortality data comparing to the general mortality in seven countries. The data were extracted from WHO mortality database [6].
Increase of diabetes-related mortality risk (in relation to general mortality for a specific age group in men and women) for women comparing to men in Russia, Ukraine, and Azerbaijan in 15–34-year age group (Fig. 11.6a) and in Russia, Ukraine, Azerbaijan, Armenia, and Belarus (Fig. 11.6b) in 35–54 age group was demonstrated. A generalization of relative risks for this age group was performed for all seven countries in order to confirm the assessment in 15–34 age group (Fig. 11.6a). During heterogeneity testing (p = 0.45), the homogeneity hypothesis was not rejected; therefore, the Mantel-Haenszel model was chosen (generalized RR = 3.1 (95 % CI 2.6–3.6). In 35–54 age group, the homogeneity hypothesis was rejected (p = 0.008); therefore, the random effects model was chosen (generalized RR = 2.0 (95 % CI 1.6–2.4).
Thus, the fraction of death cases “from diabetes” within the general mortality for females aged 15–54 turned out to be greater, than the corresponding number for males. This pattern is more prominent in young women.
Thus, it seems that the female gender lowers the chances of survival of diabetic women not only as a result of activating cardiovascular pathology and not only in the youngest women.
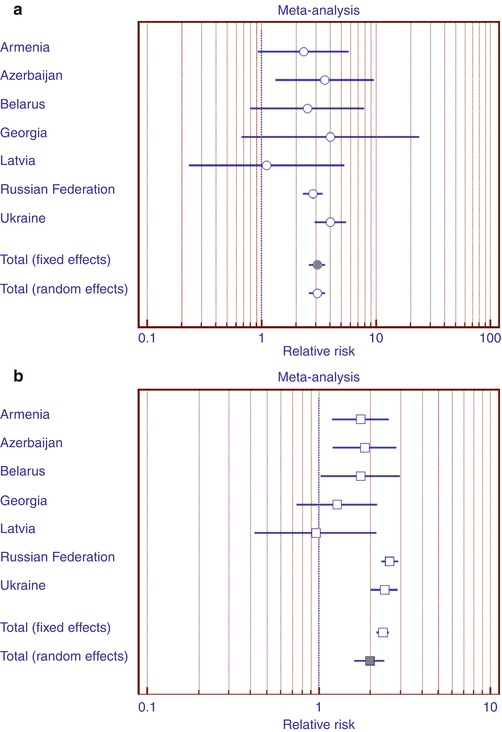

Fig. 11.6
Diabetes-related mortality risks (in relation to general mortality for a specific age group in men and women) for women comparing to men in 15–34 (a) and 35–54 (b) year age group
EURODIAB has reported an SMR of 2.0 in 12 European countries that followed 28,887 children with T1D (141 deaths during 219,061 person-years) with a range of SMR from 0 to 4.7 among the countries included in the study [52]. Life expectancy of T1D patients in Ukraine in 2007, assessed according to age at the time of death, did not exceed 40.2 years [48]. In the UK, according to similar cohort study, this value is 55 years [52]; however, the British cohort also included children, which could influence the assessment of average T1D duration and age at the time of death. Renal failure is the leading cause of death (28.4 %) in Ukrainian T1D patient cohort [50], whereas according to a British study of diabetes mellitus patient register containing primary care data, the leading cause of death among T1D patients was CVD [56]. Similar results were obtained by a European study, EURODIAB [57]. Comparison of main causes of death according to EURODIAB data and Ukrainian Diabetes Register (UDR) data is shown in Fig. 11.7. Apparently, death from renal failure among T1D patients in Ukraine prevails several times over other causes, while in other parts of Europe the main cause of death is CVD. It was previously noted by epidemiologists that the main cause of death for T1D patients is renal failure [58]; however, these data were relevant in 1960s–1970s. Today’s experts believe that the shift in mortality structure toward CVD happened due to intensification of hypotensive therapy and insulin treatment [59]; therefore, the mortality structure of T1D patients that we have revealed when analyzing UDR can be assumed to conform to earlier time period of clinical practice. An earlier investigation that we have previously cited [32] also indicates that renal failure is the main cause of death among young diabetic patients in Ukraine [32].


Fig. 11.7
Interval estimation of structure (%) of the main death causes among T1D patients, diagnosed before 30 years of age according to EURODIAB data (white boxes) and the Ukrainian Diabetes Register (black boxes). Death causes: CVD (a); renal failure (b); DKA or coma (c); cancer (d). Note: given means (%) ± SE (the dot within the box and height of boxes, respectively), 95 % CI (lines that emerge above and below the boxes) (Data from Ukrainian Diabetes Register given according to Khalangot et al. [50]; EURODIAB given according to Soedamah-Muthu et al. [57])
In summary, the performed analysis of diabetes mortality trends in ex-Soviet Eastern European countries allows to make the following conclusions:
For 15 years after 1985, the WHO mortality databases recorded a multifold diabetes-related mortality growth in several East European countries, including Russia, Ukraine, and Belarus.
After the year 2000, there is a gradual reduction of diabetes-related mortality in these countries.
The analysis conducted in Ukraine indicates that the main cause of death for T1D patients is renal failure. As renal dialysis therapy in USSR was scarce, one may assume that post 1985 diabetes-related mortality growth can reflect not just issues with insulin supply, but also a decrease of administrative pressure, when recording the cause of death in corresponding documents.
Reduction of general mortality, demonstrated by some diabetes population registers (Latvia), and an increase of average age at the time of death (Ukraine, Russia, Belarus) allows to assume that the decrease of diabetes-related death cases, recorded by WHO mortality databases, is a real phenomenon, rather than a reflection of change of policy toward recording the cause of death in corresponding certificates.
According to data from diabetic registers in Latvia and Ukraine, the phenomenon of female gender-related increase of general mortality in young women was confirmed. We saw this for the first time when comparing the fraction of those who died due to diabetes within general male and female mortality in East European countries according to WHO mortality databases.
Some Aspects of the Pathophysiology of Type 1 and Type 2 Diabetes in Ukraine
Association Between Early-Life Events and Risk for Diabetes Mellitus in Ukraine Population
The “thrifty phenotype” hypothesis proposed by Hales and Barker [60] suggests that inadequate nutrition during in utero development can result in long-term adaptive changes in glucose-insulin metabolism (including reduced capacity for insulin secretion and insulin resistance) that, due to an enhanced ability to store fat, improve survival under postnatal conditions of nutritional deprivation. However, windows of plasticity close early in life, and postnatal environmental exposures may lead to the selected trajectory of becoming inappropriate, resulting in adverse effects on adult health. If mismatch exists between the environment predicted in utero and the actual environment experienced in subsequent life (e.g., excess food consumption), diabetes and other features of the metabolic syndrome will result. To study this prediction, associations between early-life conditions and the risk of developing diabetes mellitus in adulthood have been studied in Ukraine population. The main findings of these studies are presented in subchapters below.
Association Between Prenatal Exposure to the Ukraine Famine of 1932–1933 and Type 2 Diabetes
Nutrition during pregnancy has been proposed as an explanation for the occurrence of type 2 diabetes later in life, but direct measures are hard to obtain. To better identify any effects of early nutrition, studies of man-made famines can offer distinct opportunities for the unbiased comparison of individuals born under such conditions with unexposed controls [61]. These approaches can provide information about specific pregnancy exposures, especially if the population at risk, the timing and degree of exposure and relevant health outcomes can be accurately defined. For type 2 diabetes in later life, studies of the Dutch famine of 1944–1945 Lumey et al. [62], the Chinese famine of 1959–1962 Li et al. [63], and three famines in twentieth century Austria Thurner et al. [64] all suggest a relation with early-life nutrition. All these studies have a particular strength: The timing of the famine in relation to the stage of gestation was particularly well defined in the Dutch study, as was the risk of adult hyperglycemia in the Chinese study, and a large number of patients receiving antidiabetic drugs over a long time period was included in the nationwide Austrian study. However, no study combines all these strengths. To overcome the limitations of previous approaches, the setting of the Ukraine famine of 1932–1933 was used to study the association between early-life nutrition and late-life type 2 diabetes in a large population, in cohorts well defined with respect to the timing of the famine in relation the stage of pregnancy and the severity of the famine around the time of birth [65].
Stay updated, free articles. Join our Telegram channel

Full access? Get Clinical Tree


