PEARLS
❖ Change in population size depends on the rates of birth, immigration, death, and emigration. Growth in the total population is most sensitive to a decline in mortality rates, whereas growth in the older population is due to a decline in fertility rates.
❖ Between 2014 and 2060, the US population is projected to increase from 319 million to 417 million, reaching 400 million in 2051.
❖ In 2014, 46 million people aged 65 years and older lived in the United States, accounting for 15% of the total population. The projected growth of the older population is expected to increase to 74 million by 2030, representing 21% of the total US population.
❖ In 2014, non-Hispanic single-race white, black, and Asian individuals accounted for 78%, 9%, and 4% of the US older population, respectively. Hispanic individuals (of any race) were 8% of the older population.
❖ In 2015, older men were much more likely than older women to be married. Approximately 74% of men between the ages of 65 to 74 were married compared with 58% of women in the same age group. The proportion was lower at older ages; 42% of women aged 75 to 84 years and 17% of women aged 85 years and older were married in 2015. For men, the proportion was also lower at older ages but not as low as for older women. Even among men aged 85 years and older, the majority (59%) were married in 2015.
❖ In 2015, older men were more likely to live with their spouse than older women. About 70% of older men lived with their spouse, whereas less than half (45%) of older women did. In contrast, older women were more likely than older men to live alone (36% vs 20%).
❖ Life expectancy in 2014 at birth was 3.4 years higher for white people compared with black people. However, among those who survive to 85 years and older, life expectancy in black people is 6.9 years compared with 6.5 for white people.
❖ Viewed as a homogeneous group, the majority of older adults are free of disability until extreme old age. In 2014, 22% of the population aged 65 years and older reported having a disability as defined by limitations in vision, hearing, mobility, communication, cognition, and self-care. Women were more likely to report any disability than men (24% vs 19%).
❖ It is estimated that the number of minority older adults will grow at a more rapid rate than the number of white older adults over the next 60 years.
❖ In 2014, about 12% of people aged 65 years and older reported participating in leisure time aerobic and muscle-strengthening activities that met the 2008 Physical Activity Guidelines for Americans. The percentage of older people meeting the physical activity guidelines decreased with age, ranging from 15% among people aged 65 to 74 years to 5% among people aged 85 years and older.
❖ After adjusting for inflation, health care costs per capita increased slightly among those aged 65 to 74 years between 1992 and 2012. In all years, the average costs were substantially higher for those aged 85 years and older compared with those in the younger age groups.
❖ In 2013, about two-thirds of people who had difficulty with one or more activities of daily living received personal assistance or used special equipment; 7% received personal assistance only, 35% used equipment only, and 25% used both personal assistance and equipment.
❖ In approximately 30 years, there will be 850 million older adults worldwide.
Demography is the scientific study of the population. The demography of aging as a subfield of general demography has become increasingly important as it relates to the concerns of social gerontologists.1 The study of the demography of aging is currently focused on determining the state of the older population; changes in the numbers, proportionate size, and composition of this subpopulation; the component forces of fertility, mortality, morbidity, migration, and immigration; and the impact of these demographic changes on issues related to the social, economic, and health status of older adults in an aging society.1,2 Distinct subgroups within the older population, which were somewhat ignored in the past, have also been receiving increased demographic emphasis in the past few years.3 This development appears to reflect societal concerns about the policy challenges of meeting the welfare and health needs of all components of an aging society.4
Gilford5 determined that there are serious data gaps in the existing demographic information. One such data gap has been identified in the area of the subgroup termed the oldest-old. Because of the special concerns regarding the relatively high rates of illness and disability and the concomitant implications for health care and social service provisions in this age group, the oldest-old have been presented by demographers as a geriatric imperative for future research.6
A HISTORICAL PERSPECTIVE: POPULATION AGING
The study of population aging has a relatively long history.7 Attention to population aging emerged in France at the close of the 19th century, when the proportion of persons aged 65 years and older exceeded 5%. By the 1900s, this had increased to 8%. Sweden also experienced considerable population aging in the 19th century.8 Sundbarg8 was the first to place emphasis on the relative proportions of aged individuals in a society and the first demographer to note systematic differences in age composition among countries. By implication, he hypothesized that there would be a demographic shift over time toward an aging population structure in all countries.9
For most Western countries, the aging of the population has been a distinctly 20th century phenomenon. In the United States, concerted demographic attention to the aging process can be found as early as the 1920s,10 and increasing concern was expressed in the 1930s when the declining fertility of the Depression led demographers to project rapid changes in the age structure of the United States.11–13 Today, there is an increasing awareness that population aging will be an important issue in developing countries currently experiencing social and economic growth.14 Population aging is now recognized as a worldwide phenomenon that commands immediate attention if effective societal responses are to be made to changing demographic realities.1 As a result, many issues have emerged, such as the degree to which countries are able to make commitments to social welfare and health care policies in light of other priorities they face in the allocation of social and economic resources.15,16
DEMOGRAPHIC PROCESSES AND POPULATION AGE STRUCTURE
Change in the size of a population over time depends on the rate persons join the population through birth or immigration and the rate they leave the population through death or emigration. Persons born in a common year (ie, classified by common age) are often grouped together as a birth cohort.17 Such cohorts can be followed to reconstruct population history and to project future population change.
Traditionally, demographers have used the age of 65 for delineating old age. This facilitates standardized analyses and is grounded in social practices (eg, retirement and Social Security provisions). In addition, because slightly more men than women are born in human populations and the mortality experiences of men and women differ, demographers typically distinguish the sex of persons in constructing models of population change.3
The number of persons who survive to any given age depends on the number of persons born into that cohort, the rate at which they survive, and the extent to which their numbers have changed because of cumulative differences between immigrants and emigrants. For example, the number of persons reaching the age of 65 in 1990 depended on the number of persons born in 1925, the cumulative probability that they survived each of the next 65 years, and the relative balance between the movement of persons from that age cohort into the United States or out of the United States from 1925 to 1990. The number of persons aged 65 years and older in 1990 increased compared with the number of older adults in 1989 because the addition of this new cohort to the population of older persons was greater than the subtraction of persons who died in all cohorts aged 65 years and older during that year.3 Thus, the population of older persons can grow either because the size of the entering birth cohort is much larger than that of previous cohorts or because improvements in survivorship have reduced the number of deaths that might otherwise have occurred among older adults. Demographers use the aging pyramid to graphically depict cohort distribution from year to year. Figure 1-1 shows the age structure of the US population in 1910.18 Contrast this pyramid with the age structure of the US population in 1980 depicted in Figure 1-2, when the 1900 to 1910 birth cohort reached the 70 years of age and older category.18 Figures 1-3, 1-4, and 1-5 demonstrate the significant shift in the older population that occurred in the year 2000 (see Figure 1-3) and the anticipated increase in the older population projected for 2025 (see Figure 1-4) and 2050 (see Figure 1-5). A distinction is drawn between “aging at the apex” (ie, when the proportion of older persons in a population increases) and “aging from the base” (ie, when the proportion of younger persons in a population decreases). Please visit data.census.gov to see the US population by age and sex and the population growth by region.
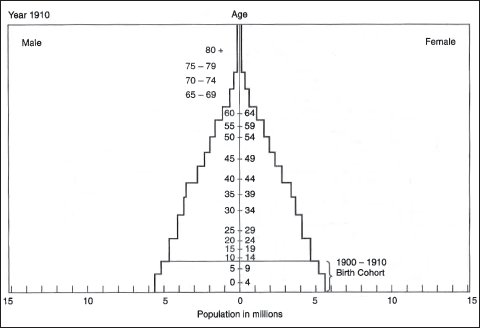
Figure 1-1. A population pyramid summary of age structure of the US population according to the 1910 census. (Reprinted with permission from Beth J. Soldo, “America’s Elderly in the 1980s,” Population Bulletin 35, no. 1 [1980].)
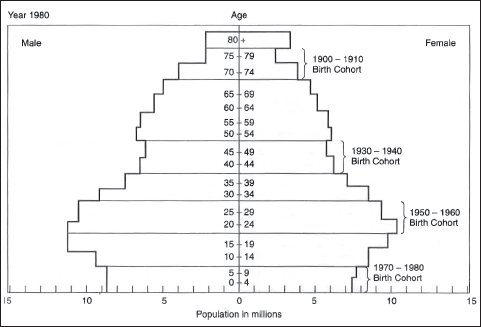
Figure 1-2. A population pyramid summary of age structure of the US population according to the 1980 census. (Adapted from Bouvier LF. America’s Baby Boom generation: the fateful bulge. Pop Bull. 1980;35[1]:1-48.)
Historically, fertility is the most important determinant of population growth and the age structure of the population. Demographers view fertility as the critical process of renewal. When the fertility rate is high, the cohort born each year has more members than the cohorts that preceded it. At moderate to low levels of mortality, the number of newborns added to the population exceeds the number of older persons who die; the proportion of the population that is young increases, and its median age declines. When the birth rate is low, the proportion of the population that is old increases, and its median age rises.
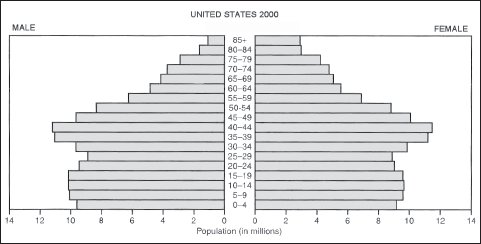
Figure 1-3. A population pyramid for the US population in 2000. (Adapted from the US Census Bureau International Data Base.)
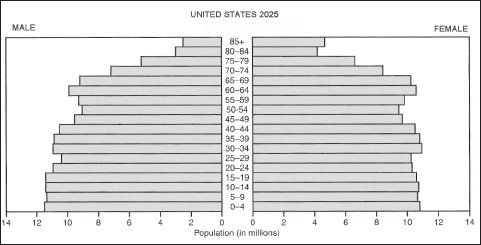
Figure 1-4. A population pyramid for the projected US population in 2025. (Adapted from the US Census Bureau International Data Base.)
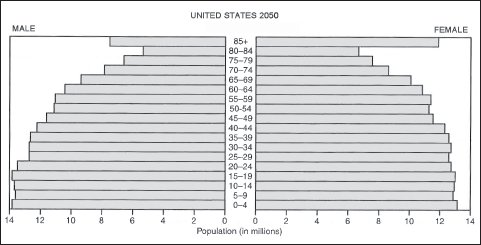
Figure 1-5. A population pyramid for the projected US population in 2050. (Adapted from the US Census Bureau International Data Base.)
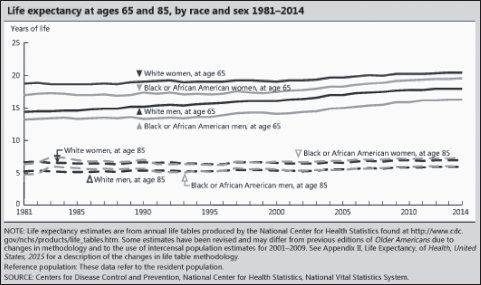
Figure 1-6. The number of persons 65 years and older from 1900 to 2030 (numbers in millions). (Adapted from the US Bureau of the Census and the National Center for Health Statistics.)
The effect of a decline in mortality from high to moderate levels, which occurred in the United States in the late 19th and early 20th centuries as infectious diseases were brought under control, paradoxically caused the population to become younger.19 The reason for this relationship between mortality and age structure is that the most important improvements in survivorship during this period occurred in the age groups of infants and children. However, recent advances in the prevention and treatment of cardiovascular disease have increased the survivorship of older persons. Since 1940, the major reason for the increase in the number of the oldest-old, those aged 85 years and older, has been the improved survivorship of the old.20 About two-thirds of the 1980 to 1985 increase in the proportion of older persons in the population was caused by the mortality decline.21 The tremendous increase in the projected number of older adults during the next 50 years results from the large cohorts born during the post–World War II baby boom reaching old age and the improved survivorship at all ages, especially the oldest-old.19
The growth of the total population is particularly sensitive to declining mortality rates, whereas the growth of the older population, especially in its proportionate size relative to the total population, occurs when the fertility rate declines.22 In fact, declines in mortality focused at younger ages that are not accompanied by decreases in the fertility rate can lead to an overall younger population. The sustained decrease in mortality that extends into older ages is the main reason for current population aging.21
PROJECTED POPULATION TRENDS IN AN AGING SOCIETY
The projected demographic trends indicate that by the year 2030 there will be over 69 million older Americans.19,23,24 In 1960, Census Bureau statistics indicated that there were 16.7 million persons aged 65 years and older. In 1998, 34.4 million people were aged 65 years and older,24 reflecting major changes in the population structure of the United States in this century. Figure 1-6 represents the growth of older individuals in the United States since 1900 and the anticipated growth to the year 2030.
In 2014, 46 million people aged 65 years and older lived in the United States, accounting for 15% of the total population. The older population grew from 3 million in 1900 to 46 million in 2014. The oldest-old population (those aged 85 years and older) grew from just over 100,000 in 1900 to 6 million in 2014.25
The Baby Boomers (those born between 1946 and 1964) started turning 65 years in 2011, and the number of older people will increase dramatically during the 2014 to 2030 period. The older population in 2030 is projected to be twice as large as their counterparts in 2000, growing from 35 million to 74 million and representing nearly 21% of the total US population.
The growth rate of the older population is projected to slow after 2030, when the last Baby Boomers enter the ranks of the older population. From 2030 onward, the proportion of those who are aged 65 years and older will be relatively stable, ranging from 21% to 24%, even though the absolute number of people aged 65 years and older is projected to continue to grow. The oldest-old population is projected to grow rapidly after 2030, when the Baby Boomers move into this age group.
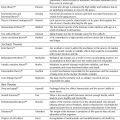
Table 1-1. Life Expectancy in Years of US Population at Birth by Race and Sex

Adapted from the Administration on Aging.25
The US Census Bureau projects that the population aged 85 years and older could grow from 6 million in 2014 to 20 million by 2060. Some researchers predict that death rates at older ages will decline more rapidly than is reflected in the US Census Bureau’s projections, which could lead to faster growth of this population. Life expectancy at ages 65 and 85 years by race and sex for the time range of 1981 through 2014 is provided in Figure 1-6.
Between 2014 and 2060, the US population is projected to increase from 319 million to 417 million, reaching 400 million in 2051. The US population is projected to grow more slowly in future decades than in the recent past because these projections assume that fertility rates will continue to decline and that there will be a modest decline in the overall rate of net international migration. By 2030, 1 in 5 Americans is projected to be 65 and older; by 2044, more than half of all Americans are projected to belong to a minority group (any group other than non-Hispanic white alone); and by 2060, nearly 1 in 5 of the nation’s total population is projected to be foreign born.19 These forecasted changes indicate that there will be a reduction in the growth of the total population to a level of 1% annually.1 However, even at a level of 1% annual growth, it is anticipated that the total population will double over the next 50 years.19
Table 1-1 shows how dramatically life expectancy of the US population has increased from the early 1900s to the projected life expectancy in the year 2050.18,25 The major part of the current increase in life expectancy occurred because of reduced death rates for children and young adults. Life expectancy at age 65 increased by only 2.4 years between 1900 and 1960 but has increased by 3.3 years since 1960. In fact, life expectancy at birth has increased from 74.3 years in 1982 to 76.7 years in 2000 and is projected to increase to 81 years of age by 2060.19 In 1997, Americans reaching age 65 had an average life expectancy of an additional 17.6 years (19 years for women and 15.8 years for men).25 A child born in 1997 can expect to live 76.5 years, about 29 years longer than a child born in 1900.25 Male life expectancy increased from 70.6 years in 1982 to 72.9 years in the year 2000 and is expected to rise to 76.7 years by the year 2050. Women who could expect to live 78.1 years in 1982 attained a life expectancy of 80.5 years in 2000 as projected. Life expectancy is anticipated to increase to 86.2 years by 2060 for women. Some researchers feel that it will improve even more than the Census Bureau projections assume.26–28 Life expectancy is expected to gain an additional 12.8 years if the current demographic trends persist over the next 50 years.
PROJECTED COMPONENTS OF CHANGE IN AN AGING POPULATION
Fertility Patterns
On May 7, 2017, the US population clock was projected to cross the 325 million threshold according to vintage 2016 population estimates produced by the US Census Bureau.19,23 Short-term projections for the resident population of the United States use a monthly series of population estimates starting with the April 1, 2010, resident population from the 2010 Census. These projections do not include members of the US Armed Forces overseas or other US citizens residing outside the United States.
In the middle series for the overall US population, the number of births is expected to remain above the present level of 3.7 million throughout the early 2000s. The peak number of births (3.9 million) may actually have already occurred in the late 1980s.19 After the early 1990s, the birth rate did not surpass 3.7 million because of a decline in the female population of childbearing age. In the early 2000s, the number of births was projected to fluctuate between 3.4 million and 3.7 million.
Age Composition of the Aging US Population
It is anticipated that the percentage of the total population aged 65 years and older will increase from the level of approximately 13% in the year 2000 to 21.2% by 2030 (nearly double) using the middle series Census Bureau estimates.24 The older population will continue to grow significantly in the future (see Figure 1-6). This growth slowed somewhat during the 1990s because of the relatively small number of babies born during the Great Depression of the 1930s, but the older population will burgeon between the years 2010 and 2030 when the Baby Boomers reach the age of 65.25 By 2030, there will be about 70 million older persons, twice their numbers since 1998.
The older population itself is getting older. The 85 years of age and older population will grow at a more rapid rate than the entire 65 and older population, assuming that the oldest-old population will benefit from the improvements in future mortality rates. In 1998, the 65- to 74-yearold age group (18.4 million) was 8 times larger than in 1900, but the 75- to 84-year-old age group (12 million) was 16 times larger, and the over 85 years age group (4 million) was 33 times larger.25 According to population studies, there are currently more than 4 million Americans aged 85 years and older. This number is projected to increase during the beginning of the 21st century to approximately 4.9 million and reach 8.6 million persons over the age of 85 by 2030.19,25 Currently, about 1% of the population is aged 85 years and older. By 2050, 5.2% of the population will be that old. Within the present population of 65 years of age and older, this comprises 9.1% aged 85 years and older.23 Projections indicate that by the year 2050 those 85 years of age and older will make up one-quarter of the entire older population.25,27
For the population of those aged 100 years and older, a substantial growth in the overall numbers is also anticipated. According to the 1990 Census Bureau report,23 there were about 32,000 centenarians in the population. By the year 2000, this number grew to 108,000 and is expected to reach an estimated 492,000 persons over the age of 100 by the year 2030. Currently, about 90 older persons turn 100 years old every day, and by the year 2030, 280 persons each day are expected to be passing their first century of life.25
Sex Composition of the Aging US Population
Accompanying the aging of the population is an increasing proportion of women compared to men as age increases. Older women outnumbered men by 3 to 2 as a result of sex differentials in mortality that favor women at all ages over 65 years. For those 85 years of age and older, women outnumbered men 5 to 2 in 1990,29 which increased to a ratio of 7 to 1 by 1998.30,31 In other words, higher proportions of women than men survive to old age. These ratios are expected to sharply increase through the middle of the 21st century as large entry cohorts in which the sex ratios are higher enter the 65 years of age and older population.1,32
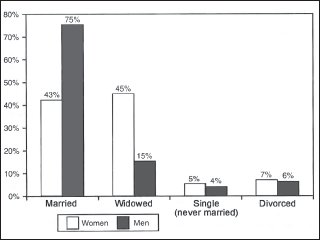
Figure 1-7. The marital status of persons 65 years and older in 1998. (Adapted from US Census Bureau. Marital Status and Living Arrangements: March 1998 [Update]. Washington, DC; Government Printing Office; 1998.)
Stay updated, free articles. Join our Telegram channel

Full access? Get Clinical Tree


