Conformal Radiation Therapy Physics, Treatment Planning, and Clinical Aspects
Modern anatomic imaging technologies, such as x-ray computed tomography (CT) and magnetic resonance imaging (MRI), provide a fully three-dimensional model of the cancer patient’s anatomy, which is often complemented with functional imaging, such as positron emission tomography (PET) or magnetic resonance spectroscopy. Such advanced imaging allows the radiation oncologist to more accurately identify tumor volumes and their relationship with other critical normal organs. Powerful x-ray CT-simulation and three-dimensional treatment-planning systems (3DTPS) have been commercially available since the early 1990s, and three-dimensional conformal radiation therapy (3DCRT) is now firmly in place as the standard of practice.1–3 In addition, advances in radiation treatment-delivery technology continue, and medical linear accelerators now come equipped with sophisticated computer-controlled multileaf collimator systems (MLCs) and integrated volumetric imaging systems that provide beam aperture and/or beam-intensity modulation capabilities that allow precise shaping and positioning of the patient’s dose distributions.3,4
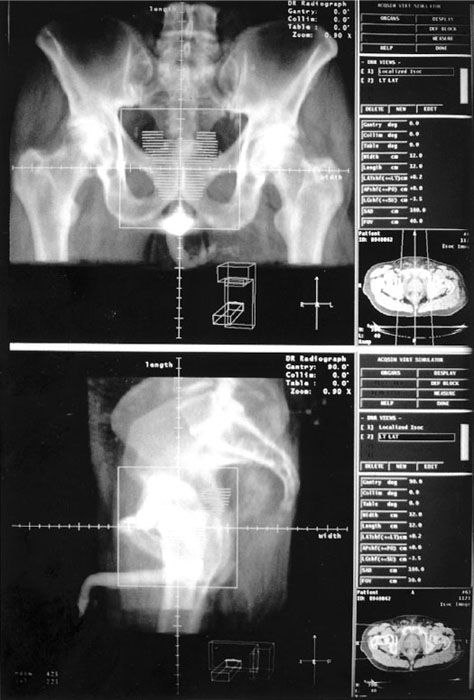
FIGURE 9.1. Three-dimensional conformal radiation therapy (3DCRT), considered a “forward planning” CRT approach that uses an increased number of radiation beams that are shaped to conform to the target volume. To improve the conformality of the dose distribution, beam modifiers (e.g., wedges, partial transmission blocks, and/or compensating filters) are sometimes used. Shown is a prostate seven-field coplanar beam arrangement.
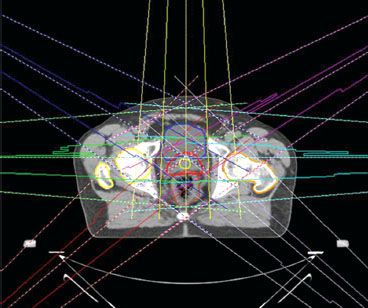
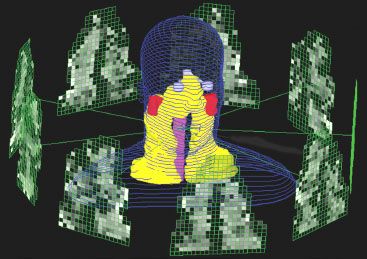
FIGURE 9.2. Intensity-modulated radiation therapy (IMRT) is considered an “inverse planning” conformal radiation therapy approach that can achieve even greater conformity than three-dimensional conformal radiation therapy by optimally modulating the individual beamlets that make up the radiation beams. IMRT dose distributions can be created to conform much more closely to the target volume, particularly for those volumes having complex/concave shapes, and also shaped to avoid critical normal tissues in the irradiated volume.
Conformal treatment plans generally use an increased number of radiation beams that are shaped to conform to the target volume. To improve the conformality of the dose distribution, conventional beam modifiers (e.g., wedges, partial transmission blocks, and/or compensating filters) are sometimes used. This “forward planning” approach used for 3DCRT (Fig. 9.1) is rapidly giving way to an “inverse planning” approach referred to as intensity-modulated radiation therapy (IMRT) (Fig. 9.2), which can achieve even greater conformity by optimally modulating the individual beamlets that make up the radiation beams.5,6 IMRT dose distributions can be created to conform much more closely to the target volume, particularly for those volumes having complex/concave shapes, and also shaped to avoid critical normal tissues in the irradiated volume. This increased conformality results in IMRT treatments being much more sensitive to geometric uncertainties than the two-dimensional or forward-planned 3DCRT approaches and has spurred the development of treatment machines integrated with advanced volumetric imaging capabilities,2,3,7,8 which is again pushing the frontiers in conformal radiation therapy (CRT) practice from IMRT to what is now referred to as image-guided IMRT, or simply image-guided radiation therapy (IGRT).2–4 Of course, the concept of image guidance is not revolutionary and really should be viewed as an evolutionary component in the development of CRT. In the past, many systems and/or processes have been developed to help better localize the patient for treatment (and hence conform the dose), including dedicated x-ray simulators, megavoltage radiographic port films, electronic portal imaging devices, implanted radiopaque markers, ultrasound imaging systems, and optical surface-tracking systems.9,10 Even the early isocentric cobalt-60 teletherapy machines in the 1960s came equipped with a kilovolt x-ray tube attached to the beam stop.
This chapter will review the critical components that make up the CRT planning and delivery process, focusing mainly on the forward-planned 3DCRT process. However, it should be understood that most of concepts and tasks discussed apply equally well to IMRT and IGRT, particularly with regard to target volume definition, plan evaluation, and many aspects of clinical quality assurance (QA). In addition, the reader should understand that the use of the terms two-dimensional (2D), three-dimensional (3D), and even four-dimensional (4D)11 as descriptors for the CRT planning and delivery process refers to a process and tools used and not merely to beam arrangements. For example, 3D treatment planning certainly does not require the use of “noncoplanar” beams—a common misconception—but does require the ability to plan and visualize volumetric dose distributions for such beam arrangements. Even today, newer tools are being developed that allow 4D, image-based CRT planning, that is, target volume segmentation and dose calculation in the presence of moving organs and target volumes. Thus, the reader will be able to appreciate the CRT approach much more fully if it is viewed as a constantly evolving planning and treatment delivery workflow process using ever-advancing computer software and technology.
 HISTORICAL DEVELOPMENT OF CONFORMAL RADIATION THERAPY AND 3D TREATMENT-PLANNING SYSTEMS
Conformational treatment methods were pioneered in the 1950s and 1960s by several groups, including Takahashi in Japan,12 Proimos13 and Trump, Wright, et al. in the United States,14 and Green et al. in Great Britain.15 Work continued into the 1970s, when several groups actually implemented computer-controlled radiation therapy, including a project of the Joint Center for Radiation Therapy in Boston led by Bjarngard and Kijewski16 and the Tracking Cobalt Project led by Davy et al.17 at the Royal Free Hospital in London.
Sterling et al.18,19 are credited with the first 3D approach to treatment planning (dose calculation and display). They demonstrated a technique by which a computer-generated film loop gave the illusion of a 3D view of the patient’s relevant anatomic features and the calculated isodose distribution (2D color washes) throughout a treatment volume. However, this effort did not result in a practical 3DTPS and was viewed as simply a demonstration project. The Rhode Island Hospital/Brown University group made the first real step in implementing a clinically usable 3DTPS based on a new type of display, called beam’s-eye view (BEV), which simulated the treatment planner’s viewing point from the perspective of the radiation source looking out along the axis of the radiation beam, similar to that obtained when viewing a simulation radiograph.20,21
The advent of CT spurred further development of 3D planning systems. In 1983, Goitein and coworkers reported on their system,22,23 which took advantage of CT and increased minicomputer capabilities. The system produced high-quality color BEV displays and could display radiographic images computed from the digital CT data; such computed radiographs are now called digitally reconstructed radiographs (DRRs). By the latter half of the 1980s, several other academic groups had developed 3D planning systems having powerful new features.24–27
In the 1990s, the commercial availability of 3DTPSs led to widespread adoption of 3D planning and CRT as the standard of practice. One of the keys to this development was a series of research contracts funded by the National Cancer Institute (NCI) in the 1980s and 1990s to evaluate the potential of 3D planning and to make recommendations to the NCI for future research in this area.28 Each of the research contracts funded a collaborative working group (CWG). The participating institutions in each CWG are shown in Table 9.1. Their charge was to evaluate various aspects of this new planning process and develop new software tools needed. The CWGs were composed of physicists, clinicians, and computer scientists. Many important developments and/or refinements in 3D planning came from these NCI research CWGs, particularly planning-evaluation software tools such as dose–volume histograms (DVHs),29,30 electronic view-box,31 and biologic effect models such as tumor control probability (TCP) and normal tissue complication probability (NTCP) models.32 Even IMRT has benefited from the CWG approach, as a consensus statement was developed in 2001 that helped clarify many issues and pointed to important research areas regarding that form of CRT.33
TABLE 9.1 NATIONAL CANCER INSTITUTE RESEARCH CONTRACTS IN SUPPORT OF THREE-DIMENSIONAL RADIATION THERAPY TREATMENT PLANNING

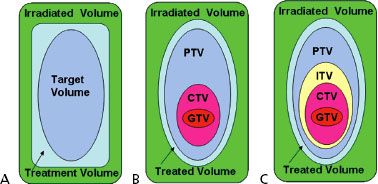
FIGURE 9.3. A: Schematic illustration of the boundaries of the volumes defined by International Commission on Radiation Units and Measures (ICRU) Report 29: target volume, treatment volume, and irradiated volume. B: Boundaries of the volumes defined by ICRU Report 50: gross tumor volume (GTV), clinical target volume (CTV), planning target volume (PTV), treated volume, and irradiated volume. C: Boundaries of the volumes defined by ICRU Report 62: GTV, CTV, internal target volume (ITV), PTV, treated volume, and irradiated volume.
 VOLUME SPECIFICATION FOR CONFORMAL RADIATION THERAPY
The International Commission on Radiation Units and Measurements (ICRU) first addressed the issue of consistent volume and dose specification in radiation therapy with the publication of ICRU Report 29 in 1978.34 That report defined the target volume as the volume containing those tissues that are to be irradiated to a specified absorbed dose according to a specified time–dose pattern (Fig. 9.3A). It is interesting to note that this report (even though published in the 2D era) attempted to address spatial uncertainties by pointing out that the size and shape of a target volume may change during the course of a treatment and that one should take into account the following parameters when describing the target volume:
1. Expected movements (e.g., caused by breathing) of those tissues that contain the target volume relative to anatomic reference points (e.g., skin markings, suprasternal notch).
2. Expected variation in shape and size of the target volume during a course of treatment (e.g., urinary bladder, stomach).
3. Inaccuracies or variations in treatment setup during the course of treatment.
However, the report did not address the issues of coordinate systems (e.g., patient vs. treatment machine), and no attempt was made to define and explicitly separate the margins for the different types of uncertainties.
In addition to the target volume, ICRU Report 29 defined two other volumes: (a) the treatment volume and (b) the irradiated volume. These volumes were not based on anatomy, but instead were based on the dose distribution. The treatment volume was defined as the volume enclosed by the isodose surface representing the minimal target dose, and the irradiated volume was defined as the volume that receives a dose considered significant in relation to normal tissue tolerance (e.g., 50% isodose surface).
Report 29 defined organs at risk (OAR) as especially radiosensitive organs in or near the target volume whose presence influences treatment planning and/or prescribed dose. The report also recognized the importance of tissues outside the target area that received a dose higher than 100% of the specified target dose. This was defined as a hot spot and was considered clinically meaningful only if the corresponding isodose curve enclosed an area of at least 2 cm2 in a section.
In retrospect, ICRU Report 29 recommendations were well suited for the technology of the 1970s and 1980s, that is, using a conventional simulator to generate a planning radiograph for designing beam portals based on bony and soft tissue landmarks for standardized beam arrangement techniques applied to whole classes of comparable patients. Several generations of radiation oncologists were trained using this nomenclature and method, and the ICRU recommendation for reporting dose and volumes helped advance radiation oncology.
In 1993, the ICRU updated its recommendations for specifying dose/volume in Report 50, which were well suited for conformal therapy.35 The target volume definition was separated into three distinct volumes: (a) visible tumor, that is, gross tumor volume (GTV), (b) a volume to account for uncertainties in microscopic tumor spread, that is, clinical target volume (CTV), and (c) a volume to account for geometric and other uncertainties, that is, planning target volume (PTV), as illustrated in Figure 9.3B.
The GTV and CTV are anatomic-clinical concepts that should be defined before a choice of treatment modality and technique is made. Labels or subscripts with the GTV nomenclature can be used to distinguish between primary disease and other areas of macroscopic tumor involvement such as involved lymph nodes that are visible on imaging studies (e.g., GTVprimary and GTVnodal, or GTV-T and GTV-N). Similarly, the GTV together with this surrounding volume of local subclinical involvement that defines the CTV can be denoted as CTV-T. Note that even if the GTV has been removed by radical surgery, the volume can be designated as CTV-T. In specifying the CTV, the physician must consider not only microextensions of the disease near the GTV, but also the natural avenues of spread for the particular disease and site, including lymph node, perivascular, and perineural extensions. These may be designated CTV-N (and, if necessary, CTV-N1, CTV-N2, etc.).
The PTV is defined by specifying the margins that must be added around the CTV to manage the effects of organ, tumor and patient movements, inaccuracies in beam and patient setup, and any other uncertainties. The PTV is a static, geometric concept used for treatment planning and for specification of dose. Its size and shape depend primarily on that of the GTV/CTV and the effects caused by internal motions of organs and the tumor, technical aspects of treatment technique (e.g., patient fixation). The PTV can be considered a 3D envelope in which the tumor and any microscopic extensions reside and move. Once the PTV is defined, appropriate beam sizes to account for penumbra and beam arrangements must be selected to ensure the desired dose coverage of the PTV. Note that multiple PTVs may be defined for a patient’s radiation therapy treatment. For example, it is common practice to plan a higher dose to the PTV enclosing the GTV and a lower dose to the PTV containing the CTV. Such planning volumes are typically subscripted using the dose level prescribed; for example, PTVs for 66 Gy and 54 Gy can be represented as PTV66 and PTV54, respectively.
ICRU Report 50 essentially retained the definition of the two dose volumes defined in ICRU Report 29, changing the treatment volume name to treated volume and refining the definition as the volume enclosed by an isodose surface, selected and specified by the radiation oncologist as being appropriate to achieve the purpose of treatment (e.g., tumor eradication, palliation), and the irradiated volume as that tissue volume that receives a dose that is considered significant in relation to normal tissue tolerance.
Report 50 refined the definition of organs at risk as normal tissues whose radiation sensitivity may significantly influence treatment planning and/or prescribed dose. The report did state that any possible movement of the organ at risk during treatment, as well as uncertainties in the setup during the whole treatment course, must be considered, but did not provide a method to do so.
The hot spot definition was modified to be a volume outside the PTV that received a dose larger than 100% of the specified PTV dose. This was considered clinically meaningful only if the minimum diameter exceeded 15 mm (note: previously it had been 2 cm2). However, if the hot spot occurs in a small organ, such as the optic nerve, a dimension smaller than the recommended 15 mm should be considered.
As previously stated, Report 50 was well suited to conformal therapy, and it stimulated broad interest in the radiation oncology community. However, irradiation techniques continued to evolve (e.g., IMRT), and advances in imaging procedures (e.g., PET, MRI) provided even more information on functionality, the location, shape, and limits of tumor/target volumes, and organs at risk. In response to these developments, the ICRU in 1999 published Report 62,36 which expanded on some of the definitions and concepts of Report 50 and took into account the consequences of the technical and clinical progress referred to previously. However, it should be clearly understood that Report 62 was intended to complement the recommendations contained in Report 50 and not to replace it.
ICRU Report 62 refined the definition of PTV by introducing the concept of an internal margin to take into account variations in size, shape, and position of the CTV in reference to the patient’s coordinate system using anatomic reference points, as well as the concept of a setup margin to take into account all uncertainties in patient–beam positioning in reference to the treatment machine coordinate system. Identification of these two types of margins is needed, as they compensate for different types of uncertainties and refer to different coordinate systems. Internal margin uncertainties are due to physiologic variations (e.g., filling of rectum, movements due to respiration) and are difficult or almost impossible to control from a practical viewpoint. Setup margin uncertainties are related largely to technical factors that can be dealt with by more accurate setup and immobilization of the patient and improved mechanical stability of the machine. However, exactly how these margins should be combined is still not clear. This point will be discussed further in a later section, but for now it is necessary to understand that the selection of an overall margin and delineation of the border of the PTV typically involves a compromise that requires the experience and the judgment of the radiation oncologist and the treatment-planning team.
ICRU Report 62 defines the volume formed by the CTV and the internal margin as the internal target volume (ITV) (Fig. 9.3C). The ITV represents the movements of the CTV referenced to the patient coordinate system and is specified in relation to internal and external reference points, which preferably should be rigidly related to each other through bony structures. In cases not involving significant internal organ motion, the radiation oncologist can simply ignore having to explicitly define the ITV and use only the GTV, CTV, and PTV concepts. However, in cases involving significant motion, such as often is the case with lung cancer, the ITV concept has proven useful and should be used.37
TABLE 9.2 SUMMARY OF THE INTERNATIONAL COMMISSION ON RADIATION UNITS AND MEASUREMENTS (ICRU) NOMENCLATURE FOR VOLUMES (1970S TO PRESENT)
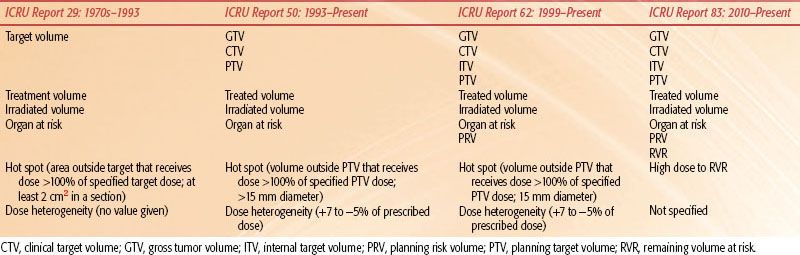
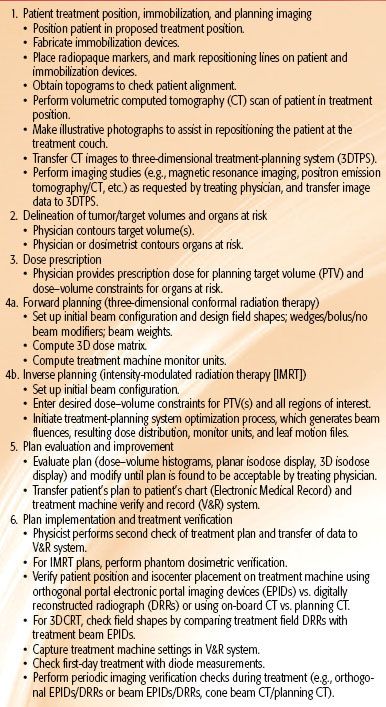
TABLE 9.3 CONFORMAL RADIATION THERAPY PROCESS
ICRU Report 62 refined the definition of the two dose volumes defined ICRU Report 50 as follows:
The treated volume is the tissue volume that (according to the approved treatment plan) is planned to receive at least a dose selected and specified by radiation oncology team as being appropriate to achieve the purpose of the treatment, e.g., tumor eradication or palliation, within the bounds of acceptable complications.
The irradiated volume is the tissue volume that receives a dose that is considered significant in relation to normal tissue tolerance.
Report 62 refined the definition of organs at risk as normal tissues (e.g., spinal cord) whose radiation sensitivity may significantly influence treatment planning and/or prescribed dose. The report also included a discussion regarding a system of classifying organs at risk as “serial,” “parallel,” or “serial-parallel.” Report 62 also addressed what was perhaps the most criticized limitation of Report 50, which was that it did not provide a method to account for organ-at-risk movements and changes in shape and/or size, as well as setup uncertainties. To account for such spatial uncertainties, Report 62 introduced the concept of the planning organ at risk volume (PRV), in which a margin is added around the organ at risk to compensate for that organ’s geometric uncertainties. The PRV margin around the organ at risk is analogous to the PTV margin around the CTV. The introduction of the PRV concept is timely, as its use is even more important for those conformal therapy cases involving IMRT because of the increased sensitivity of this type treatment to geometric uncertainties. For example, it is common practice to add a 0.5-cm rind around the spinal cord contour. Note that the PTV and the PRV may overlap, and often do so, which implies searching for a compromise in weighting the importance of each in the planning process. A summary of the ICRU volume nomenclature recommendations per report is presented in Table 9.2.
 CONFORMAL RADIATION THERAPY PLANNING PROCESS
As previously stated, CRT treatment planning and delivery should be looked at as a process and the tools used. This process is summarized in Table 9.3 and includes (a) establishing the patient’s treatment position, constructing a patient repositioning immobilization device when needed, and obtaining a volumetric image data set of the patient in treatment position; (b) contouring target volume(s) and organs at risk using the volumetric planning image data set; (c) specifying a prescription dose for the PTV and dose–volume constraints for any OARs; (d1) for 3DCRT forward planning, determining beam orientation and designing beam apertures and computing a 3D dose distribution according to the dose prescription; (d2) for IMRT inverse planning, setting up initial beam orientations and entering optimization parameters (i.e., dose–volume constraints for PTV[s] and all regions of interest) and initiating the TPS optimization process, which generates beam fluences, resulting dose distribution, monitor units, and leaf motion files; (e) evaluating the treatment plan and, if needed, modifying the plan (e.g., beam orientations, apertures, beam weights, etc.) until an acceptable plan is approved by the radiation oncologist; and (f) implementing the approved plan on the treatment machine and verifying the patient’s treatment using appropriate QA procedures throughout the treatment. All of these tasks make up the CRT process and are discussed in the ensuing sections.
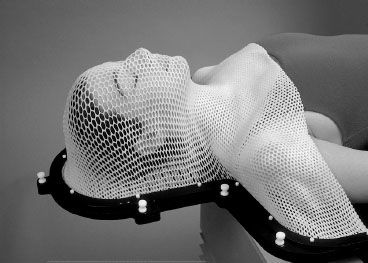
FIGURE 9.4. Example of immobilization repositioning system used for patients undergoing radiation therapy for head and neck cancer. It should be clearly understood that being able to accurately reposition the patient and account for internal organ movement in order to accurately deliver the planned dose distribution is one of the most important steps in the conformal therapy process. (Courtesy of MEDTECH, Inc., Orange City, IA.)
Patient Treatment Position and Immobilization, and Planning of Imaging
In the initial part of the CRT process (preplanning), the proposed treatment position of the patient is determined, and the immobilization device to be used during simulation/treatment is selected. In should be clearly understood that repositioning patients and accounting for internal organ movement for fractionated radiation therapy in order to accurately reproduce the planned dose distribution remain difficult technical aspects of the CRT process. Errors may occur if patients are inadequately immobilized, with resultant treatment fields inaccurately aligned from treatment to treatment (interfraction). In addition, patients and/or their tumor volume may also move during treatment (intrafraction) because of either inadequate immobilization or physiologic activity. Accounting for all of the uncertainties in the CRT planning and delivery process remains a challenge for radiation oncology, and research and development is ongoing.
Determining the treatment position of the patient and constructing the immobilization device are done in a dedicated radiation therapy CT-simulator facility. A radiation therapy CT-simulator consists of a diagnostic-quality CT scanner, laser patient positioning/marking system, virtual simulation 3D treatment-planning software, as well as various digital display systems for viewing the DRRs.38,39 The CT scanner is used to acquire a volumetric planning CT scan of a patient in treatment position. The use of intravenous or other contrast to help delineate target volumes needs to be considered during simulation in some cases. CT topograms should be generated first and reviewed prior to acquiring the planning scan to ensure that patient alignment is correct, with adjustments to be made if needed. Radiopaque markers can be placed on the patient’s skin and the immobilization device to serve as fiducial marks to assist in any coordinate transformation needed as a result of 3D planning and eventual plan implementation. An example of a typical immobilization repositioning system used for patients undergoing radiation therapy for head and neck (H&N) cancer is shown in Figure 9.4.
Planning CT scan protocols are tumor site dependent and typically range from 2 to 5 mm in slice thickness and 50 to 200 slices. In general, a 3-mm slice thickness provides adequate-quality DRR. In some sites, such as those of H&N cancer, slice thicknesses of 1 mm are often needed for delineation of very small volumes, such as the optic chiasm and the optic nerves. The same holds true for optimal reconstruction of the position of any implanted markers used, such as in prostate cancer radiation therapy.
The planning CT data set is typically transferred to a 3DTPS via a computer network. The planning CT data set provides an accurate geometric model of the patient, as well as the electron density information needed for the calculation of the 3D dose distribution that takes into account tissue heterogeneities.
Delineation of Tumor/Target Volumes and Organs at Risk
Delineation of tumor/target volume and organs at risk contours using the volumetric CT data set is typically performed by the radiation oncologist and the medical dosimetrist working as a team. The CT data are displayed at the 3DTPS workstation (Fig. 9.5), and contours are drawn manually by the radiation oncologist/dosimetrist, most often using a computer mouse or stylus on a slice-by-slice basis. Some OARs with distinct boundaries (e.g., skin, lung) can be contoured automatically, with only minor editing required; others (e.g., brachial plexus) require the hands-on effort of the radiation oncologist.40 With modern 3DTPS image segmentation software, contouring generally takes 0.5 to 1 hour, depending on the disease site. However, for some complex sites, such as H&N cancer, where many OARs and complex tumor/target volumes are the norm, this task can take several hours.
CT is still the principal source of imaging data used for defining the GTV for most sites, but this imaging modality presents several potential pitfalls. First, when contouring the GTV, it is essential that the appropriate CT window and level settings be used in order to determine the maximum dimension of what is considered potential gross disease (Fig. 9.6). Second, for those treatment sites in which there is considerable organ motion, such as for tumors in the thorax, CT images do not correctly represent either the time-averaged position of the tumor or its shape, and hence newer 4D CT technology must be used.41–43 This can be understood by appreciating the fact that single or few-slice CT simulators rely almost exclusively on the use of fast spiral CT technology and thus acquire data essentially in 2D and combine them to construct a 3D matrix. This has the effect of capturing the tumor cross-section images at particular positions in the breathing cycle. If the tumor motion is significant, different, and possibly noncontiguous, transverse sections of the tumor could be imaged at different points of the breathing cycle, leading to volume uncertainties. The interpolation process in spiral CT technology adds further to the uncertainty. As a result, the 3D reconstruction of the GTV from temporally variant 2D images often results in a poor representation of the tumor and its motion. Currently, 4D CT technology has become the standard for CT simulators, making it possible to capture images in each phase of the respiratory cycle.44,45 In addition, other technologies and methodologies to explicitly help manage the movements induced by the respiratory motion (to the order of <5 mm during treatment preparation and delivery) continue to be developed, including respiratory-gated techniques, respiration-synchronized techniques, breath-hold techniques, and forced shallow-breathing methods.46
Delineating the CTV is even more difficult and must be done by the radiation oncologist based on clinical experience (and/or the use of published CTV atlases for certain clinical sites) because current imaging techniques cannot be used to directly detect subclinical tumor involvement. This field has seen a virtual explosion in the use of multimodality imaging over the last decade, and radiation oncologists have developed considerable imaging expertise in order to accurately define GTVs and be able to define nonimaged CTVs. However, the need for a higher level of image-based cross-sectional anatomy training in this field is well recognized.47
FIGURE 9.5. Advanced image-segmentation software provides tools for radiation oncologists and treatment planners to determine critical structures and tumor and target volumes for three-dimensional planning. Computed tomography (CT) data are displayed, and contours are drawn by the treatment planner/radiation oncologist around the tumor, target, and normal tissues on a slice-by-slice basis, as seen in upper right panel. At the same time, planar images from both anteroposterior and lateral projections are displayed in bottom right and left panels. Upper left panel shows positron emission tomography scan data with overlying contours after image registration with the CT data.
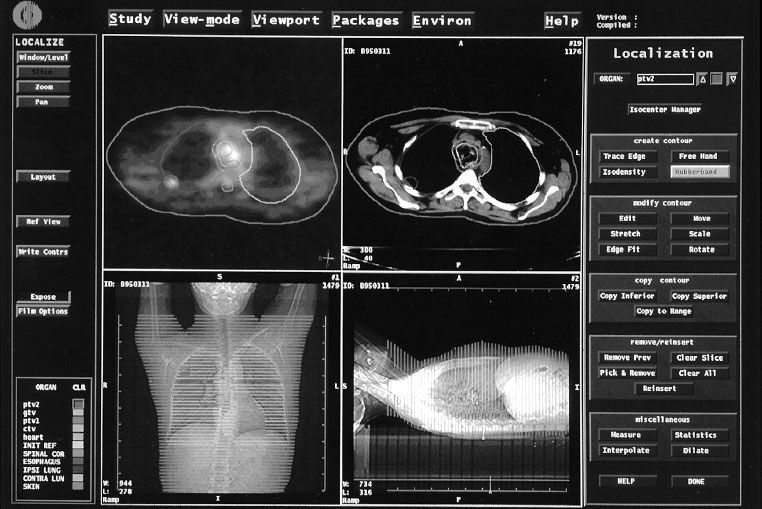
FIGURE 9.6. Computed tomography (CT) slice for patient with lung cancer showing that the appropriate CT window and level settings (right frame) must be used to determine the maximum dimensions of the gross tumor volume (GTV). Note that a much smaller GTV would have been contoured with the settings used in the left frame. (From Purdy JA. Advances in three-dimensional treatment planning and conformal dose delivery. Semin Oncol 1997;24:655–672.)
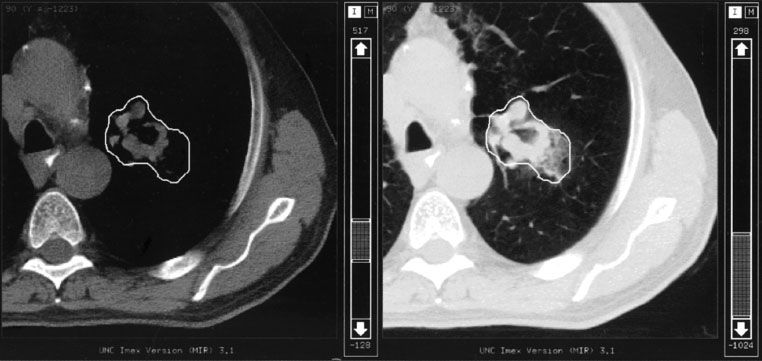
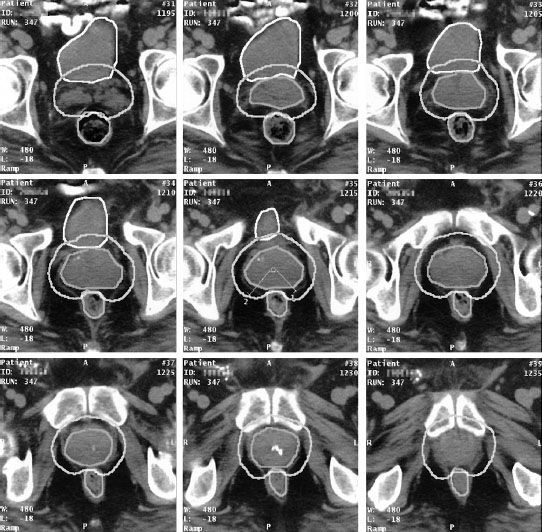
FIGURE 9.7. Computed tomography images of patient with prostate cancer showing the contour outlines for the gross tumor volume (GTV), planning target volume (PTV), bladder, and rectum. The physician made the decision that no additional margin around the prostate for the clinical target volume (CTV) was required (i.e., CTV = GTV). Note that a nonuniform margin around the GTV/CTV was used to define the PTV in the region of the rectum (see middle frame). Also note the additional PTV contours needed to cap the GTV/CTV (upper left and lower right frames). (From Purdy JA. Three-dimensional treatment planning and conformal dose delivery: a physicist’s perspective. In: Mittal BB, Purdy JA, Ang KK, eds. Advances in radiation therapy. Boston: Kluwer Academic Publishers, 1998:1–33.)
The PTV margin is specified by the radiation oncologist, often in consultation with the radiation oncology physicist and/or therapist. In most occasions, it is based on published clinical experience, that is, not calculated based on measurements performed by the department for a particular treatment machine/technique and team. Van Herk and colleagues reported extensively on the influence of systematic and random errors/variations on the required margins to account for setup error and organ motion and developed margin recipes for calculating individualized (for a department, machine, and team) margins as given by the following equation48,49:

where σ is the standard deviation of the systematic errors and σ is the standard deviation of the random errors.
When defining the PTV, the radiation oncologist should account for the asymmetric nature of positional uncertainties (Fig. 9.7). For example, it is recognized that prostate organ motion and daily setup errors may be anisotropic (side-to-side or rotational shifts of the position of the patients are likely to have a different result compared to movement in the anteroposterior direction). Thus, the PTV margin around a CTV generally should not be uniform.
Typically, when the beam portal is defined, additional margin beyond the PTV is typically required to obtain dose coverage because of beam penumbra and treatment technique. This emphasizes that treatment portal margins in relation to the PTV must be set according to the dosimetric characteristics of the beams being used. Typically, a 5-mm margin (portal edge to PTV) is a good starting point, which can be increased if needed, but one must be knowledgeable about the characteristics of the actual beams used to make this starting-point determination. An additional point to understand is that in the case of coplanar treatment techniques, the margins required across the plane of treatment and the margins orthogonal (say superior–inferior) to this plane will be different. To clarify this point, consider a pelvic four-field axial technique as an example. Portions of the lateral aspects of the PTV that are in the low-dose regions (near the penumbra) of the anterior–posterior and posterior–anterior fields will be in the high-dose regions (well away from the beam penumbra) of the lateral fields. However, the superior and inferior aspects of the PTV will always be in the same low-dose regions of all four fields, so there will be no dose filling from any of the fields. Thus, a larger portal margin in the inferior–superior dimension is needed to ensure that the prescription isodose resulting from all beams contains the PTV, while the lateral and anterior–posterior portal margins for each field may be reduced due to the other beams filling in the dose. The same holds true for the portals of the boost fields used in the so-called “integrated boost technique,” in which the beams used for treating the large volume fill up the dose in the buildup region of the boost volume. Last, the size of the margins will also be affected by the relative beam weighting. Hence, making hard rules about margin sizes is impossible and requires some planning iteration to find the right mix of beam margins.
When a PTV overlaps with a contoured normal structure, it is important to be explicit as to which volume the overlapping voxels are assigned for optimization purposes and for DVH calculations. Planning systems should allow the overlapping voxels to be included in both volumes for plan evaluation and reporting purposes. This ensures that the clinician is aware of the potential for the high-dose region to include part of the normal structure as well as the PTV when reviewing the DVHs.
In addition, most 3DTPS cannot accurately account for a PTV contour that extends outside the skin surface, resulting in a DVH that does not reflect clinical reality due to the lack of dose generated in air and in the buildup region just below the skin. In those cases, the best solution is to delineate the PTV 5 mm below the skin surface. This will also help reduce acute skin reactions by preventing the optimization process from increasing the skin dose to excessive levels. In all cases, however, the treating physician should be aware of this approximation when setting or approving actual field margins.
All of the issues discussed in this section point out the fact that the PTV/PRV concept is a useful tool that simplifies accounting for geometric uncertainties. However, its use does give rise to several dilemmas. Particularly important is the loss of actual tumor and normal organ volume information reported for researchers developing TCP and NTCP models. Although it does not appear possible to totally eliminate the PTV concept at this time, it does appear possible to use smaller margins for some sites if more frequent imaging or other technical innovation is used to reduce geometric uncertainties. For example, for prostate cancer, the use of daily imaging and other technologies to relocate the target volume in reference to the machine isocenter does allow for a smaller margin for the PTV.10,50 However, one must still be prudent in the amount of margin reduction for the prostate PTV when using these technologies. The different methods include various tradeoffs ranging from treatment machine control, which is not dependent on the patient, to systems that are completely dependent on the patient. Again, regardless of which technique is used to reduce the overall PTV margin, one must be prudent in the amount of margin reduction.
Dose Prescription
Dose prescription is the responsibility of the radiation oncologist, generally using institutional protocols based on evidence published in the literature combined with institutional experience. Typically, the CRT prescription is specified as a dose at or near the center of the PTV or (particularly for IMRT) as a dose covering a certain percentage of the PTV—for example, D95%, a dose that covers 95% of the PTV. Because the resulting dose distribution can be quite different depending on the dose prescription methodology, it is imperative that publications provide a clear and unambiguous description of the dose specification for the radiation treatment results being reported. The ICRU recently updated their recommendations for dose specification, and these will be discussed in a later section.51
Conformal Planning
For 3D CRT planning, beams can be arranged and beam apertures shaped with MLC leaves or shielding blocks to help conform the prescribed dose to the PTV and avoid OARs using BEV displays. This “forward planning” approach to CRT has now been supplemented—but not replaced—by an “inverse planning” approach as used for IMRT, which can achieve even greater conformity and OAR dose avoidance.
Forward Planning: 3DCRT
Design of the beam arrangement is the next step in the planning process for 3DCRT. The ability to orient beams in 3D allows one to develop treatment plans that use noncoplanar beams. However, when noncoplanar beam arrangements are used, care must be taken to avoid the selection of gantry and couch angles that results in table/gantry collisions or a conflict with other treatment room restrictions. The BEV and the DRR display,23,52 as shown in Figure 9.8, allows the planner to easily view the target volume and the organs at risk so that shielding blocks or MLC apertures can be drawn using a computer mouse or, as available with most current 3DTPS software versions, automatically generated with a chosen margin around the selected volume. DRRs also provide planar reference images that can be used in facilitating the plan implementation and treatment verification phases of CRT.
Inverse Planning: IMRT
The major differences between 3DCRT forward planning and IMRT inverse planning is the use of a computer optimization program that requires a formal description of the requirements using a mathematical objective function and constraints that are used by the program to find the solution. For example, after the design of the initial beam geometry, the physician/treatment planner puts into the TPS the desired dose–volume constraints for the PTVs and all OARs. The TPS optimization algorithm then divides each beam into many small beamlets (i.e., pencil beams that together make up the IMRT beam) and then iteratively alters the beamlet intensities until the 3D dose distribution best conforms to the a priori–specified dose–volume objectives. After the optimal beam intensities and resulting dose distribution have been determined, the TPS then calculates the MLC leaf sequence motions that will achieve this dose distribution and the dose recalculated. Typically there may be some differences in the optimized dose distribution and the final dose distribution that can be delivered with the computer-controlled MLC system, but this difference is usually acceptable.
Dose Distribution Calculation
A rectilinear coordinate system affixed to the patient 3D CT image set is typically used for calculating the dose distribution. This “patient or CT system” coordinate system typically has its x-axis along the horizontal axis of the transverse CT images, the y-axis along the vertical axis, and the z-axis along the couch motion. Contour points are specified as a sequence of points having x, y, z coordinates in this system. The center of each voxel in the 3D CT image matrix is computed relative to the same coordinate system and is used to look up the relative electron density values that are related to the CT numbers (see later discussion). The selection of grid spacing for the 3D dose matrix is an important consideration regarding dose computational accuracy, calculation speed, and computer hardware requirements. Drzymala et al.30 pointed out that a 2% dose accuracy or 2-mm isodose positional accuracy can generally be achieved with a grid spacing of 5 mm. However, in regions of high-dose gradients, a finer grid is typically needed, which creates larger computer files and increases the 3DTPS memory and mass storage requirements.
The reader should also understand that CT numbers are not used directly in photon dose calculations. Instead, the CT numbers are correlated with the electron density of the corresponding tissues at each voxel relative to the electron density of water.53 This is because Compton scattering is the dominant mode of interaction for the type of photon beam used in radiation therapy (cobalt-60 through 25-MV x-rays), and the absorption and scattering of photons in tissue depends primarily on the electron density of the tissue. Errors in CT numbers can result in inaccurate dose calculations. Generally, however, errors of 10% or less in electron density (CT numbers) will not result in significant errors in the dose distribution.53
Details on specific dose calculation algorithms are discussed in a separate chapter, and so only issues pertinent to the CRT planning process are discussed in this section. In the past, dose calculation algorithms were traditionally based on parametrizing dose distributions measured in water phantoms under standard conditions and applying correction factors to the beam representations for the nonuniform surface contour of the patient or the obliquity of the beam, tissue heterogeneities, and beam modifiers such as blocks, wedges, and compensator. However, more-advanced models, such as the superposition/convolution method, have been developed for CRT planning.53 It is my opinion that heterogeneity-corrected 3D treatment plans generated using such advanced algorithms should be standard of practice today for CRT planning. The study by Frank et al.54 provides a clear method for safely transitioning from a clinical experience based on planning assuming a homogeneous unit density patient to a heterogeneous patient model.
FIGURE 9.8. Beam’s-eye-view (BEV) and digitally reconstructed radiograph (DRR) display of three-dimensional radiation therapy treatment planning for a prostate cancer patient. BEV display is useful in identifying best gantry, collimator, and couch angles at which to irradiate the target and avoid irradiating adjacent normal structures by interactively moving patient and treatment beam. Critical structures and target volumes are outlined on the patient’s serial computed tomography sections. Contours are seen in perspective, as though the observer’s eye is at the radiation source looking out along the axis of the radiation beam. The beam shape is defined by multileaf collimator (MLC). (From Purdy JA. Advances in three-dimensional treatment planning and conformal dose delivery. Semin Oncol 1997;24:655–672.)