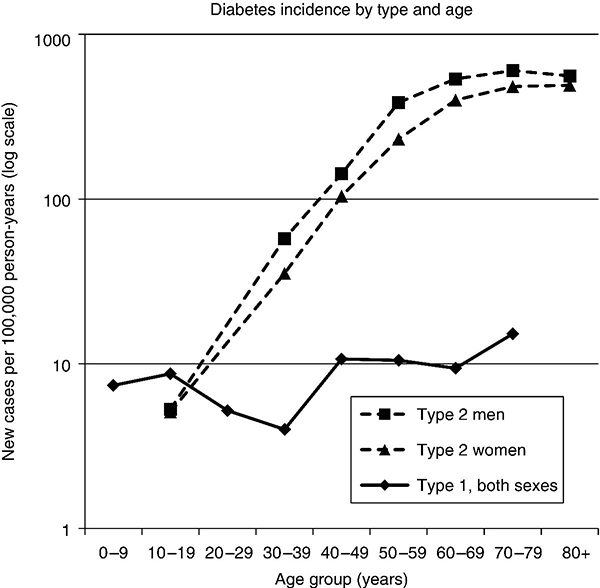
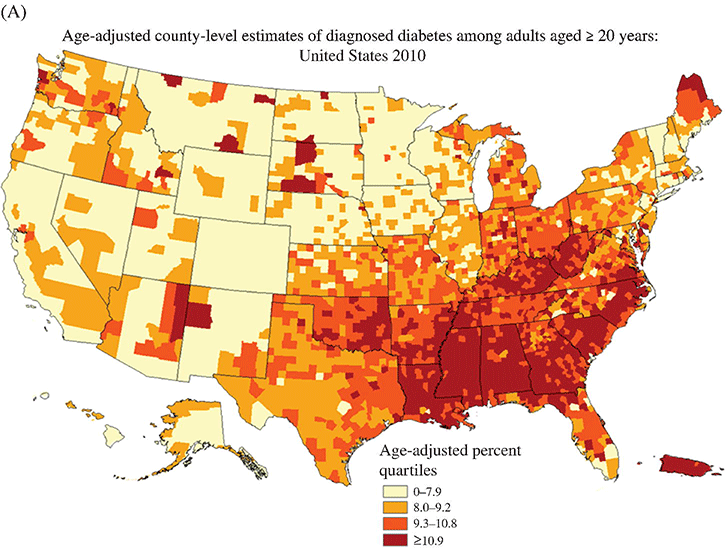
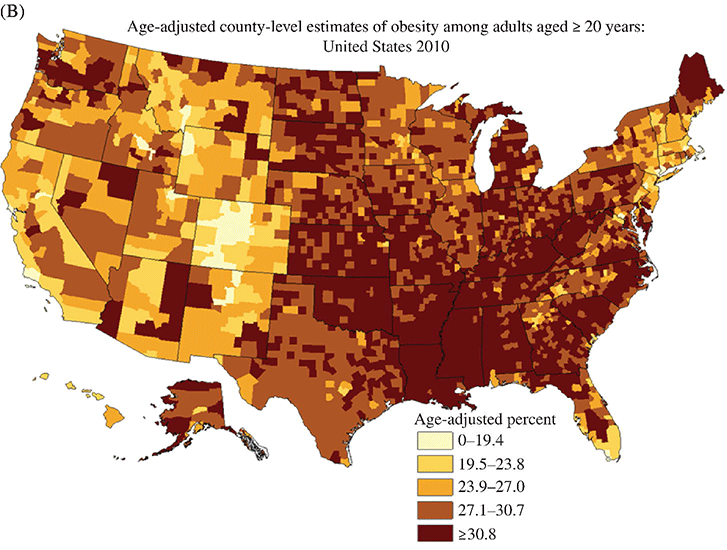
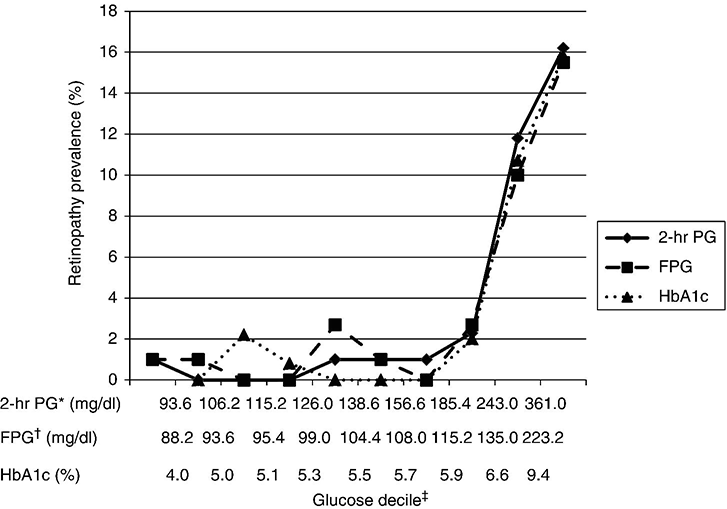
Chapter 2 Jeffrey M. Curtis, MD, MPH and William C. Knowler, MD, DrPH Diabetes mellitus is a heterogeneous group of metabolic disorders grouped together due to their common feature of hyperglycemia. The incidence and prevalence of diabetes have increased markedly in recent decades, mostly due to increases in type 2 diabetes rates, which have paralleled the increasing rates of obesity in the developed world during the same time. The increasing prevalence of diabetes is important because of the associated morbidity and mortality and the associated costs, in terms of both the personal cost of decreased quality of life and the economic impact of providing health care to a growing population with a chronic disease and the accompanying loss of productivity. The fact that diabetes mellitus is more than one disease has important implications. The age and setting of onset, the mechanism responsible for elevated blood glucose, and the expected complications of one type of diabetes mellitus may be different from those in another type. Therefore, the approaches to treatment for different types of diabetes differ. Thus, accurately classifying a particular patient’s diabetes facilitates choice of the most effective glucose-lowering treatment and interventions to prevent complications. The current nomenclature for diabetes mellitus was formalized by the American Diabetes Association in 1997 [1]. At that time the older terms insulin-dependent diabetes mellitus (IDDM) and non-insulin-dependent diabetes mellitus (NIDDM) were eliminated due to the confusion they caused over misclassifying patients on the basis of their treatment rather than on the pathophysiology of their particular disease. Rather, the terms type 1 and type 2 diabetes mellitus were adopted for the most common types of diabetes mellitus. The overwhelming majority of cases of diabetes mellitus can be placed in one of three categories: type 1, type 2, or gestational. A fourth category includes diabetes caused by other factors, including medicines (some medicines used to treat HIV infection and agents used to prevent rejection after organ transplant, for example), genetic defects affecting insulin production or action, and other insults to the pancreas that cause a secondary inability to secrete insulin appropriately. Type 1 diabetes, which constitutes less than 10% of all diabetes mellitus cases, is characterized by marked or absolute deficiency of insulin production by the β cells of the pancreatic islets of Langerhans. Because insulin is required for most cells in the body to take up glucose, which they use to fuel metabolic processes, this insulin deficiency results in glucose remaining extracellular, including in the blood. The hyperglycemia of diabetes mellitus occurs while the cells are starved for fuel due to their inability to internalize the glucose that is just outside their cell membranes. Type 1 diabetes requires treatment with insulin for the patient to survive. The insulin deficiency of type 1 diabetes is usually caused by T-cell—mediated autoimmune destruction of β cells, as discussed in Chapter 1. Due to the technical and ethical limitations of obtaining pancreatic biopsy specimens from humans with type 1 diabetes, much of what is known about the pathophysiology of the disease has been learned from mouse models, most often the nonobese diabetic (NOD) mouse [2]. In NOD mice, activation of autoreactive T lymphocytes is the main pathway to β cell destruction and the resulting insulin deficiency. Type 1 diabetes can occur at any time in a person’s life. In fact, at least one study [3] has shown that the incidence of type 1 diabetes may be stable or possibly even increase with age (Figure 2.1). However, it characteristically is associated with rapid onset in childhood, when it is often first recognized when the afflicted child develops diabetic ketoacidosis, a life-threatening complication associated with dramatically high blood glucose levels. For unknown reasons, when type 1 diabetes occurs later in life, its onset is usually slower, sometimes making it difficult to distinguish from type 2 diabetes. Figure 2.1 Incidence of diabetes by type and age. The definitions of diabetes type used for the data represented here are not those used currently for diagnosing or classifying diabetes; however, they provide an estimate of the incidence of diabetes by type in the Rochester, Minnesota, area from 1945 to 1969. Glucose criteria were the same regardless of type of diabetes diagnosed. Type 1 diabetes (IDDM in the original publication) was defined as requiring insulin therapy, evidence of ketosis-proneness, and relative weight less than 1.2; type 2 (NIDDM in the original publication) was defined as relative weight of 1.2 or more and/or no evidence of ketosis, regardless of type of therapy. Relative weight was calculated from recommended height-weight tables. Due to small numbers, the rates shown for the youngest three age groups (0–9, 10–19, and 20–29 years) were collapsed into a single average value at the middle age range, consistent with the original publication. Data from Melton LJ, Palumbo PJ, Chu CP. Incidence of diabetes mellitus by clinical type. Diabetes Care 1983; 6: 75–86. Type 2 diabetes, which accounts for approximately 90% of diabetes mellitus in the developed world, is characterized by a combination of insulin resistance and β cell failure, both of which are required for the disease to develop. Normally insulin sensitive cells throughout the body, most notably adipose, skeletal muscle, and liver, become less sensitive to insulin, which results in the β cells secreting larger quantities of insulin to overcome the resistance and prevent hyperglycemia. Eventually the β cells are no longer able to overcome the insulin resistance, and hyperglycemia results. Insulin resistance is an early pathophysiologic derangement in the development of type 2 diabetes. Whether β cell failure begins simultaneously or develops after insulin resistance has not been definitively shown; however, some predisposition to β cell failure may predate even the development of insulin resistance [4]. The insulin resistance characteristic of type 2 diabetes tends to occur more frequently in more obese people, which is why rates of both obesity and type 2 diabetes have risen in parallel over recent decades. However, even lean people can develop insulin resistance and type 2 diabetes, and some obese people remain insulin sensitive and do not develop diabetes. This incomplete association of obesity with insulin resistance and diabetes suggests that other factors are at play, which has been interpreted as indirect evidence for a genetic component to the cause of type 2 diabetes. However, the strength of the association between obesity and type 2 diabetes, even if it is incomplete, suggests that the primary causes are environmental, as will be discussed under risk factors. In most cases, distinguishing between type 1 and type 2 diabetes is not difficult. People with type 1 diabetes tend to be leaner at the onset of the disease, and this form of diabetes is more common than type 2 diabetes in younger people. Those with type 2 diabetes tend to be older and heavier. However, the obesity epidemic has begun to affect children, and with childhood obesity has come a trend toward younger people developing type 2 diabetes. Also, as mentioned above, sometimes lean people develop insulin resistance and type 2 diabetes. Thus, in some cases, making the distinction between type 1 and type 2 diabetes can be difficult. Patients with type 2 diabetes sometimes require insulin to control their blood glucose; however, the use of insulin does not change the type of diabetes they have. The classification scheme is based on the pathophysiologic defect causing hyperglycemia, not on the type of treatment used. In contrast with the absolute insulin deficiency characteristic of type 1 diabetes, people with type 2 diabetes continue to make insulin, albeit at a rate that does not overcome their insulin resistance sufficiently to normalize blood glucose levels [4]. Therefore, measuring circulating insulin levels would seem to be an easy way to distinguish type 1 from type 2 diabetes. However, insulin administered as a medicine, necessary for the survival of a patient with type 1 diabetes, would be measured and result in a false negative test for insulin deficiency. In addition, insulin has historically been difficult to measure routinely as a clinical test. Therefore, simply measuring insulin levels in a newly diabetic person has not been an effective method to distinguish between type 1 and type 2 diabetes in cases in which the diagnosis is not obvious. However, another protein, the C peptide, can be measured as a surrogate for endogenous insulin and can aid in making the correct diagnosis. The C peptide is part of the initial polypeptide chain that eventually is processed into insulin. It is cleaved from the rest of the chain and remains in the secretory granules within the β cells until it is secreted, in equimolar amounts, with insulin. The C peptide is relatively easy to measure in a clinical laboratory. If the level of C peptide in the patient’s blood is undetectable or very low, a diagnosis of type 1 diabetes is suggested. If the level of C peptide is normal or high, despite hyperglycemia, then type 2 diabetes is more likely. Gestational diabetes is defined as impaired glucose regulation (elevated fasting glucose or abnormal glucose tolerance) that develops or is first recognized during pregnancy [5, 6]. This definition leaves open the possibility that some women diagnosed with gestational diabetes may have had preexisting diabetes (of any type) that was not recognized prior to pregnancy. Because pregnancy is a time of more frequent contact with health care providers, and because screening for diabetes in pregnancy is common, it is likely that some women with diabetes that predated their pregnancy are first diagnosed during pregnancy and categorized as having gestational diabetes despite having diabetes that could have been diagnosed prior to pregnancy had the women been tested. As is discussed later, gestational diabetes is diagnosed with lower blood glucose thresholds than diabetes mellitus outside pregnancy. Therefore, a nonpregnant woman with nondiabetic glucose test results who becomes pregnant could be diagnosed with gestational diabetes even with no change in her glucose concentrations. However, pregnancy is believed to be a time of increased insulin resistance [7], so it may be a time when women with a predisposition to hyperglycemia, as a result of either insulin resistance or β cell defects, even if subclinical outside pregnancy, may develop sufficient hyperglycemia to be diagnosed with gestational diabetes. Indeed, the first criteria for diagnosing gestational diabetes [8] were designed to predict those women who would develop type 2 diabetes after pregnancy. After the pregnancy, women who had gestational diabetes should be reclassified as having type 1 diabetes, type 2 diabetes, another type of diabetes, or not having diabetes. Therefore, gestational diabetes is not a “type” of diabetes in the same sense as the other types, but a designation of the condition under which diabetes or impaired glucose regulation is first diagnosed. Other, rarer types of diabetes mellitus include those caused by single gene mutations affecting β cell function. These genetic defects are inherited in an autosomal dominant fashion and cause maturity onset diabetes of the young (MODY), with onset usually in adolescence or early adulthood. MODY generally is not associated with insulin resistance or autoimmunity against insulin or islet cells. Other conditions that damage the pancreas, including trauma, pancreatitis, cystic fibrosis, and pancreatic carcinoma, can destroy β cells and lead to diabetes from insulin deficiency. While technically not type 1 diabetes, these rare types of diabetes are treated with exogenous insulin just as type 1 diabetes would be. A report [9] published in 2013, including data from the 2005–2010 National Health and Nutrition Examination Survey (NHANES), stated that the prevalence of diabetes during this period in the U.S. population aged at least 20 years was 12.1%, with 8.2% previously diagnosed and 3.9% undiagnosed. This overall prevalence represents a 45% increase from 1988. The figure for previously diagnosed diabetes was based on self-reports to questionnaires. The undiagnosed figure was based on a combination of fasting plasma glucose and HbA1c. This report did not distinguish between the types of diabetes; however, presumably, the large majority was type 2. Using HbA1c alone to detect diabetes in the NHANES population resulted in a lower prevalence. The Centers for Disease Control and Prevention (CDC) reported [10] in 2011 that approximately 25.9 million Americans, or 8.3% of the U.S. population, had diabetes, of whom 7 million had not been diagnosed. The difference between this figure and the 12.1% cited in the previous paragraph is due to methodological differences in the calculation and, importantly, because this latter figure includes those under 20 years of age, in whom diabetes is less prevalent. Approximately 215,000 of those under 20 years of age had diabetes, whereas 10.9 million of those over 65 (26.9%) did. Among non-Hispanic blacks over 20 years of age, 18.7% had diabetes, whereas the figure was 10.2% for non-Hispanic whites. American Indians and Alaska Natives also had a disproportionately high prevalence of diabetes, at 14.2%. However, regional differences were striking: Alaska Native adults had a prevalence of only 5.5%, whereas American Indian adults in southern Arizona had a prevalence of 33.5%. The CDC tracks diabetes and obesity prevalence by county throughout the United States. The most recently available maps (Figure 2.2) provide a visual indicator of the strong association of geographic areas with high prevalence rates of diabetes and obesity. Figure 2.2A Age-adjusted prevalence of diagnosed diabetes among U.S. adults. Figure 2.2B Age-adjusted prevalence of obesity among U.S. adults. As is discussed in more detail later, “prediabetes” is defined by abnormalities of fasting glucose, two-hour post-load glucose, or HbA1c that do not meet diagnostic levels for diabetes. The CDC estimates that 35% of the U.S. population over 20 years of age (79 million Americans) has prediabetes, based on fasting glucose or HbA1c levels obtained in the National Health and Nutrition Examination Survey, the National Health Interview Survey, data from the Indian Health Service, and 2010 U.S. resident population estimates [10]. The estimated prevalence of prediabetes in those over 65 years of age is 50%. Prediabetes does not have the dramatic racial/ethnic differences in prevalence that diabetes has, with estimated prevalence among adults being 35% for non-Hispanic whites, 35% for non-Hispanic blacks, 36% for Mexican Americans, and 20% for American Indians. It should be noted, however, that the data source and method used to estimate the prevalence for American Indians was different from those used for the other racial/ethnic groups. The CDC figures cited above include both type 1 and type 2 diabetes; however, the large majority is type 2 [10]. Among people younger than 20 years, type 1 diabetes remains more common. In children under 10 years of age, 19.7 new cases of type 1 diabetes occur per 100,000 children per year, compared with 0.4 new cases of type 2 diabetes per 100,000 children per year. Among those between 10 and 20 years of age, 18.6 new cases of type 1 diabetes are diagnosed per 100,000 youth per year, compared with 8.5 cases per year of type 2 diabetes. According to the CDC [10], gestational diabetes occurs in 2–10% of pregnancies in the U.S., which is consistent with the estimates of 1.7–11.6% from Schneider [11], whose figures were for the world’s advanced economies, not just the United States. Based on data from the Hyperglycemia and Adverse Pregnancy Outcomes (HAPO) study [12], and using International Association of Diabetes in Pregnancy Study Groups (IAPDSG) criteria [13] that diagnose more women than do many previous criteria, the prevalence of gestational diabetes in the United States is estimated to be 18%. Of women diagnosed with gestational diabetes, 5–10% are believed to have type 2 diabetes that was present but not diagnosed before pregnancy [10]. The diagnostic criteria for diabetes mellitus for nonpregnant patients [6] (Table 2.1) include HbA1c at least 6.5% (48 mmol/mol), fasting plasma glucose at least 126 mg/dl (7.0 mmol/l), or 2-hour plasma glucose at least 200 mg/dl (11.1 mmol/l) after drinking the equivalent of 75 gm of anhydrous glucose dissolved in water. HbA1c is a test that estimates the average plasma glucose over the previous two to three months, although the result is a percentage of the circulating adult hemoglobin (HbA) that is glycated, rather than an estimate of average glucose in mg/dl or mmol/l. Any of these test results, if positive, should be confirmed by repeat testing to make the diagnosis. However, if a patient has symptoms of hyperglycemia or is in a hyperglycemic crisis, a random plasma glucose, without regard to the timing of the last meal, of at least 200 mg/dl (11.1 mmol/l) is diagnostic, without the need for confirmation testing. Table 2.1 Diagnostic criteria1 for diabetes and prediabetes in nonpregnant people. 2 1Diagnosing diabetes (but not prediabetes) requires repeating the abnormal test on another day unless the patient has HbA1c ≥6.5% and either FPG or two-hour PG exceeds the diabetes threshold or if random plasma glucose ≥200 mg/dl with symptoms of hyperglycemia. 2Adapted from American Diabetes Association. Diagnosis and classification of diabetes mellitus. Diabetes Care 2013; 36 (suppl 1): S67–S74. 3 Fasting plasma glucose. 4 Plasma glucose obtained two hours after ingestion of 75 gm of anhydrous glucose dissolved in water, or an equivalent glucose load. These fasting and two-hour plasma glucose criteria were established on the basis of increased risk of diabetic retinopathy, which is, using currently available diagnostic methods, the complication most specific to diabetes. Figure 2.3 shows prevalence of retinopathy by glucose value, with the glucose values shown on the X axis divided into deciles of the population to allow superimposition of the curves for fasting and 2-hour glucose and HbA1c. The prevalence of retinopathy remains low through most of the glucose distribution, by any of the three tests, until it begins to increase in the second highest decile and increases exponentially thereafter. There is no discrete inflection point; however, the diagnostic cutpoints were established to approximate an inflection point on these curves. The association of 2-hour plasma glucose and retinopathy was first shown [14] among the Pima Indians of central Arizona, a population with a very high prevalence of type 2 diabetes. In the same population the similar association with the other glycemic measures (fasting plasma glucose and HbA1c) by deciles was then shown [15] and subsequently confirmed in an Egyptian population [16] and in a broader cross-section of U.S. adults [1], using data from NHANES III. The HbA1c diagnostic threshold was added by the American Diabetes Association in 2010 [17] after having been recommended the previous year by the International Expert Committee [18]. The delay in acceptance of the HbA1c as a diagnostic test for diabetes was largely due to slow standardization of this test across laboratories and to its being influenced by non-glycemic factors including conditions that may alter the stability or type of hemoglobin, such as anemia and hemoglobinopathies. Figure 2.3 Retinopathy prevalence by deciles of fasting plasma glucose, two-hour plasma glucose, and HbA1c. *Plasma glucose two hours after a 75-gm oral glucose load. †Fasting plasma glucose. ‡The numbers shown are the boundaries between deciles. Adapted from McCance DR, Hanson RL, Charles MA, et al. Comparison of tests for glycated hemoglobin and fasting and two hour plasma glucose concentrations as diagnostic methods for diabetes. BMJ 1994; 308: 1323–1328.
Classification, epidemiology, diagnosis, and risk factors of diabetes
Introduction
Classification
Epidemiology
Diagnosis
Normal if all values are as shown below
Prediabetes if any one value is as shown below, but diabetes criteria not met
Diabetes if any one value is as shown below
FPG (mg/dl) 3
< 100
100–125
≥ 126
Two-hour PG (mg/dl) 4
< 140
140–199
≥ 200
HbA1c (%)
< 5.7
5.7–6.4
≥ 6.5
Related posts:
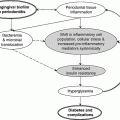 The influence of periodontal disease on glycemic control in diabetes
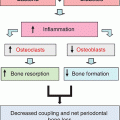 Periodontal disease as a complication of diabetes mellitus
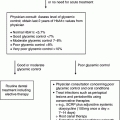 Management of the patient with diabetes mellitus in the dental office
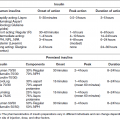 Glycemic treatment of diabetes mellitus
 4: The patient with diabetes mellitus and xerostomia
 6: Prosthodontic treatment for the newly diagnosed patient with type 2 diabetes mellitus
Stay updated, free articles. Join our Telegram channel

Full access? Get Clinical Tree


