Abstract
Myelodysplastic syndromes (MDS) comprise a heterogeneous group of myeloid neoplasms defined by peripheral cytopaenia, morphologic dysplasia in one or more haematopoietic lineages, and genetic instability with risk of transformation to acute myeloid leukaemia (AML). A diagnosis of MDS requires the presence of cytopaenia, plus one or more of the following diagnostic features: morphologic evidence of dysplasia in >10% of cells involving at least one haematopoietic lineage, increased blasts, and/or an MDS-defining cytogenetic abnormality. Modern diagnosis of MDS was standardized by the French–American–British (FAB) cooperative group in 1982, which included the first standard descriptions of myelodysplasia [1], and was further refined in the World Health Organization (WHO) classification of 2001, which more specifically quantified dysplasia (Table 8.1) [2].
Introduction
Myelodysplastic syndromes (MDS) comprise a heterogeneous group of myeloid neoplasms defined by peripheral cytopaenia, morphologic dysplasia in one or more haematopoietic lineages, and genetic instability with risk of transformation to acute myeloid leukaemia (AML). A diagnosis of MDS requires the presence of cytopaenia, plus one or more of the following diagnostic features: morphologic evidence of dysplasia in >10% of cells involving at least one haematopoietic lineage, increased blasts, and/or an MDS-defining cytogenetic abnormality. Modern diagnosis of MDS was standardized by the French–American–British (FAB) cooperative group in 1982, which included the first standard descriptions of myelodysplasia [1], and was further refined in the World Health Organization (WHO) classification of 2001, which more specifically quantified dysplasia (Table 8.1) [2].
Table 8.1 Diagnostic criteria of myelodysplastic syndrome (MDS) entities according to the 2016 WHO Classification (adapted from [2]).
| Name | Abbreviation | Dysplastic lineages | Cytopaenias | RS | Bone marrow (BM) and peripheral blood (PB) blasts | Cytogenetics by conventional karyotype |
|---|---|---|---|---|---|---|
| MDS with single lineage dysplasia | MDS-SLD | 1 | 1–2 | <15% or <5% if SF3B1 mutation | BM <5%, PB <1%, no Auer rods | Any, unless fulfils criteria for MDS with isolated del(5q) |
| MDS with multilineage dysplasia | MDS-MLD | 2–3 | 1–3 | <15% or <5% if SF3B1 mutation | BM <5%, PB <1%, no Auer rods | Any, unless fulfils criteria for MDS with isolated del(5q) |
| MDS with ring sideroblasts with single lineage dysplasia | MDS-RS-SLD | 1 | 1–2 | >15% or >5% if SF3B1 mutation | BM <5%, PB <1%, no Auer rods | Any, unless fulfils criteria for MDS with isolated del(5q) |
| with multilineage dysplasia | MDS-RS-MLD MDS del(5q) | 2–3 | 1–3 | >15% or >5% if SF3B1 mutation | BM <5%, PB <1%, no Auer rods | Any, unless fulfils criteria for MDS with isolated del(5q) |
| MDS with isolated del(5q) | 1–3 | 1–2 | Not relevant | BM <5%, PB <1%, no Auer rods | Del(5q) alone or with 1 additional abnormality, except -7 or del(7q) | |
| MDS with excess blasts | ||||||
| Type 1 | MDS-EB-1 | 1–3 | 1–3 | Not relevant | BM 5-9% or PB 2-4%, no Auer rods | Any |
| Type 2 | MDS-EB-2 | 1–3 | 1–3 | Not relevant | BM 10-19% or PB 5-19% or Auer rods | Any |
| MDS, unclassifiable with 1% blood blasts | MDS-U | 1–3 | 1–3 | Not relevant | BM <5%, PB = 1% (at least 2) | Any |
The main challenges in making a diagnosis of MDS include distinguishing MDS from neoplastic and non-neoplastic mimics and to accurately classify MDS once a diagnosis has been made. The WHO classification relies mainly on the degree of dysplasia and blast percentages for disease classification, but also incorporates cytogenetics and degree of cytopaenias. A clinical risk-stratification scheme of MDS is the International Prognostic Scoring System (IPSS), which complements the WHO Classification and is often used to determine therapeutic approach and to stratify patients in clinical trials [3]. In 2012, the IPSS was revised (IPSS-R) with an updated cytogenetic stratification system and a more detailed evaluation of cytopaenias and blast percentages [4].
Epidemiology
Myelodysplastic syndrome is a disease of older adults with median age at presentation of 70 to 75 years and it occurs more frequently in men by a factor of approximately 1.8 [5]. The prevalence of MDS in the United States is estimated to be 60,000 to 170,000 [5]. Estimated rates per 100,000 per year in elderly patients increase from 13.5 in those aged 65 to 69 years to 63.6 in those aged ≥85 years. These figures are likely underestimates as many patients with indolent or low-grade forms of MDS may not be registered in national databases used to estimate incidence [6]. The incidence and prevalence of MDS has increased significantly over the past 20 years as a result of increasing longevity of the population and increasing physician awareness [7].
A definitive aetiology for de novo MDS has not been established but possible inciting agents include benzene and other solvents (exposure above safe levels), ionizing radiation, pesticides and smoking [8]. Studies have also reported a significant association between body mass index (BMI) and the subsequent development of MDS [9]. Therapy-related MDS occurs as a complication of cytotoxic chemotherapy or radiation treatment for a previous unrelated malignancy. The cytotoxic agents commonly implicated include alkylating agents, topoisomerase II inhibitors, antimetabolites and ionizing radiation therapy [10]. Prior malignancies mostly include solid tumours and occasionally other prior haematologic malignancies; rarely, the cytotoxic therapy may be given for non-neoplastic diseases, such as autoimmune diseases or vasculitis. The WHO classification considers therapy-related MDS together with therapy-related cases of acute myeloid leukaemia (AML) and myelodysplastic/myeloproliferative neoplasms (MDS/MPN) as a unique clinical syndrome with a poor prognosis, with median survival of only eight months and five-year survival of less than 10% [11, 12].
The development of MDS can also be associated with inherited haematologic disorders such as Fanconi anaemia, dyskeratosis congenita and Shwachman–Diamond syndrome [13]. The recognition and diagnosis of myeloid malignancies that arise from an underlying germline mutation is necessary for the proper clinical management and follow-up of affected individuals [14]. A major change in the revised WHO classification is an addition of a section on myeloid neoplasms with germline predisposition, which includes cases of MDS, MDS/MPN and acute leukaemias that occur on the background of a predisposing germline mutation [11]. The presence of a genetic predisposition does not in itself place a case into the category of a myeloid neoplasm and standard diagnostic features of MDS are still required in this patient population [11].
Clinical Features
Patients with MDS present with cytopaenias that vary in severity but are typically sustained and progressive without treatment. The standard laboratory values for cytopaenias are haemoglobin <13 g/dL (males) or <12 g/dL (females), absolute neutrophil count (ANC) <1.8 × 10⁹/L, and platelets <150 × 109/L (or less than each individual’s laboratory range), but most patients have at least one cytopaenia below the thresholds established in the original IPSS (haemoglobin <10 g/dL, platelet count <100 × 109/L and ANC <1.8 × 10⁹/L)[5]. Anaemia is the most common cytopaenia at presentation and is usually macrocytic, with a median MCV of 97 fL.
Symptoms and signs of MDS at presentation are usually related to the cytopaenias and include weakness, pallor, fatigue, petechiae and bleeding [14–17]. Fatigue is nearly ubiquitous in patients with MDS and is sometimes out of proportion to the degree of anaemia [18]. Patients may develop infections related to neutropaenia and granulocyte dysfunction. Bacterial infections predominate, with the skin being the most common site involved; although fungal, viral and mycobacterial infections can also occur, they are rare in the absence of concurrent administration of immunosuppressive agents [19]. Occasional patients are asymptomatic and cytopaenias are noted during a routine complete blood count or when increased blasts, dysplastic morphology or clonal cytogenetic abnormalities are identified in studies of peripheral blood or BM obtained for other purposes. Physical findings in MDS are non-specific: the majority of patients are pale (reflecting anaemia), and they may have petechiae and/or purpura (due to thrombocytopaenia) [20]. Hepatomegaly, splenomegaly and lymphadenopathy are uncommon.
Morphology
Peripheral Blood
On the peripheral smear, anisopoikilocytosis (variation in size and shape) of peripheral blood erythrocytes is often seen. Red cell distribution width (RDW) is typically increased and sometimes there is a dual population of red blood cells (RBCs), with one being normocytic or microcytic and hypochromic and the second being macrocytic [21]. The anaemia may be isolated, or it may coexist with neutropaenia or thrombocytopaenia [22]. Isolated neutropaenia or thrombocytopaenia is seen infrequently [22]. Due to the ineffective haematopoiesis inherent to MDS, reticulocyte production is typically low [23].
Morphologic evaluation of the peripheral blood smear may also show abnormal, hypogranular platelets, basophilic stippling and poikilocytosis in red blood cells, and pseudo-Pelger–Huet nuclear anomaly and hypogranular cytoplasm in neutrophils. Circulating blasts on the peripheral smear may be seen in some patients and the peripheral smear should always be carefully evaluated for the presence of blasts, even in the setting of marked leukopaenia. Other immature haematopoietic precursors including nucleated RBCs, megakaryocyte nuclei and mononuclear megakaryocytes may circulate in the peripheral blood [23].
Bone Marrow Findings
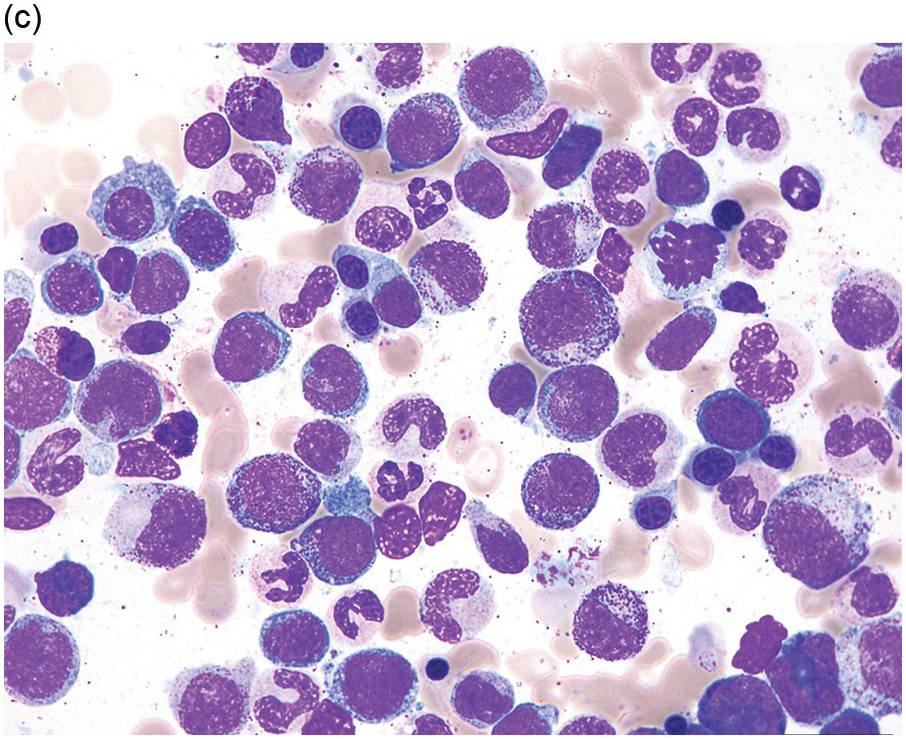
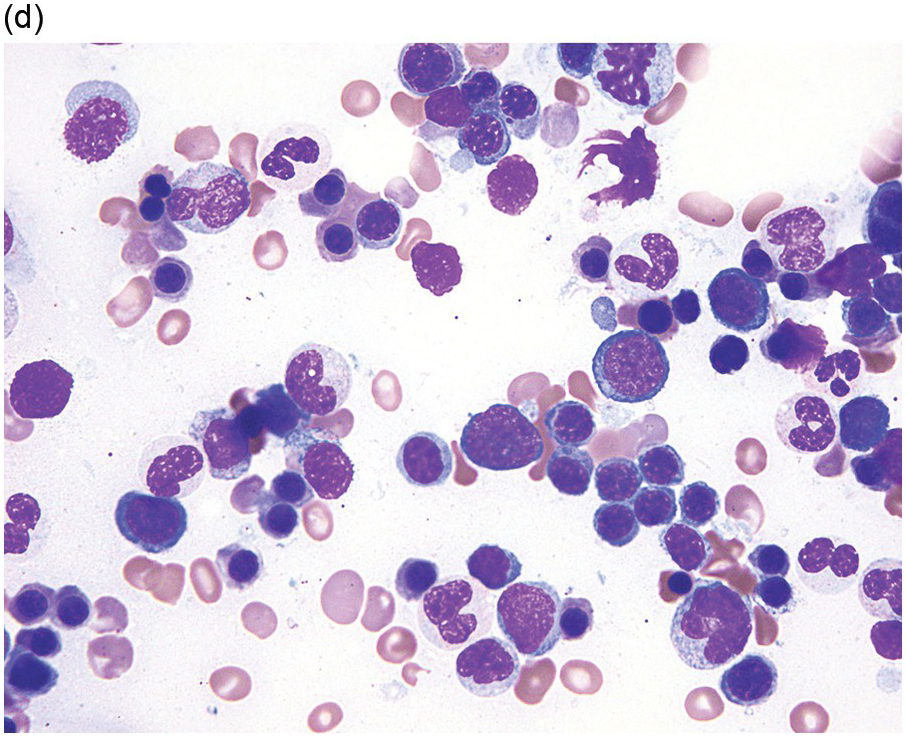
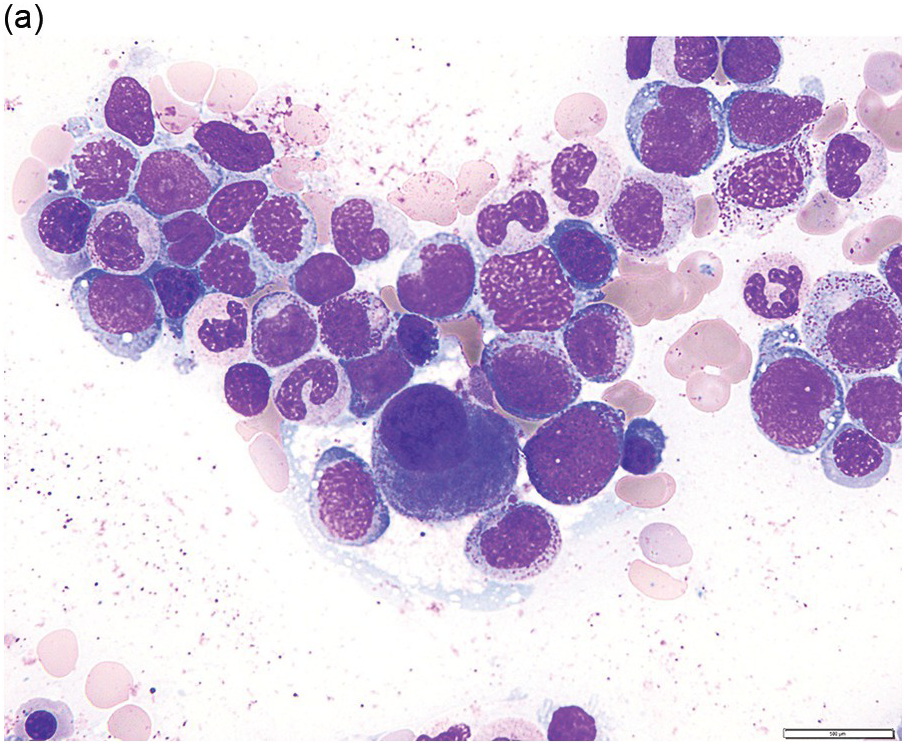
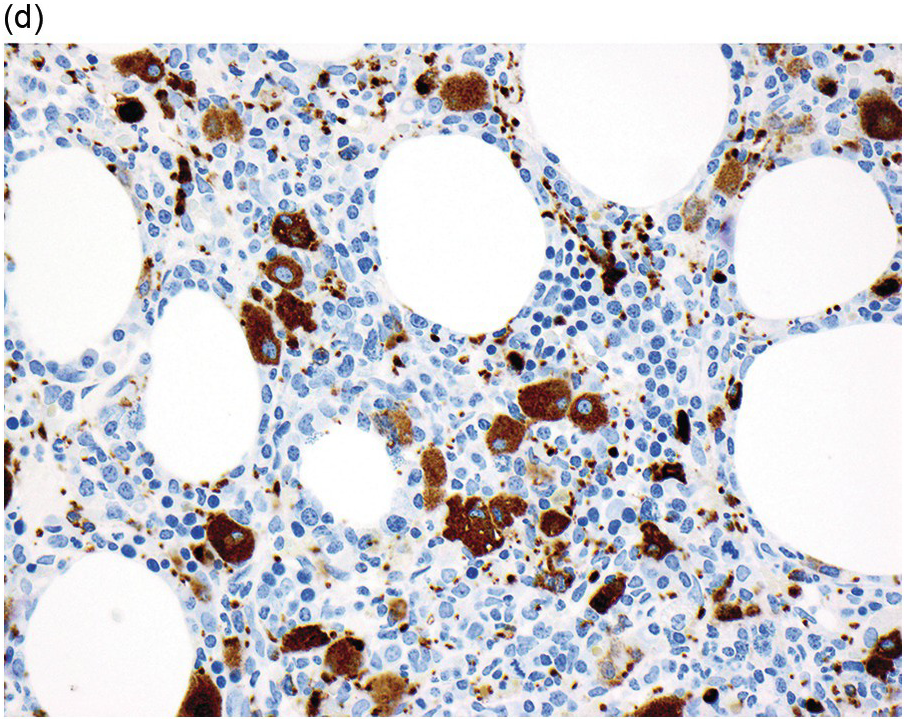
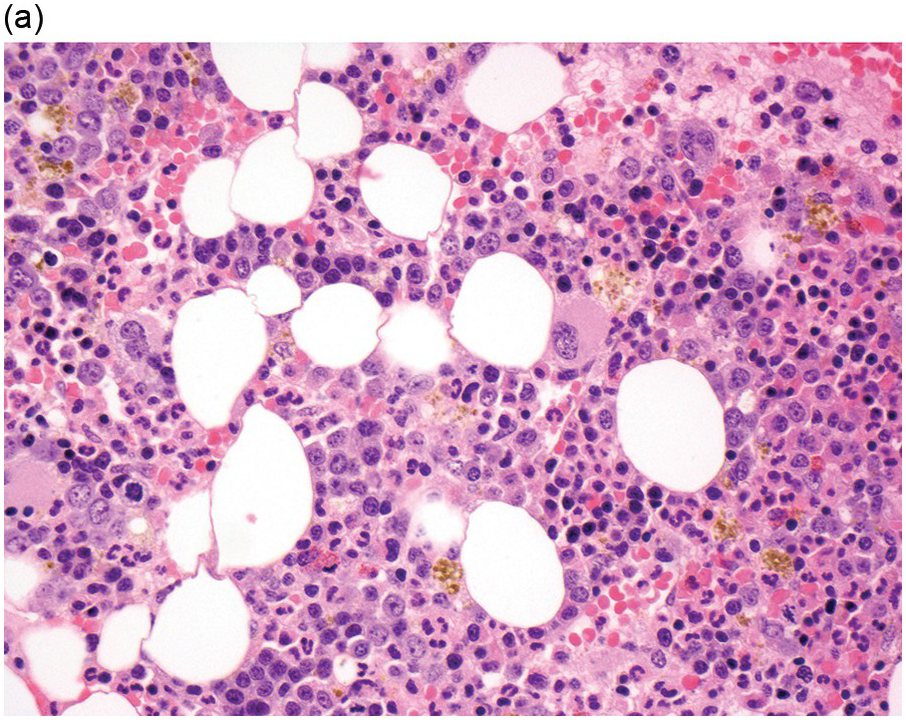
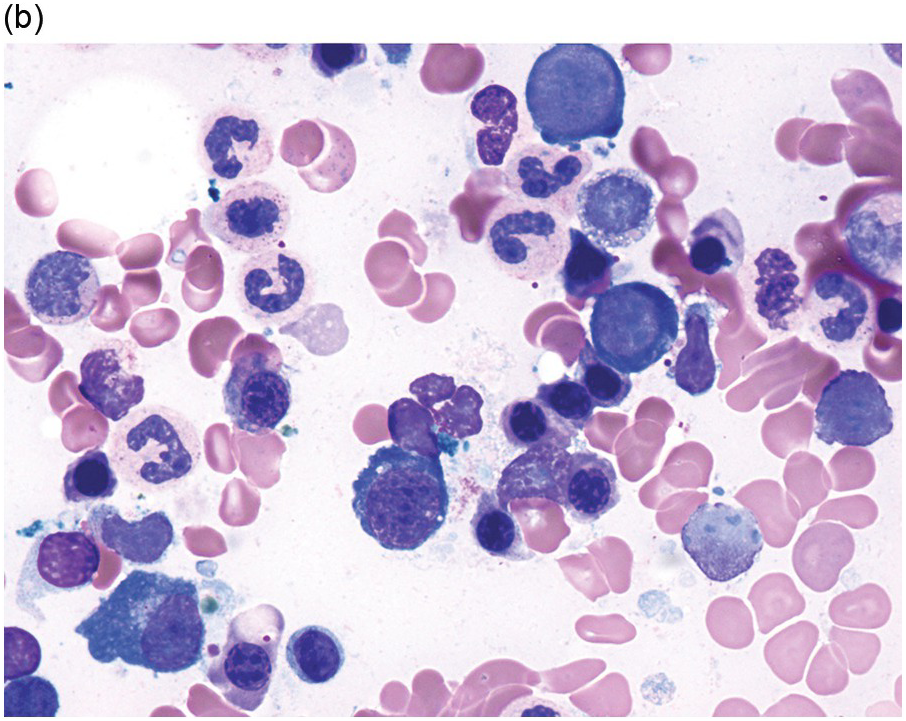
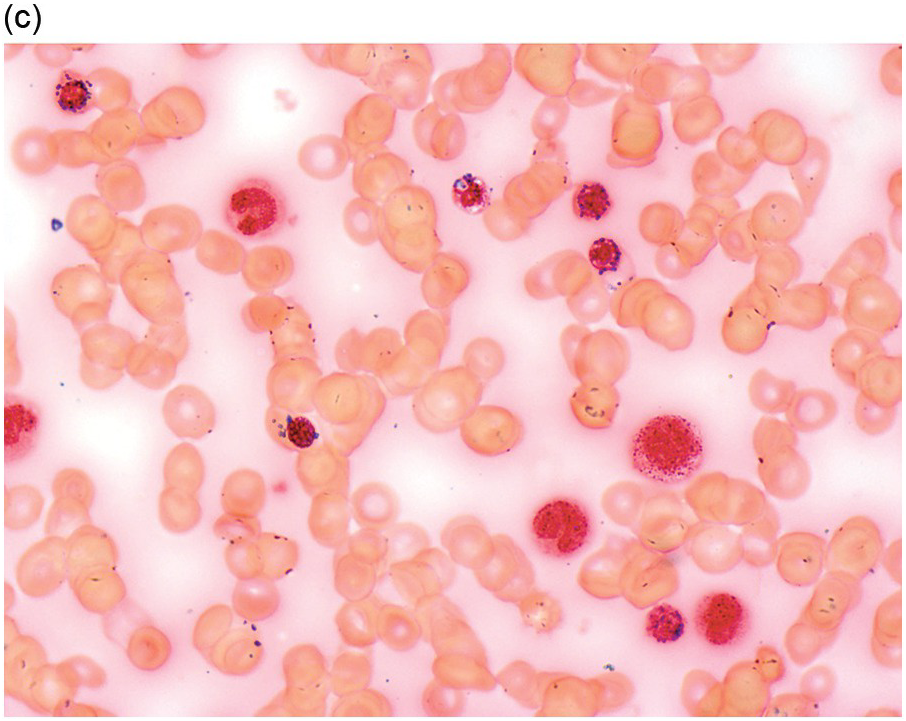
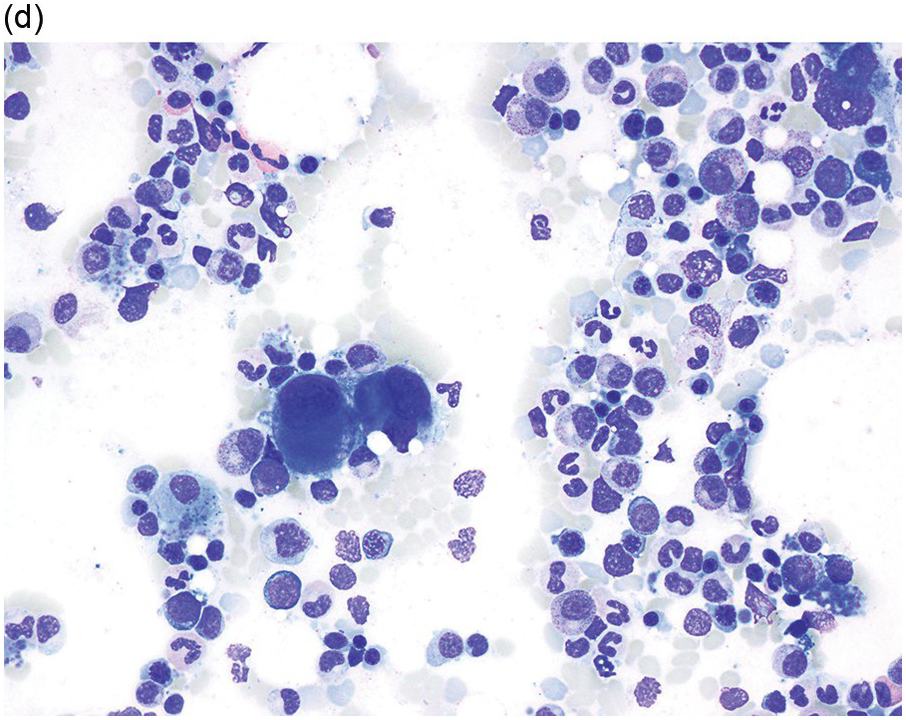
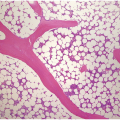
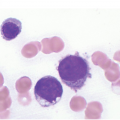
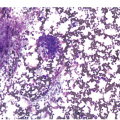
The diagnosis of MDS is based mainly on morphological findings in the bone marrow (BM). Most cases show a markedly increased marrow cellularity [24, 25]. Hypocellularity is more frequent in paediatric MDS, following prior aplastic anaemia, and in therapy-related MDS. Erythroid dysplasia (illustrated in Figure 8.1) is most often characterized by nuclear irregularities in maturing erythroid precursors, multinucleation, nuclear budding, abnormal chromatin condensation, karyorrhexis, and asynchronous maturation of the nucleus and cytoplasm (i.e. retained nuclear features of immaturity in the setting of advanced haemoglobinization of the cytoplasm) [25]. Cytoplasmic changes, including ring sideroblasts and vacuolization of early forms, can also be seen. Ring sideroblasts are defined as erythroblasts with at least five siderotic granules surrounding at least a third of the nuclear circumference, as a result of iron accumulation within mitochondria, including some deposited as mitochondrial ferritin [26]. In granulocytes (illustrated in Figure 8.2), the typical dysplastic changes include decreased numbers of nuclear lobes in mature granulocytes, abnormal clumping of chromatin or loss of cytoplasmic granules (hypogranulation). Dysplastic megakaryocytes (illustrated in Figure 8.3) show widely separated nuclear lobes or small size with nuclear hypolobation or non-lobation, seen in either the BM biopsy (BMB) or aspirate smear.
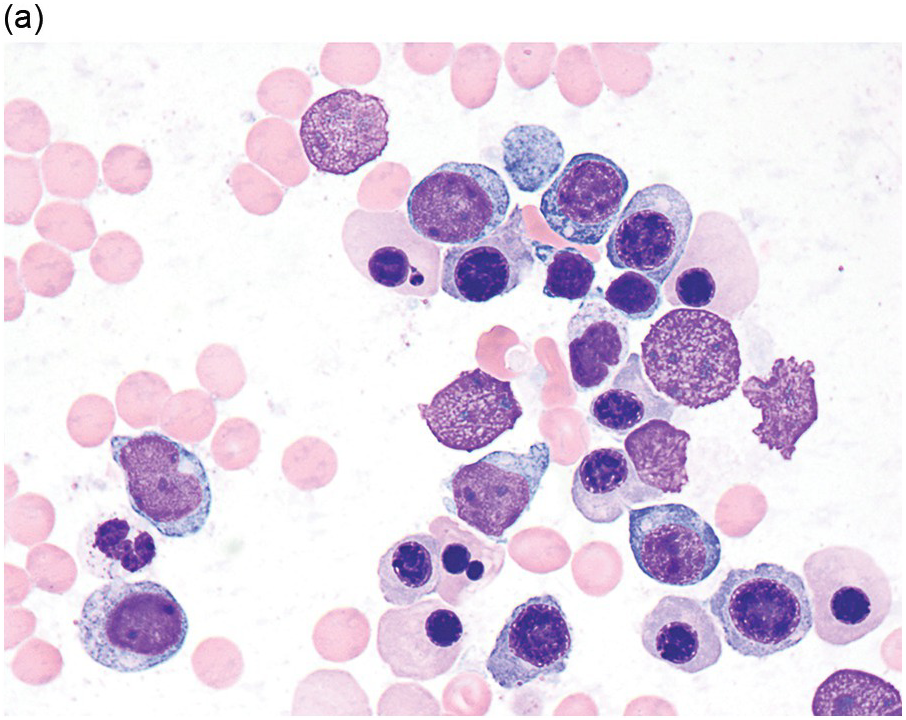
(a) Late erythroid forms showing nuclear budding and irregularities in the bone marrow aspirate.
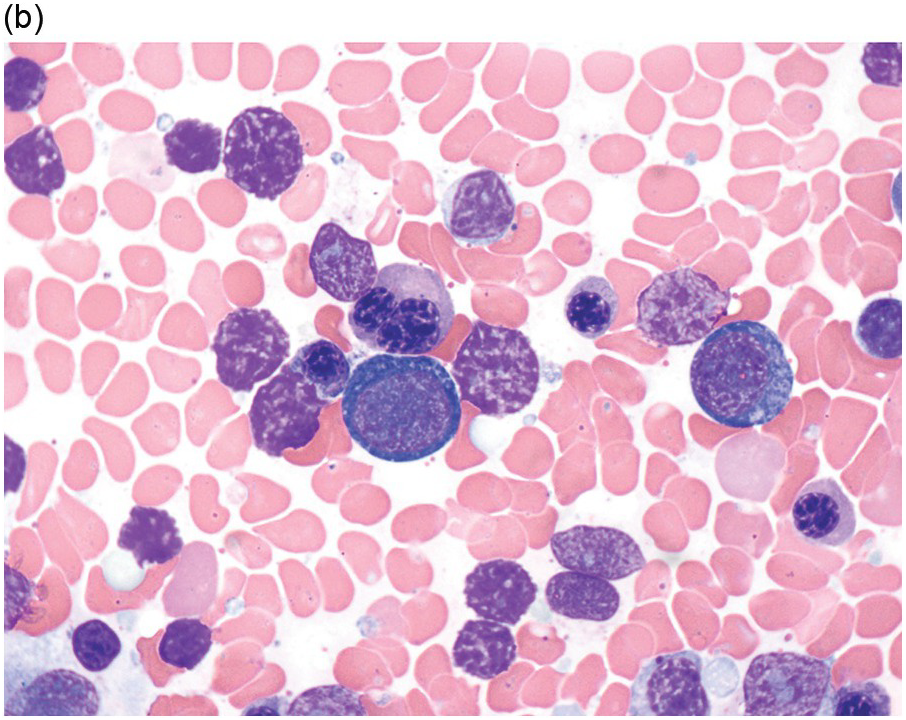
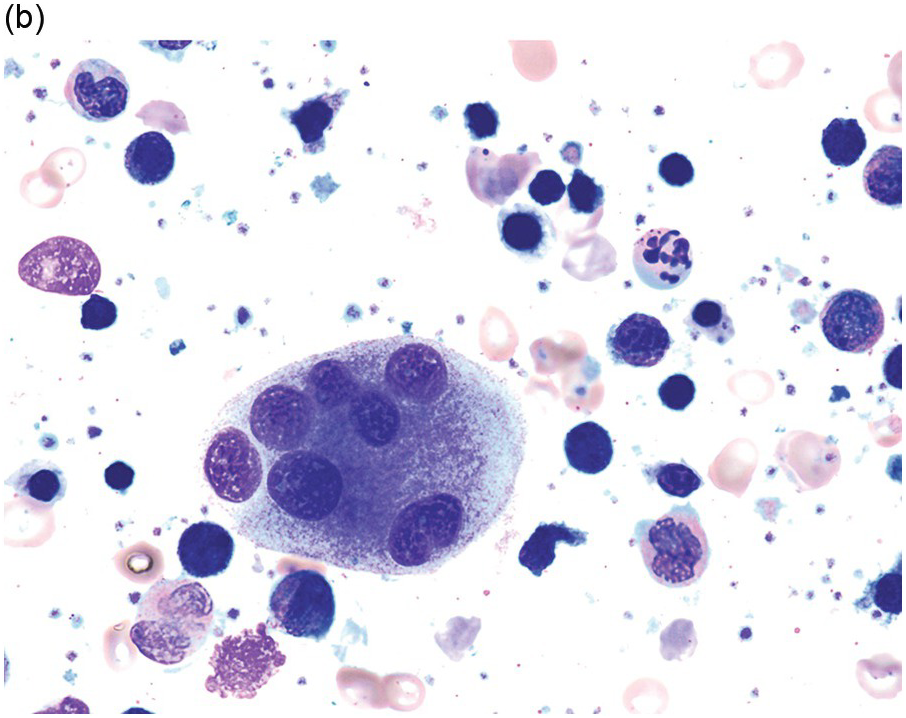
(b) A binucleate erythroid form in the bone marrow aspirate.
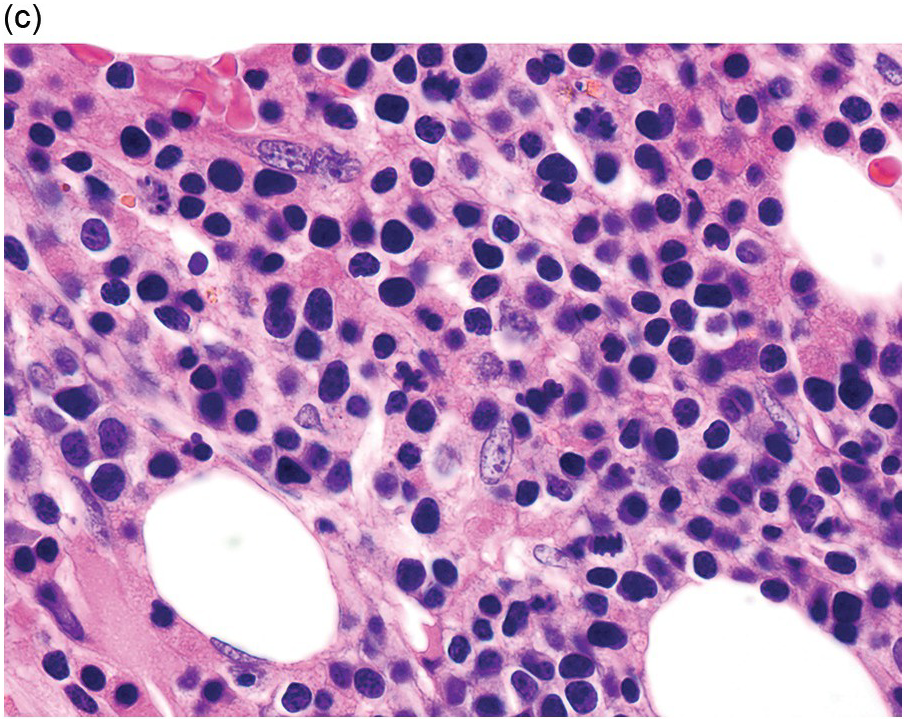
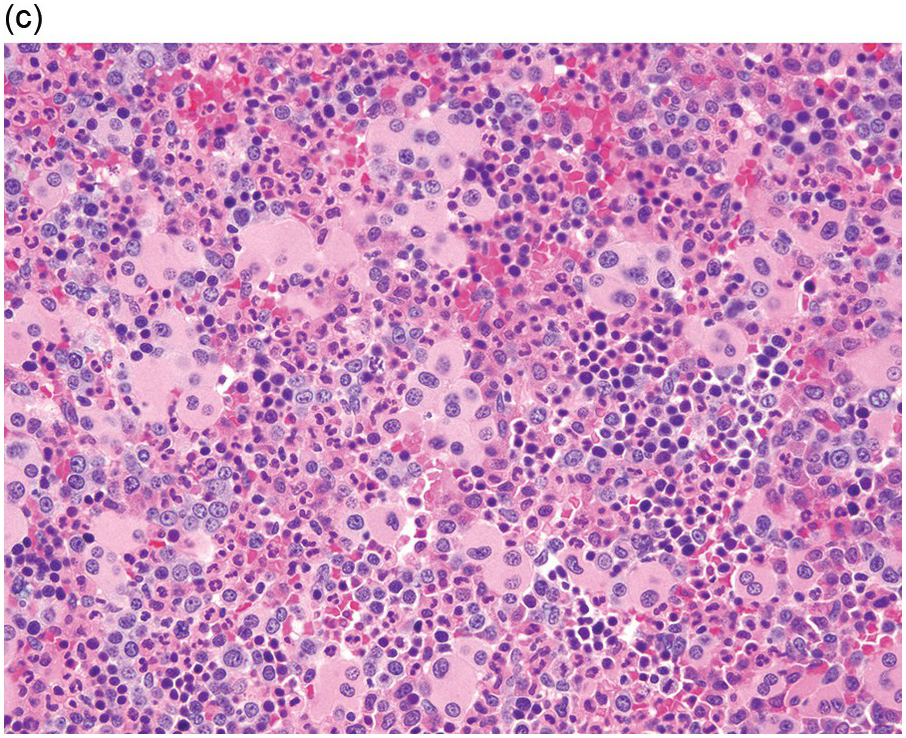
(c) Marked dysplastic nuclear irregularities demonstrated in the bone marrow biopsy section.
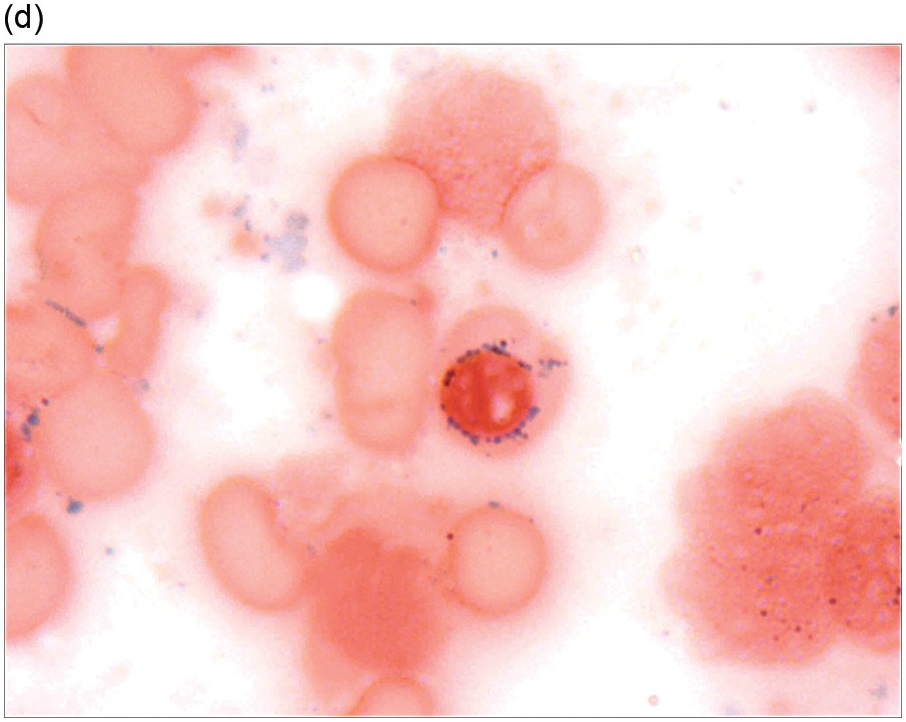
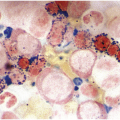
(d) A ring sideroblast on an iron stain of the bone marrow aspirate, with numerous iron granules closely apposed to and surrounding the nucleus.
Figure 8.1 Examples of dyserythropoiesis found in MDS patients.
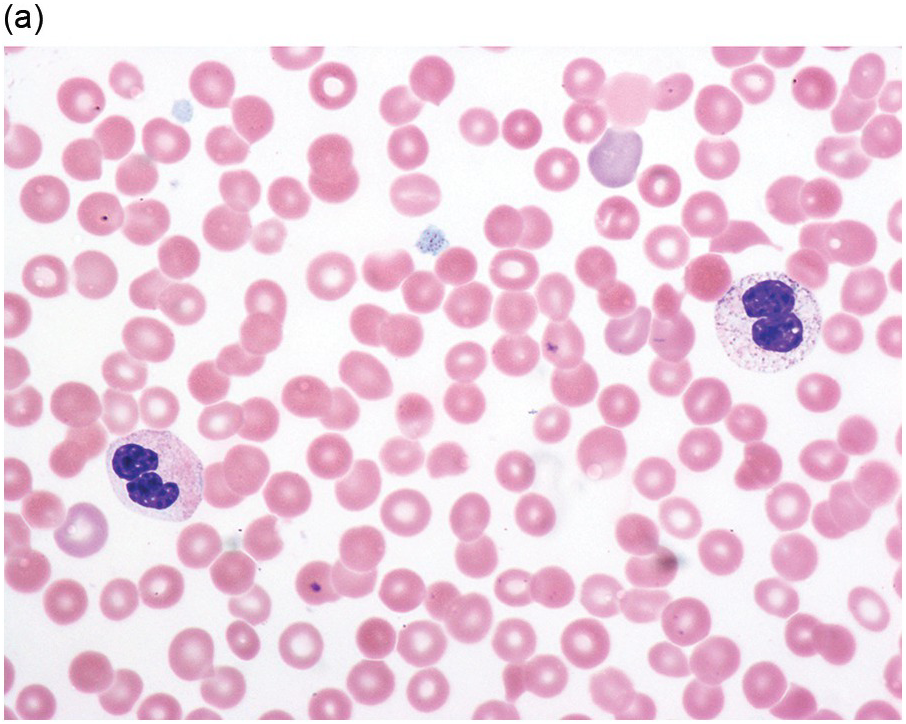
(a) Pseudo–Pelger–Huet neutrophils in the blood smear.
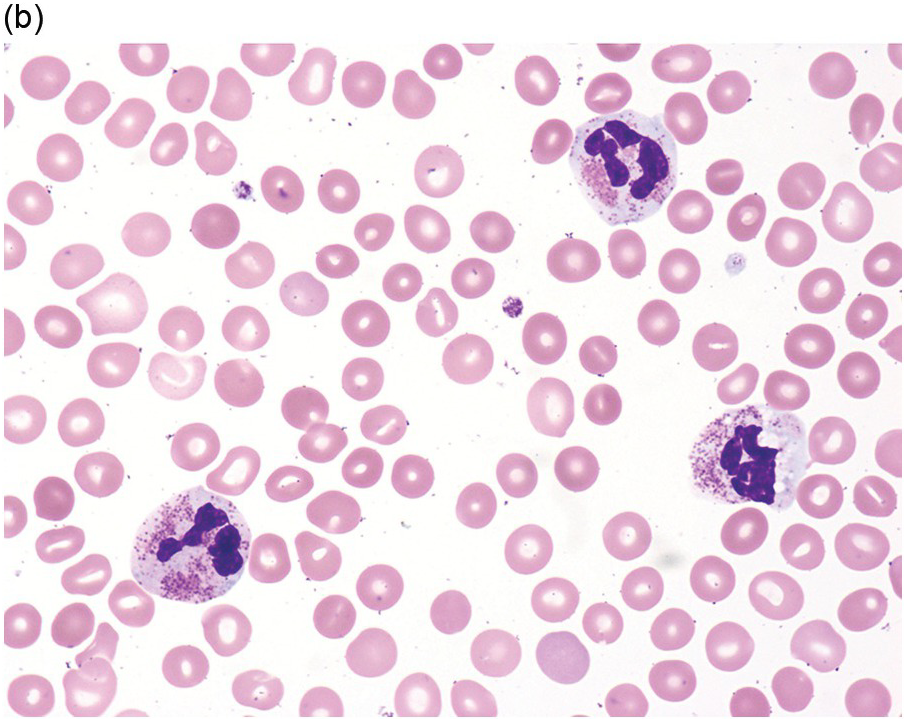
(b) Hypersegmented myeloid forms in the blood smear.
(c) Myeloid cells showing hypogranular cytoplasm and abnormal nuclear lobation and chromatin pattern in the bone marrow aspirate.
(d) Late granulocytic forms showing bilobed nuclei and hypogranular cytoplasm in the bone marrow aspirate.
(a) Megakaryocytes showing separated nuclear lobes in the bone marrow aspirate smear.
(b) A micromegakaryocyte in the aspirate smear.
(c) Markedly dysplastic megakaryocytes with separated nuclear lobes in the bone marrow biopsy.
(d) CD61 on the bone marrow biopsy, highlighting small megakaryocytes with rounded nuclei and micromegakaryocytes.
Accurate recognition of the features of dysplasia requires high-quality BM samples that are adequate in quantity and processed appropriately. The BMB should be adequately fixed and gently decalcified to preserve cellular morphology and antigenicity in case immunohistochemical stains are required [23]. Thin sectioning of the trephine BMB (at 2–3 microns) optimizes morphologic interpretation, particularly identifying micromegakaryocytes and recognizing signs of increased blasts. Bone marrow biopsy BMB sections can show abnormal localization of blast clusters away from the bony trabeculae (so-called ‘abnormal localization of immature precursors’) [27]. Reticulin staining of the BMB can be helpful, as mild to moderate degrees of fibrosis are reported in up to 50% of patients with MDS, while marked fibrosis is found in 10 to 15% and correlates with worse outcome [28–31]. The BM aspirate smear should contain spicules and demonstrate monolayers of well-preserved haematopoietic cells that show adequate staining of nuclei and cytoplasm with a Romanowsky-type stain (most commonly Wright–Giemsa). An iron stain should be performed on an aspirate smear slide to assess for the presence of iron and ring sideroblasts; iron staining of the BMB is less helpful, as some iron is lost during aqueous processing and decalcification.
An International Working Group on Morphology of MDS (IWGM-MDS) has provided recommendations for the definition and enumeration of blasts [33]. Myeloblasts are defined as having a high nuclear/cytoplasmic ratio, easily visible nucleoli and fine nuclear chromatin [33]. The cytoplasm may contain some (usually sparse) cytoplasmic granules and/or Auer rods, but no Golgi zone is detected. The percentage of blast cells in peripheral blood and BM is closely associated with the risk of leukaemic evolution and predicts prognosis, thus it is critical to accurately enumerate blasts in both blood and BM in every MDS case [32]. According to WHO, 20% blasts is the threshold for the diagnosis of AML [11]. The blast percentage both defines the WHO classification MDS categories as well as risk strata in the IPSS-R. In the latter, the BM blast percentage groups are 0–2%, 2–5%, 5–10% and over 10% [34]. In contrast, the WHO classification does not further subdivide cases with <5% BM blasts, but unlike the IPSS-R it does take into account the percentage of blasts in the peripheral blood.
The WHO classification suggests that at least 10% of cells in a given lineage show dysplastic features to consider that lineage to be dysplastic [11]. Depending on the number of lineages with ≥10% dysplastic cells, MDS cases may have single lineage or multilineage (bilineage or trilineage) dysplasia. Several studies have shown that interobserver variability in the morphologic diagnosis of MDS is low in the disease subtypes with excess blasts [35], but that there is significantly more disagreement in the diagnosis of lower grade MDS lacking increased blasts [36–38]. There is less concordance for dysplasia in erythroid precursors and megakaryocytes than for granulocyte precursors [38]. This variability is due in part to the subjective nature of morphologic assessment but is also dependent on the quality of the specimen, especially the aspirate smears (see above) [39]. Since prolonged exposure to anticoagulants can cause artefacts, the slides for the assessment of dysplasia should be made from freshly obtained specimens. Bone marrow aspirates should be examined for the percentages of dysplastic cells, blasts and ring sideroblasts (the latter on an iron-stained smear), and should be cellular enough to allow a 500-cell differential count. A minimum of at least 100 erythroblasts, 100 granulocytic cells and 30 megakaryocytes should optimally be evaluated; dysplastic features in megakaryocytes can be recognized in both the aspirate smear and the BMB, while erythroid and granulocytic dysplasia is best assessed in the aspirate sample [11].
Myelodysplastic Syndrome Categories
Myelodysplastic syndrome categories as outlined in the updated 2016 WHO classification include subtypes defined by the number of cytopaenias at presentation, the number of lineages showing dysplasia, ring sideroblasts and blast percentage. Examples of the MDS entities discussed below are shown in Figures 8.4 and 8.5.
(a) MDS with ring sideroblasts, showing hypercellular marrow biopsy with erythroid predominance.
(b) MDS with ring sideroblasts in the BM aspirate, with left-shifted and dysplastic erythroids.
(c) Iron stain on the aspirate smear from a case of MDS with ring sideroblasts, showing numerous ring sideroblasts.
(d) MDS with isolated del(5q) showing small megakaryocytes with round nuclei in the BM aspirate.
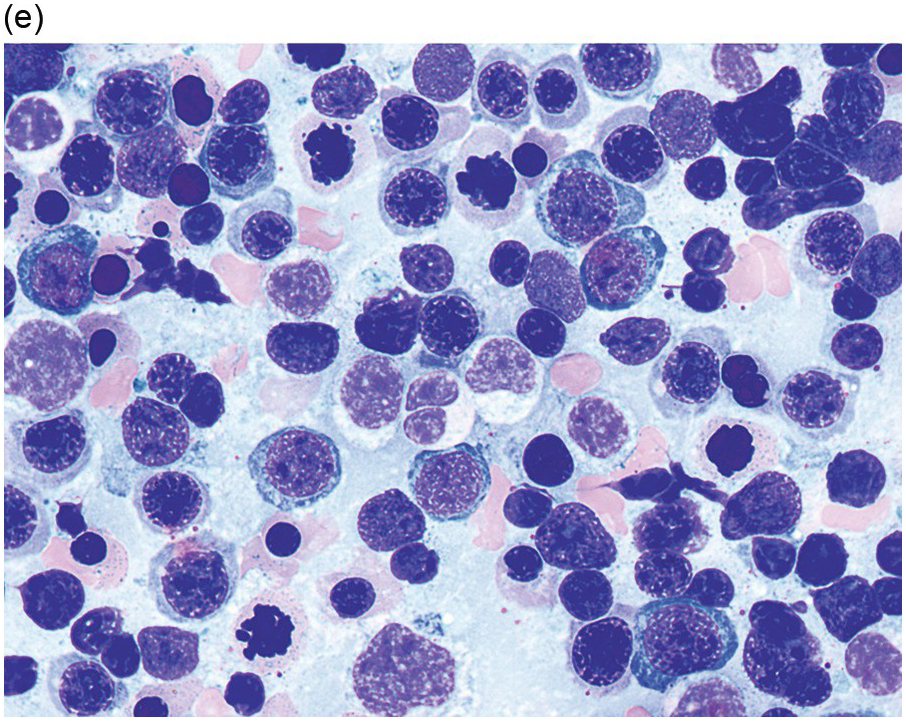
(e) MDS with multilineage dysplasia in the BM aspirate, showing erythroid nuclear irregularities and megaloblastoid change as well as hypogranulation of myeloid elements.
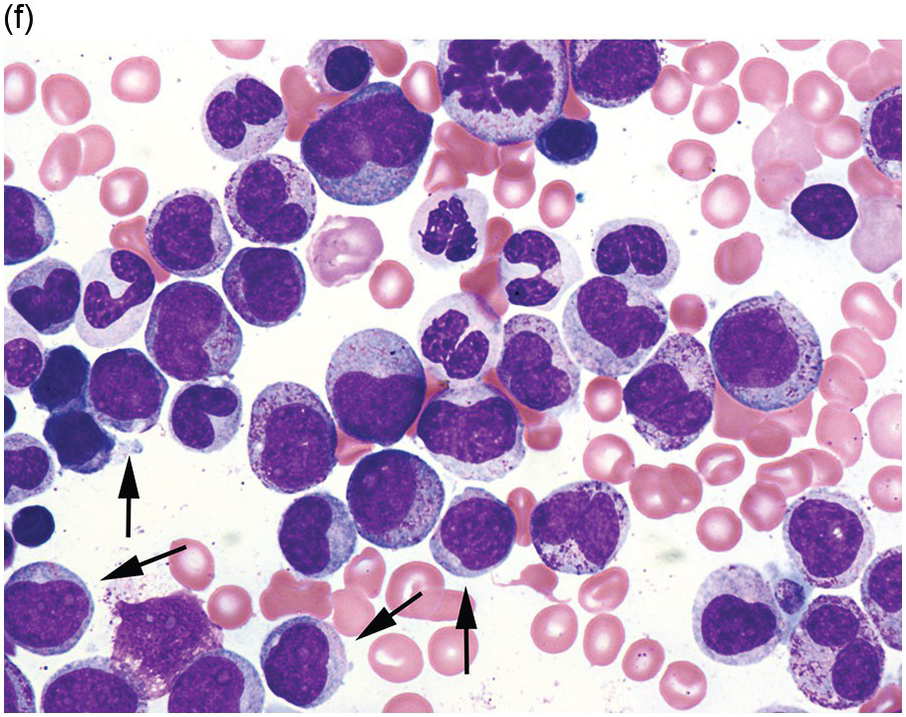
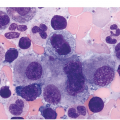
(f) MDS with excess blasts on BM aspirate, showing marked dysgranulopoiesis and several myeloblasts (arrows).
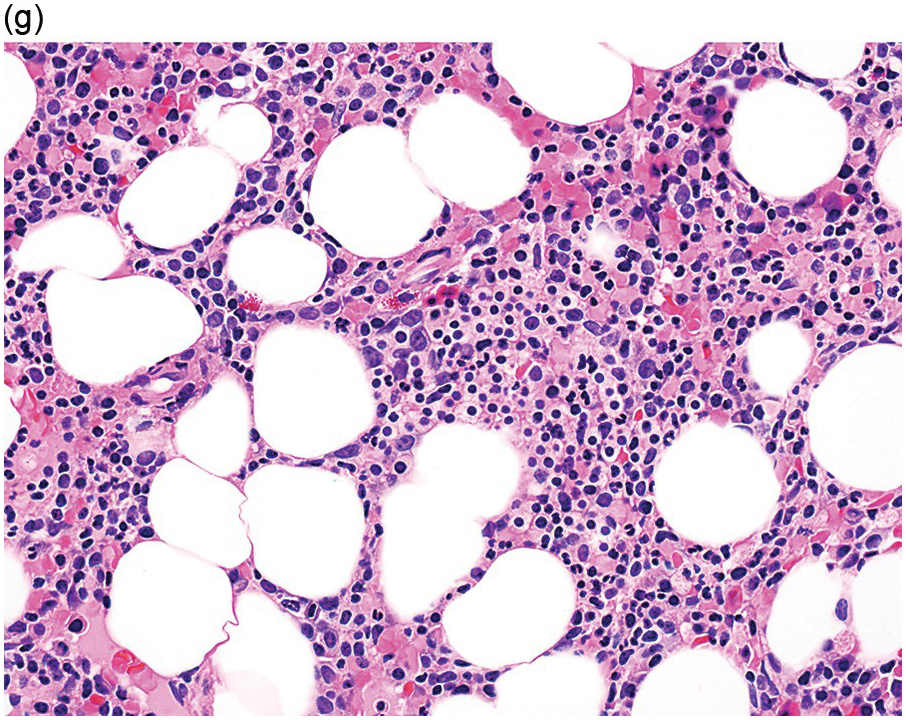
(g) MDS with excess blasts in the BMB; immature cells appear to be increased but blasts are difficult to enumerate.
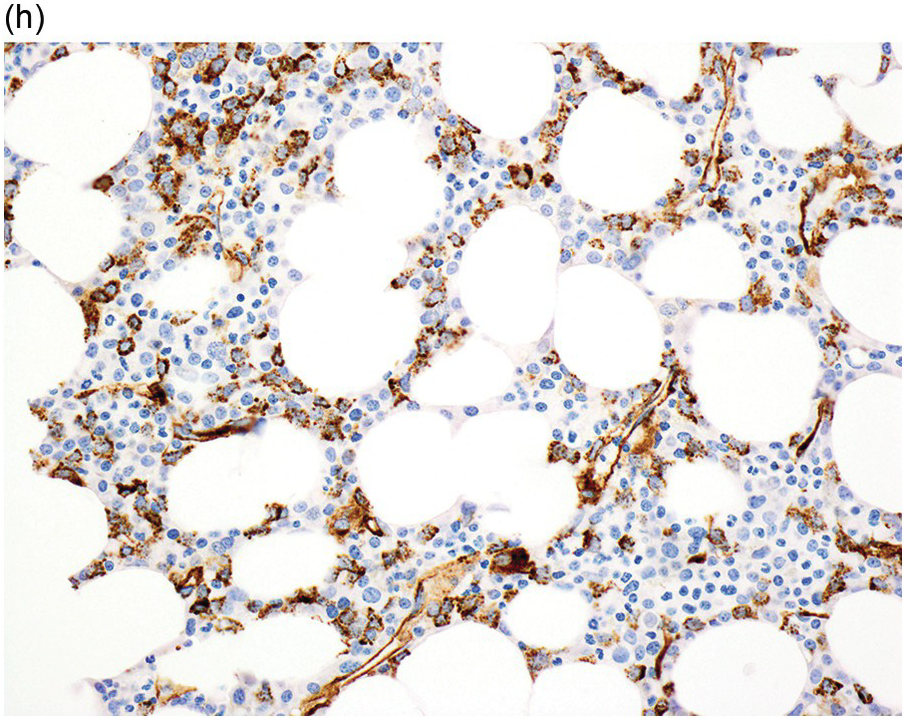
(h) A CD34 stain on the same case shows numerous myeloblasts, consistent with MDS with excess blasts-2 (MDS-EB2).
MDS with Single Lineage Dysplasia, MDS with Multilineage Dysplasia and MDS with Ring Sideroblasts
Patients with MDS with single lineage dysplasia (MDS-SLD) and MDS with multilineage dysplasia (MDS-MLD) present with <1% blasts in peripheral blood and <5% blasts in BM and no Auer rods. Ring sideroblasts account for <15% as a percentage of marrow erythroid elements, unless SF3B1 mutation is present; if an SF3B1 mutation is identified, there must be <5% ring sideroblasts. MDS-SLD shows dysplasia in one haematopoietic lineage and presents with one to two cytopaenias while MDS-MLD shows dysplasia in two to three haematopoietic lineages and presents with any number of cytopaenias. If the number of ring sideroblasts is ≥15% (or ≥5% in the presence of SF3B1 mutation), the disease is classified as MDS-RS, which is further subdivided by the amount of dysplasia, as above, into MDS-RS with single lineage dysplasia (MDS-RS-SLD) or MDS-RS with multilineage dysplasia (MDS-RS-MLD).
The prognosis of MDS-MLD is worse than that of MDS-SLD or MSD-RS-SLD, even if only one cytopaenia is present [40]. Cytogenetic abnormalities are present in approximately 50% of patients and tend to be more frequent than in MDS-SLD or MDS-RS-SLD, but there are no specific or defining cytogenetic abnormalities; however, cases with features qualifying for MDS with isolated del(5q)(see below) are excluded.
MDS with Isolated del(5q)
Myelodysplastic syndrome with isolated del(5q) is a discrete subset of MDS with a favourable prognosis. Patients present with macrocytic anaemia, usually normal or elevated platelet count, megakaryocytes with non-lobated or hypolobated nuclei, fewer than 5% BM blasts, fewer than 1% peripheral blood blasts and no Auer rods. An example of an MDS case with isolated del(5q) is shown in (Figure 8.2a). Up to two cytopaenias are allowed, but the presence of significant pancytopaenia (all counts below IPSS cytopaenic thresholds, see above) exclude the diagnosis. Other cytopaenias are less common and patients typically do not have ring sideroblasts (although the latter finding would not exclude the diagnosis). Cytogenetic abnormalities are a deletion of the long arm of chromosome 5 alone (Figure 8.2b) or with one additional abnormality, excluding loss of chromosome 7 or del(7q) [42]; there appears to be no survival difference between patients in whom del(5q) occurs alone compared to those with one additional cytogenetic abnormality [41, 42].
MDS with Excess Blasts
Myelodysplastic syndrome with excess blasts (MDS–EB) can exhibit any number of cytopaenias, any degree of morphologic dysplasia and variable cytogenetic abnormalities but manifests with excess blasts in the BM and/or blood or the presence of any Auer rods. CD34 immunostaining of the BMB may help reveal increased blasts in cases with a haemodilute or poorly stained aspirate smear; it is prudent to perform a CD34 stain and estimate blasts in the BMB in all MDS cases, in case the aspirate is non-representative [43]. CD117 also stains blasts in most MDS cases but interpretation is more difficult as this marker also stains early erythroids, promyelocytes and mast cells. MDS-EB is divided into MDS-EB1 and MDS-EB2 based on BM and blood blasts thresholds (see Table 8.1); the presence of any Auer rods mandates classification as MDS-EB2. Clonal cytogenetic abnormalities are more frequent in MDS-EB than in MDS-SLD or MDS-RS and more often show complex or high-risk karyotype abnormalities. Some cases of MDS-EB harbour an SF3B1 mutation and this mutation does not appear to convey a favourable prognosis in this context as it does for low-grade MDS subtypes.
MDS, Unclassifiable
This category includes MDS cases that would otherwise be classifiable as MDS-SLD, MDS-MLD, MDS with del(5q) or MDS-RS, but with 1% blasts in peripheral blood (measured on at least two occasions to ensure that this is not a transient finding). In addition, MDS cases that otherwise would classify as MDS-SLD or MDS-RS-SLD, but present with pancytopaenia (all three cell counts below the original IPSS cytopaenic thresholds, see above) are included in this group. Similarly, cases with cytopaenias and cytogenetic abnormalities that are considered sufficient to define MDS, but lacking sufficient (at least 10%) dysplasia in any lineage are also included in this group. Most MDS, unclassifiable (MDS-U) cases appear to fall into the latter category; in such cases, it is important to exclude other myeloid (or non-myeloid) neoplasms that may share cytogenetic abnormalities with MDS.
Paediatric MDS and Refractory Cytopaenia of Childhood
In children and adolescents, MDS are uncommon disorders, accounting for less than 5% of haematopoietic malignancy, with variable presentation and clinical course [44]. Patients tend to present with neutropaenia and thrombocytopaenia and BMB show hypocellular marrow. The distinction between MDS-EB1 and MDS-EB2 has been shown to have less clinical relevance in children [45].
About 50% of paediatric MDS cases fall into the entity refractory cytopaenia of childhood (RCC) (Figure 8.5), a provisional MDS subtype characterized by persistent cytopaenia with <5% blasts in BM and <2% blasts in peripheral blood and usually (80% of cases) a hypocellular marrow [46]. Bone marrow aspirate smears in patients with RCC show dysplastic changes that should be present in at least 10% of cells in at least one cell line, or lesser dysplastic changes in two lineages. The typical marrow cellularity is 5 to 10% and distinction from aplastic anaemia can be challenging [46]. Erythroid cells form islands consisting of at least 20 cells with an increased number of proerythroblasts and mitotic figures; ring sideroblasts are absent. Myeloid cells often appear to be decreased. Megakaryocytes are usually markedly decreased and micromegakaryocytes are a strong indicator of the diagnosis. GATA2 germline mutations are present in 7% of all primary paediatric MDS and are often associated with monosomy 7 or trisomy 8 [2].
Therapy-Related MDS
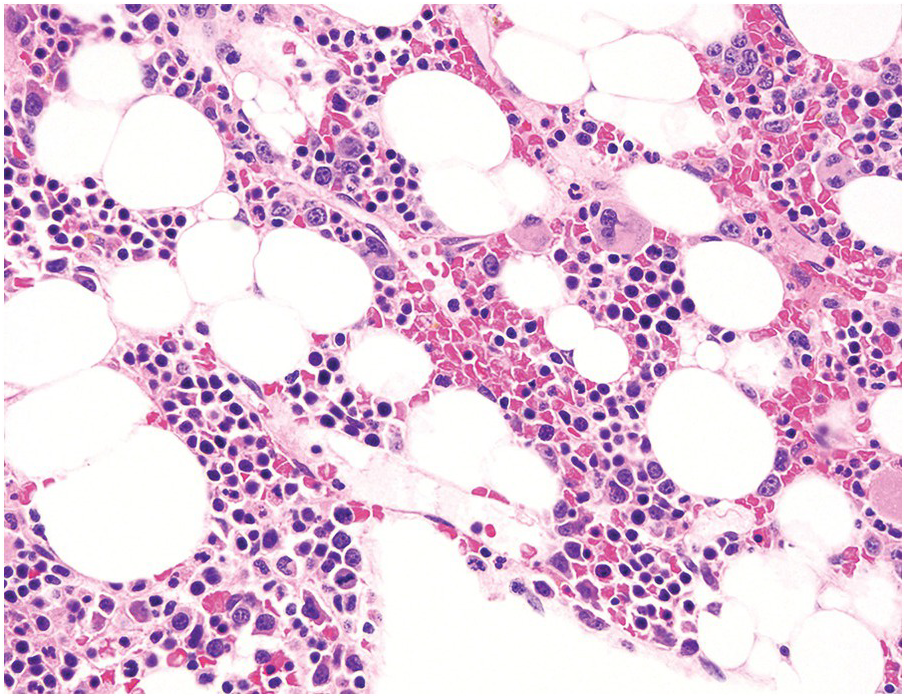
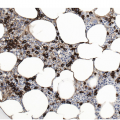
In the WHO classification, therapy-related MDS is grouped together with therapy-related AML, as these diseases tend to have a similarly poor prognosis irrespective of the blast count [12]. Therapy-related MDS occurs after exposure to chemotherapeutic agents that cause damage to DNA (alkylating agents, platinum derivatives, nitrosoureas) or after exposure to ionizing radiation. The typical latency of clinical disease is two or more years after initiation of therapy with the causative agent and peaks at five to six years. Patients present with cytopaenias and morphologic dysplasia similar to de novo MDS but with more frequent hypocellular marrow (Figure 8.6) [10]. Cytogenetic abnormalities, especially those involving chromosomes 5 and 7, are more frequent in therapy-related MDS than in de novo disease and over 90% of therapy-related MDS cases show an abnormal karyotype [12]. TP53 mutations are also much more common than in de novo MDS.
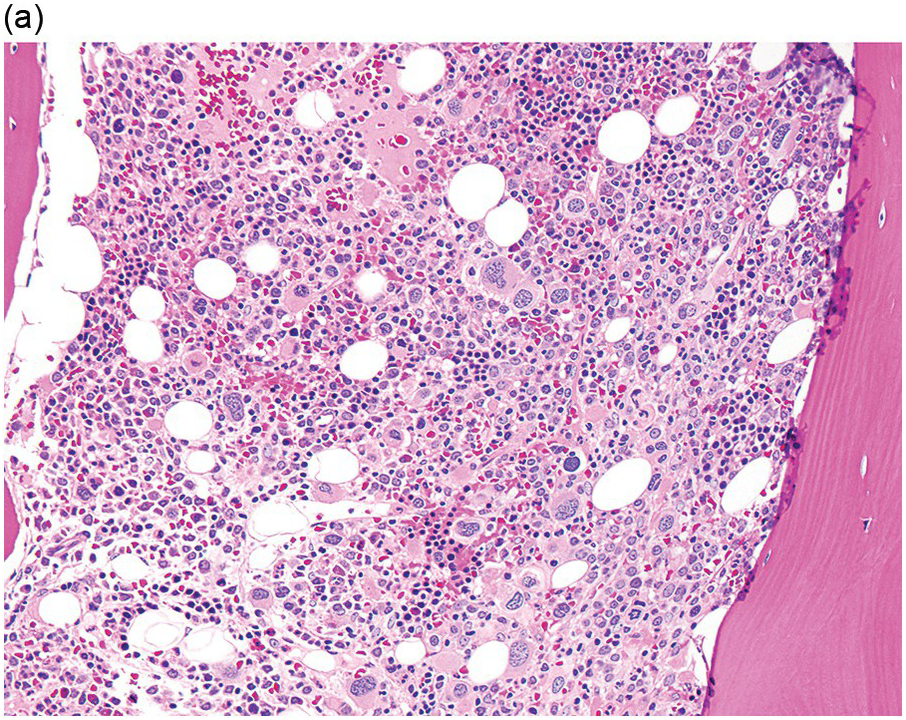
(a) The BMB is markedly hypercellular, with architectural disorganization of haematopoiesis and increased, dysplastic megakaryocytes.
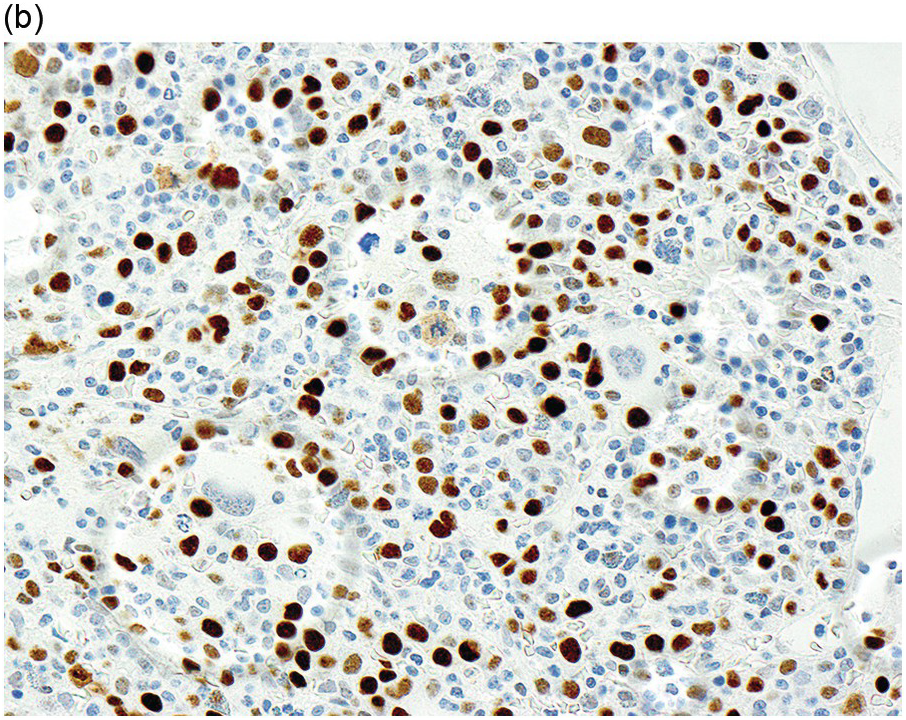
(b) Immunostaining for p53 protein shows many strongly positive cells, correlating with the presence of a TP53 mutation and a highly complex karyotype.
Immunophenotype
Blast identification in MDS is performed using the classical combination of CD45dim and low SSC gating strategy [47] and myeloblasts can be enumerated by flow cytometry based on their light scatter qualities, dim CD45 staining and CD34 positivity. The recommended antibody combinations include CD45, CD34, CD117, HLA-DR and CD123 to distinguish myeloid progenitor cells from other populations, such as B-cell precursors, monoblasts, basophils, erythroblasts and plasmacytoid dendritic cell precursors, which might show overlapping CD45 and SSC features [47]. The number of blasts varies between flow cytometry versus direct counts on the aspirate smear, with flow cytometry usually yielding higher counts. However, flow cytometric assessment of blasts is not recommended as it can be affected by peripheral blood dilution of the sample.
The most widely recognized aberrancies in blasts in MDS include an abnormal intensity or lack of expression of CD45, CD34, CD117, HLA-DR, CD13 or CD33; asynchronous presence of CD11b or CD15; and the expression of lineage infidelity markers, such as CD5, CD7, CD19 or CD56 [48]. Aberrant lymphoid marker expression in myeloid blasts is associated with poorer prognosis; patients with this expression are more likely to display resistance to treatment with hypomethylating agents and are more dependent on blood transfusions [47]. A decrease in B-cell progenitor cells (haematogones) is frequently observed in MDS [49–51]. These cells can be identified within the blast gate by their CD34+CD19+ or CD34+CD10+ immunophenotype. Flow cytometry immunophenotyping studies have also identified aberrations in maturing compartments among different BM haematopoietic cell lineages. One of the most frequently reported aberrancies in the maturing myeloid cells is an abnormally decreased SSC reflecting hypogranularity, a well-known phenomenon in MDS [52]. Myeloid cells can show low CD16 or CD11b expression as well as abnormal maturation pattern on CD13 versus CD16 plots [53]. In addition, aberrancies in the expression of CD64, CD10 and CD56 have been described in myeloid cells. An example of an MDS case with increased blasts (MDS-EB1) showing myeloid cells with decreased side scatter, absent CD10 expression and abnormal maturation on CD13 versus CD16 is shown in Figure 8.7. Monocytes can show abnormal expression of CD2, CD56, HLA-DR, CD36, CD33, CD15, CD14, CD13 and CD11b antigens [53].
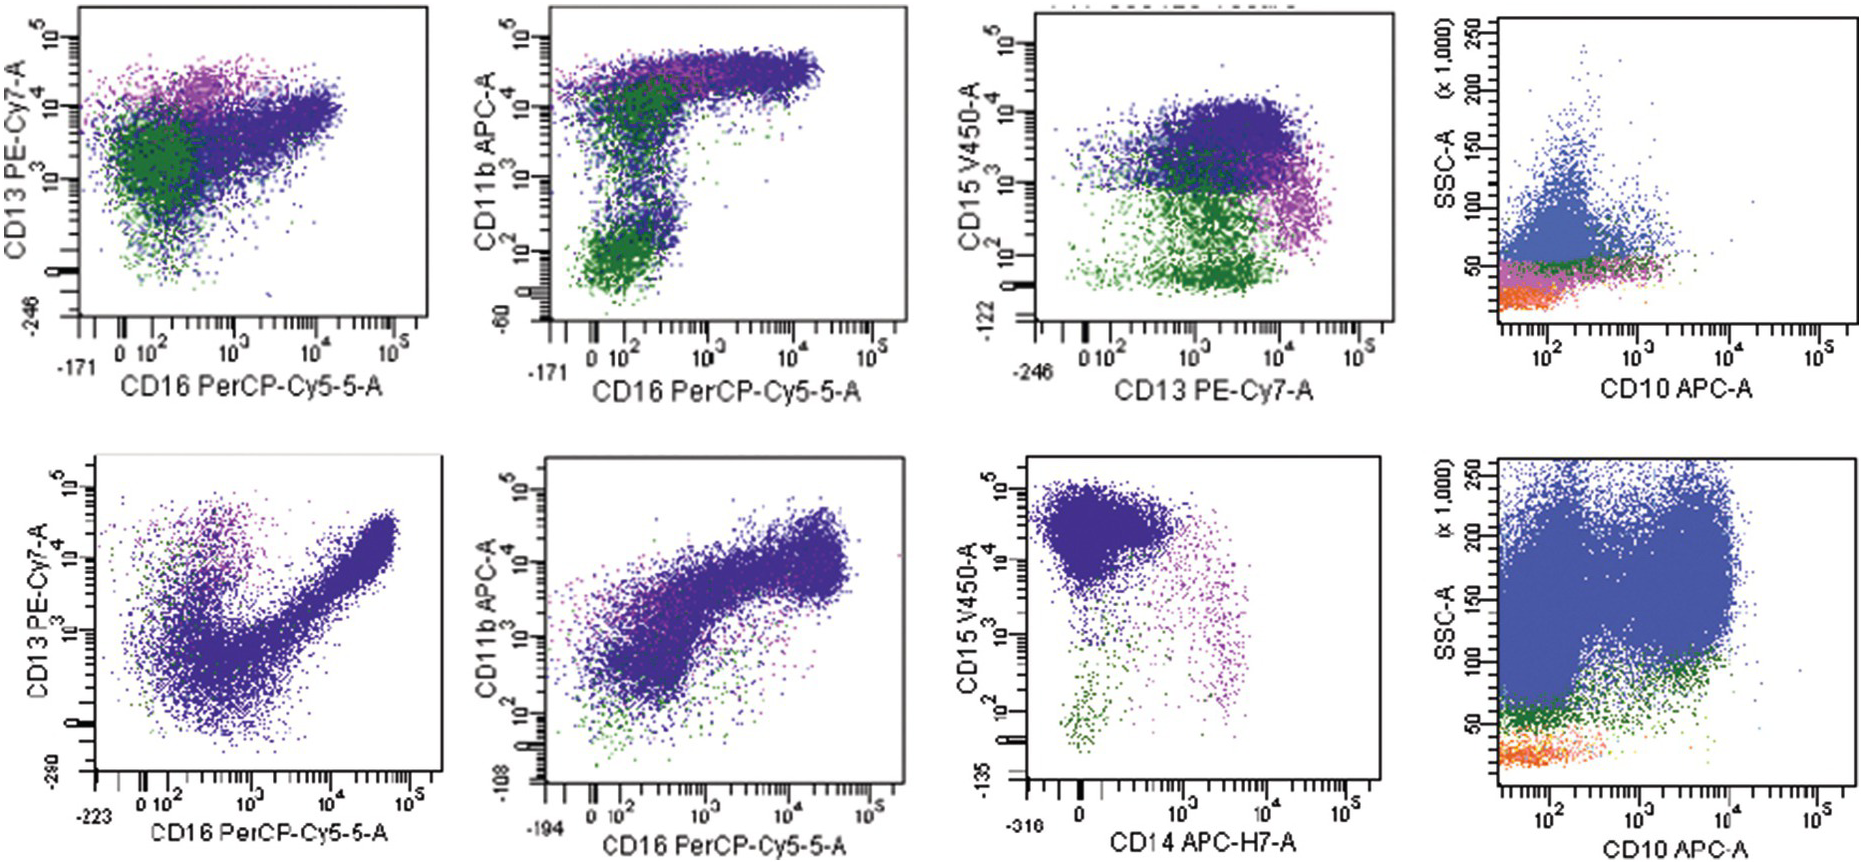
Figure 8.7 Example of an MDS flow cytometry case with immunophenotypic abnormalities typical of MDS (top row) compared to normal BM (bottom row). Maturing myeloid cells (population in blue) show decreased side scatter and diminished CD10 expression. The maturation myeloid patterns as seen on CD13 versus CD16 and CD11b versus CD16 plots are abnormal as compared with normal patterns seen in the plots below. CD15 is abnormally dim as compared with normal case below.
Although no single immunophenotypic parameter has been proven to be diagnostic of MDS, combinations of such parameters into scoring systems have been shown to discriminate MDS from other cytopaenias with high sensitivity and specificity [54]. Studies have also shown that abnormalities detected by flow cytometry in MDS can predict prognosis independent of other known risk factors [52–55] and they have been shown to predict response to certain therapies, such as growth factors and hypomethylating agents [58, 59]. Overall, flow cytometry immunophenotyping in suspected MDS cases is best considered as a helpful adjunctive test that can be used to support a diagnosis of MDS suspected on morphology and clinical features [56, 57, 60]. Conversely, normal flow cytometry findings can prompt more careful investigations for non-MDS causes of cytopaenia. However, flow cytometry findings alone should not be used to make a definitive diagnosis of MDS if other criteria are lacking, nor should a negative flow cytometry result be used to absolutely exclude the possibility of MDS.
Differential Diagnosis and Work-Up
The differential diagnosis between low-grade MDS and the various non-neoplastic causes of cytopaenia can be very challenging. One of the most important distinctions is to differentiate between MDS and nutritional deficiencies, including vitamin B12 (cobalamin) and folate [61]. Vitamin B12 deficiency can produce severe pancytopaenia and striking megaloblastoid maturational changes with only minimal neurological symptoms. Similarly, folate deficiency can also present with a macrocytic anaemia, cytopaenias and megaloblastoid maturation and should also be excluded in suspected MDS [61]. Copper deficiency and zinc toxicity (which causes copper deficiency) can present with pancytopaenia and dysplastic marrow morphology, closely mimicking MDS [62, 63]. Vacuolization of erythroid precursors may be prominent, as well as vacuolated granulocyte precursors and neutropaenia. Premature infants, those with prolonged parenteral hyperalimentation, malnourished individuals or patients undergoing copper chelation therapy are most likely to manifest cytopaenias due to copper deficiency.
Various toxins can cause cytopaenias and dysplastic changes that can be mistaken for MDS. These include alcohol and arsenic [64, 65] as well as numerous drugs, including methotrexate, azathioprine and chemotherapeutic agents [29]. Viruses, including human immunodeficiency virus (HIV), can induce cytopaenias and the latter is associated with both dyserythropoiesis as well as small megakaryocytes. Autoimmune diseases including rheumatoid arthritis and systemic lupus erythematosus can be associated with marrow inflammation, dysplastic haematopoietic maturation and cytopaenias. Felty syndrome and idiopathic thrombocytopaenia purpura, which are associated with neutropaenia and thrombocytopaenia, can mimic MDS. Close attention to the patient’s clinical and medication history is essential whenever approaching a potential diagnosis of MDS in a cytopaenic patient. In addition, there are several rare inherited conditions that can mimic MDS, such as congenital dyserythropoietic or sideroblastic anaemias, which should be considered in cases with a family history of anaemia. Ring sideroblasts may be seen in alcohol consumption, copper deficiency, zinc excess, as well as rare congenital conditions such as X-linked recessive sideroblastic anaemia [66]. Other neoplasms can produce reactive dysplastic changes in marrow haematopoietic elements and include plasma cell myeloma and some BM lymphomas, such as hairy cell leukaemia.
Many chemotherapy agents induce dysplastic morphology as well as causing peripheral blood cytopaenias and may mimic MDS. The most striking megaloblastic changes are seen with folate antagonists (e.g. methotrexate) and drugs that directly interfere with DNA synthesis (e.g. antimetabolites such as hydroxyurea and 5-fluorouracil) [61]. After an acute marrow injury (such as induced by chemotherapy, toxin or infection), there may be transient dysplastic changes, especially in the erythroid and occasionally megakaryocytic lineages, and even a transient increase in blood or BM blasts. Identification of left-shifted myeloid forms and toxic granulation in the blood can be helpful clues to appropriate marrow as myeloid cells in MDS are often hypogranulated, but only seldom show toxic granulation. Similar changes may be seen at the time of donor marrow engraftment following myeloablative stem-cell transplant (SCT). Macrocytosis and mild megaloblastoid change are also often seen after SCT and may persist for months or years. This phenomenon can complicate the morphologic interpretation of post-SCT BM samples and megaloblastic changes should not be overinterpreted as evidence of new or persistent MDS in this context [67].
Several designations have been developed to encompass patients who have some of the features of MDS (cytopaenia, dysplasia and/or evidence of clonal haematopoiesis) but do not meet strict criteria for any haematologic neoplasm (Table 8.2). Patients who have cytopaenia of unknown aetiology without morphologic or cytogenetic evidence of MDS have been labelled as having ‘idiopathic cytopaenia of undetermined significance’ (ICUS) [68]. The cytopaenia has to be persistent (≥4 months) and must lack minimal diagnostic criteria needed to diagnose MDS or any other haematologic disease in a BM sample [65]. A BM examination is required to diagnose ICUS, since there must be documented absence of significant dysplasia in any lineage and also absence of an MDS-associated cytogenetic abnormality on a complete BM karyotype. It is recommended that patients with ICUS be followed with periodic blood counts and a repeat BM examination should be performed if the cytopaenias worsen significantly and remain unexplained. Over time, some ICUS patients will develop bona fide MDS or another myeloid neoplasm [68]. ‘Clonal haematopoiesis of indeterminate potential’ (CHIP) is used to describe individuals with normal blood counts who have a clonal mutation (present at >2% variant allele frequency) in a gene associated with haematologic neoplasia, yet do not meet morphologic or cytogenetic criteria for a haematologic neoplasm [69]. The incidence of CHIP is estimated at approximately 5 to 10% in individuals over 65 or 70 and up to 18.4% in individuals over 90; it is rare in those under 40. Individuals with CHIP appear to be at a modestly increased risk of developing a subsequent haematologic malignancy compared to age-matched controls without CHIP, but this is only approximately 0.5 to 1% per year. These patients are also at increased risk of death from non-haematologic causes, particularly cardiovascular disease [70]. The term ‘clonal cytopaenia of undetermined significance’ (CCUS) essentially describes patients with features of both ICUS and CHIP, who have unexplained cytopaenias and are also found to have a clonal mutation. Finally, the condition of BM dysplasia with absent cytopaenias has been labelled by some as ‘idiopathic dysplasia of undetermined significance’ or IDUS [68]. It is important to consider other myeloid and non-myeloid neoplasms, particularly MDS/MPN overlap diseases that may manifest dysplasia but lack significant cytopaenia, as well as other reactive secondary causes of dysplasia (discussed above) [71, 72].
Table 8.2 Features of myelodysplastic syndrome (MDS) compared to other conditions of abnormal haematopoiesis.
Related posts:
Stay updated, free articles. Join our Telegram channel

Full access? Get Clinical Tree


