Traditional and newer agents used to treat cancer can cause significant toxicity to the central nervous system. MRI of the brain and spine is the imaging modality of choice for patients with cancer who develop neurologic symptoms. It is important to be aware of the agents that can cause neurotoxicity and their associated imaging findings so that patients are properly diagnosed and treated. In some instances conventional MRI may not be able to differentiate posttreatment effects from disease progression. In these instances advanced imaging techniques may be helpful, although further research is still needed.
Key points
- •
Neurotoxicity related to cancer treatment is increasing in frequency related to improvements in cancer treatment and patients surviving longer.
- •
Neurotoxicity is a widely recognized adverse effect of cancer treatment and can result from radiation therapy, traditional chemotherapeutic agents, and newer biologic and immunotherapeutic agents used to treat cancer.
- •
MRI is the main imaging modality used to assess patients with cancer with new symptoms referable to the CNS.
- •
CNS complications of oncologic treatment can have variable imaging appearances and in some cases mimic cancer progression or recurrence.
Introduction
Neurotoxicity is a widely recognized adverse effect of cancer treatment and can result from radiation therapy (RT), traditional chemotherapeutic agents, and newer biologic and immunotherapeutic agents used to treat cancer. Although the exact incidence of treatment-related neurotoxicity is unknown, its frequency is thought to be increasing. Higher doses of chemotherapeutic agents are being administered because of advances in supportive care, with escalating doses resulting in neurotoxicity. Additionally, improvements in cancer treatment have led to patients with cancer living longer. Thus, treatment-related neurotoxicity with a long latency between treatment and symptom onset is increasingly recognized. After myelosuppression, neurotoxicity is the most common dose-limiting factor of cancer treatment. It was once thought that the blood-brain and blood-cerebrospinal fluid barriers and the nondividing central nervous system (CNS) cells would protect the CNS from the toxic effects of RT and chemotherapy. However, it is now known that the CNS contains stem cells that replenish some neuron populations and that glial cells do divide. Although the pathophysiologic mechanisms are not fully known, traditional chemotherapeutic agents and RT can directly damage neural structures and cause indirect damage through injury to the vasculature. Newer immune and biologic agents can affect the CNS through a heightened immune response or cross reactivity with nervous system cells. When patients with cancer develop new neurologic symptoms it is important to distinguish symptoms related to the cancer itself from those related to other causes, such as paraneoplastic syndromes, infection, or treatment-related toxicity. Although attributing symptoms to neurotoxicity is generally a diagnosis of exclusion, it is important to recognize so that further injury is prevented by dose adjustment or treatment cessation. MRI is the main imaging modality used to assess patients with cancer with new symptoms referable to the CNS. It is important to be aware of the common neurotoxic syndromes that can occur as a result of cancer treatment, the agents responsible for them, and the imaging findings to allow prompt diagnosis.
Radiation-induced central nervous system complications
RT to the brain and spinal cord is used to treat a variety of primary and metastatic tumors and may be administered prophylactically to prevent the development of metastases. The brain may also be included in the RT port of patients with other cancers, notably head and neck cancers. Injury to the CNS can occur after whole brain RT, involved field RT, or focal RT, such as stereotactic radiosurgery and brachytherapy. Radiation can directly affect the CNS or indirectly induce vasculopathy, endocrinopathy, or carcinogenesis. Risk factors associated with radiation-induced injury include energy of radiation, total dose, fraction size, time between fractions, treatment volume, and previous or concurrent chemotherapy. Patient-specific factors, including age, sex, genetic predisposition, pre-existing CNS damage, systemic disease, and lifestyle choice, also impact the risk of radiation-induced injury.
Radiation injury to the brain is typically classified into three phases based on the time of onset after radiation. Acute injury occurs during or shortly after radiation, subacute or early delayed injury occurs weeks to months after radiation, and late-delayed occurs months to years after radiation.
Acute injury presents clinically with headache, nausea, vomiting, lethargy, and worsening of pre-existing neurologic symptoms. This is most commonly seen following large fractions (>3 Gy) delivered to large brain volumes in patients with increased intracranial pressure. The pathogenesis is likely related to disruption of the blood-brain barrier by endothelial apoptosis leading to increased edema and possibly an increase in intracranial pressure. The incidence and severity of this type of injury has decreased with prophylactic steroid use, surgical debulking, and careful treatment planning with conventional fractionation (1.8–2 Gy per fraction) and the symptoms are usually reversible. Although acute brain swelling has been reported, typically no computed tomography (CT) or MRI findings are present with this type of injury.
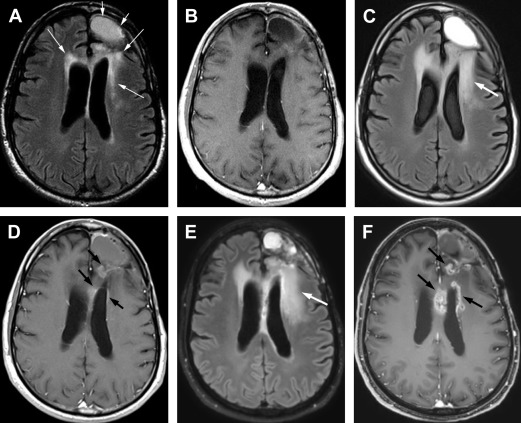
In patients receiving RT for high-grade gliomas, particularly in combination with temozolamide (Temodar), a temporary increase in brain edema and enhancement in the RT treatment volume can occur that is believed to be an early delayed effect of treatment. This usually occurs on the first MRI done within 2 to 3 months after treatment and has been termed “pseudoprogression,” because the imaging findings mimic tumor progression on MRI, but stabilize or improve spontaneously over the following 4 to 6 months ( Fig. 1 ). Thus pseudoprogression is a clinical diagnosis, not a pathologic one. Overall it is currently estimated that 50% of patients with high-grade gliomas have early posttherapy MRI findings concerning for progressive disease; approximately 40% of these changes (or 20% of all patients with high-grade glioma) are caused by pseudoprogression. Patients with methylated O6-methyl guanine-DNA methyltransferase are twice as likely to manifest pseudoprogression in comparison with patients with nonmethylated O6-methyl guanine-DNA methyltransferase. Pseudoprogression is less likely to be associated with clinical symptoms than early progression. Approximately one-third of patients with pseudoprogression have symptoms compared with 50% to 67% of patients with early progression. The pathophysiology is not fully understood but may relate to killing of tumor cells and endothelial cells leading to abnormal vessel permeability and edema. Additionally, in patients who have undergone biopsy for progressive changes in the first 6 months after combined chemoradiotherapy with temozolamide a high incidence of necrosis has been reported.
Conventional MRI techniques cannot reliably differentiate pseudoprogression from true early progression. A recent study indicated that subependymal enhancement on the initial post-RT MRI was the only conventional MRI feature predictive for early progression, but the negative predictive value was only 41%. Other features including various patterns of enhancement, increasing peritumoral T2 abnormality, cystic or necrotic change, and restricted diffusion had no predictive value. Advanced imaging techniques, such as MR spectroscopy, diffusion-weighted imaging, and MR perfusion imaging, are being investigated to differentiate pseudoprogression from early progression ( Table 1 ). These techniques have shown promise but further prospective studies are needed for validation. Similar progression of imaging findings can occur in a one-third to one-half of patients treated with radiosurgery for brain metastases. The increase in lesion size can begin at 6 weeks postradiosurgery and last for up to 15 months. A recent study evaluated 67 patients who underwent radiosurgery for brain metastases followed by histopathologic evaluation via biopsy or surgery in the setting of imaging findings concerning for disease progression versus radiation change. A total of 28% of patients had only necrosis on pathology, 11% had mixed necrosis and viable tumor, 60% had tumor progression, and 2% were indeterminate. There were no MRI criteria that could distinguish among these entities.
| Technique | Supporting Studies | Findings Associated with PD (Compared with RI) | Limitations |
|---|---|---|---|
| Diffusion-weighted MRI | Lower mean ADC values and ADC ratios | Overlap between recurrence and radiation change; ADC value dependent on sampling method | |
| MR perfusion | Higher rCBV | Overlap between recurrence and radiation change; rCBV cutoff values vary by study, technique; vascular leak problematic | |
| MR spectroscopy | Higher choline/creatine and choline/ N -acetylaspartate | Overlap between recurrence and radiation change; cutoff values vary by study; problems when both recurrence and postradiation change present |
Late-delayed radiation injury manifests as radiation necrosis or diffuse leukoencephalopathy. Radiation necrosis occurs following external beam RT or radiosurgery for primary and metastatic brain tumors. It may also occur in patients with extracranial tumors, particularly head and neck cancers, where the brain is included in the radiation field. The incidence varies from 5% to 24% for metastatic tumors and is approximately 5% for primary brain tumors. Symptoms include focal neurologic deficit, seizure, headache, and cognitive impairment and may mimic those of the original tumor. Direct injury to the vasculature and to neuronal and glial structures has been implicated in the pathology of radiation necrosis. Rim-enhancing or nodular-enhancing lesions with varying degrees of surrounding hyperintensity on T2-weighted and fluid-attenuated inversion recovery (FLAIR) images and mass effect are seen on MRI, often at the site of the previous tumor. Cystic changes may also be seen and are thought to reflect late stages of tissue necrosis ( Fig. 2 ). Imaging findings of necrosis are not readily distinguishable from those of recurrent tumor. As with pseudoprogression, advance imaging techniques, such as MR spectroscopy, diffusion-weighted imaging, and MR perfusion, may help in differentiating radiation necrosis from tumor, but biopsy remains the gold standard.
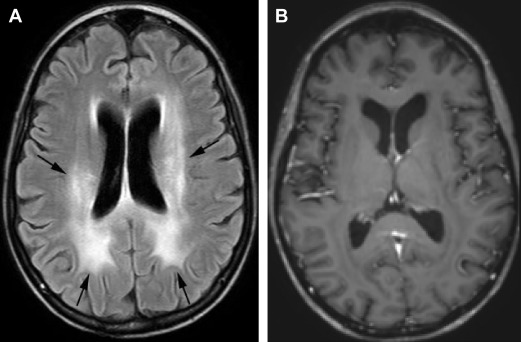
Leukoencephalopathy with brain volume loss is the other common late-delayed effect of radiation, often following whole brain radiation for therapy or prophylaxis. Concomitant chemotherapy can enhance the process and intensify clinical and radiographic severity. Patients typically have cognitive deficits consisting of impairments in learning, memory, executive function, attention, and concentration. Less commonly patients may have dementia, gait abnormalities, and urinary incontinence. The underlying pathophysiology is not fully known but may relate to direct damage to neurons and neuron precursors, demyelination, and impairments in hippocampal neurogenesis. On MRI there are symmetric, confluent white matter hyperintensities on T2-weighted and FLAIR images without enhancement. There is often associated atrophy with enlarged sulci and ventricles ( Fig. 3 ).
Radiation to the spine or spinal cord can result in toxicity that presents as an early delayed or late-delayed myelopathy. Patients with early delayed myelopathy typically present 2 to 4 months after radiation with Lhermitte sign, a nonpainful, unpleasant electric shock-like sensation that shoots down the spine during neck flexion. MRI is usually normal in these patients and symptoms usually completely resolve. With late-delayed myelopathy symptoms can vary from minor motor and sensory deficits to a Brown-Séquard syndrome. Disruption of blood–spinal cord barrier leads to edema and demyelination that may progress to necrosis. Damage to the vasculature also occurs. Acutely, MRI may be normal or show swelling, hyperintensity on T2-weighted images, and enhancement that is often patchy. In later stages the cord appears atrophic. Identification of hyperintensity in the vertebral bodies on T1-weighted MRIs often helps to outline the radiation portal. Over time atrophy of the cord can develop ( Fig. 4 ).
Radiation to the brain can also result in indirect injury to the CNS through radiation-induced vasculopathy or tumors. Cavernous malformations can develop in the CNS after RT and are more common in children and males. The latency period can range from 2 to 10 years or more after radiation. They can lead to hemorrhage or seizures, although most are asymptomatic. On MRI they have a variable appearance because of the nature of hemoglobin breakdown products. Centrally they may have heterogeneous signal with a hypointense rim on T2-weighted images or may be hypointense on all sequences. Additional lesions may be seen on gradient echo sequences or susceptibility-weighted sequences as hypointense foci, presumably related to prior hemorrhage ( Fig. 5 ). Large vessel vasculopathy can also develop related to intimal proliferation, thrombosis, and accelerated atherosclerosis. The latency period ranges from 4 months to 20 years. The common and internal carotid arteries are the most vulnerable vessel of neurologic interest. CT angiography, MR angiography, or catheter angiography can be used to diagnose vessel narrowing. The diagnosis of RT-induced stenosis or occlusion is suggested when the carotid artery was included in the RT field and the site of stenosis is different from its usual location at the carotid bifurcation in nonirradiated patients. Stenotic lesions tend to be longer after RT and the maximum stenosis is often at the end of the stenotic area ( Fig. 6 ). Multiple moyamoya-like collaterals may be seen, particularly if the intracranial arteries are involved ( Fig. 7 ). Mineralizing microangiopathy is a frequent finding in children treated with RT and is caused by the deposition of calcium within small vessels of the irradiated brain parenchyma. It usually occurs in conjunction with chemotherapy, but may occur after RT alone. The relationship to clinical symptoms is unclear. It is best seen on CT as multiple, punctate calcifications that most frequently involve the basal ganglia and less commonly the cortex or brainstem ( Fig. 8 ). Finally, neoplasms can develop as a consequence of RT to the CNS. These tumors probably result from radiation damage to DNA with abnormal repair, with biologic variables also playing a role. This is a particular problem in children who are more susceptible and have longer survival after treatment of their initial neoplasm. The latency period is generally many years after initial radiation. In adults meningiomas are the commonest radiation-induced tumor followed by sarcomas and gliomas. In children malignant gliomas are more common followed by meningiomas, low-grade astrocytomas, and sarcomas. The imaging appearance of these tumors does not differ from those not associated with radiation. However, radiation-induced meningiomas are more likely to be atypical or anaplastic, occur in younger patients, have a more equal gender distribution, and have a tendency for multiplicity and recurrence than those that are not radiation-induced ( Fig. 9 ).
Related posts:
 Neurologic Manifestations of Blood Dyscrasias
Central Nervous System Complications of Hemorrhagic and Coagulation Disorders
Central Nervous System Complications of Hematopoietic Stem Cell Transplant
Imaging of Spinal Manifestations of Hematological Disorders
Imaging Manifestations of Neurologic Complications in Anemia
Central Nervous System Complications of Oncologic Therapy
Neurologic Manifestations of Blood Dyscrasias
Central Nervous System Complications of Hemorrhagic and Coagulation Disorders
Central Nervous System Complications of Hematopoietic Stem Cell Transplant
Imaging of Spinal Manifestations of Hematological Disorders
Imaging Manifestations of Neurologic Complications in Anemia
Central Nervous System Complications of Oncologic Therapy
Stay updated, free articles. Join our Telegram channel

Full access? Get Clinical Tree


