Incidence (annual rate per 100,000)
Entity
Prevalence (per 100,000)
>50
Epithelial tumours of the breast
594
Epithelial tumours of the lung
85
>20–50
Epithelial tumours of the skin
474
Epithelial tumours of the prostate
474
Epithelial tumours of the colon
233
Lymphoid diseases
172
Epithelial tumours of the bladder
133
>10–20
Epithelial tumours of the stomach
46
Epithelial tumours of the rectum
102
Malignant skin melanoma
135
Epithelial tumours of the pancreas
8
Epithelial tumours of the kidney
65
Epithelial tumours of the corpus uteri
100
>7–10
Epithelial tumours of the ovary and fallopian tube
48
Epithelial tumours of the oesophagus
8
>6–7
Epithelial tumours of the hypopharynx and larynx
36
Epithelial tumours liver and intrahepatic bile tract (IBT)
9
Epithelial tumours of the cervix uteri
58
Tumours of central nervous system (including embryonal CNS tumours and meningiomas)
34
>4–5
Epithelial tumours of the oral cavity and lip
29
Soft tissue sarcoma
43
Epithelial tumours gallbladder and extrahepatic biliary duct
7
Carcinomas of endocrine organs
41
>2–4
Acute myeloid leukaemia and related precursor neoplasms
8
Tumours of the testis and paratestis
43
Myeloproliferative neoplasms
29
Epithelial tumours of the oropharynx
12
Neuroendocrine tumours
19
>1–2
Epithelial tumours of the vulva and vagina
13
Malignant mesothelioma
3
Epithelial tumours of the pelvis ureter and urethra
10
Myelodysplastic syndrome
4
Epithelial tumours major salivary glands and salivary gland type tumours
10
Epithelial tumours of the anal canal
7
≤1
Bone sarcoma
6
Epithelial tumours of the small intestine
2
Malignant melanoma of the uvea
5
Epithelial tumours of the penis
5
Malignant melanoma of the mucosa
2
Epithelial tumours of the nasopharynx
2
Epithelial tumours of the nasal cavity and sinuses
2
Non-epithelial tumours of the ovary
3
Kaposi sarcoma
2
Embryonal neoplasms
4
Myelodysplastic myeloproliferative diseases
1
Adnexal carcinomas of the skin
3
Epithelial tumours of the thymus
1
Epithelial tumours of the eye and adnexa
1
Epithelial tumours of the trachea
<1
Extragonadic germ cell tumours
2
Gastrointestinal stromal sarcoma (GIST)
<1
Histiocytic and dendritic cell neoplasms
<1
Epithelial tumours of the middle ear
<1
Trophoblastic tumours of the placenta
<1
The RARECARE list was hierarchically organised into three tiers. The first tier is based on patient referral purposes, i.e. it is relevant under the health-care organisation perspective. The second tier groups provide a list of cancer entities distinct with respect to clinical management and clinical research targets. The third tier includes all pathologically distinct entities defined by the WHO blue book entities. An example of this organisation is reported in Table 2.
Table 2
The three-tier structure of the RARECARE list of cancers illustrated for epithelial cancers of the anal canal
Tier | Name |
|---|---|
First | Epithelial tumours of anal canal |
Second | Squamous cell carcinoma and variants of anal canal |
Third | Verrucous carcinoma |
Third | Undifferentiated carcinoma |
Third | Basaloid carcinoma of anal canal |
Second | Adenocarcinoma and variants of anal canal |
First | Mucinous adenocarcinoma |
Second | Paget disease of anal canal |
As a final step, RARECARE defined rare cancers as those with an incidence of <6/100,000/year, corresponding to <30,000 new cases/year in Europe. A total of about 200 cancers were recognised as rare according to this definition.
In Europe rare cancers are officially defined according to the prevalence criterion (<50/100,000), in the same way as rare diseases in general. However, prevalence has shortcomings as a measure of cancer rarity since some cancers with low incidence but good survival fall into the common cancer category as good survival pushes up prevalence; examples are squamous cell carcinoma of the uterine cervix and thyroid carcinoma. Similarly, some commonly occurring diseases for which survival is poor are considered rare because poor survival pushes prevalence down. Examples are adenocarcinoma of the stomach and lung and squamous cell carcinoma of the lung. These considerations suggest that incidence is better for defining rare cancers and is also in harmony with the sub-acute clinical course of most rare cancers, whereas most rare non-neoplastic diseases have a chronic course better measured by prevalence indicator. The RARECARE rarity threshold at <6/100,000 is of course arbitrary and was selected by pragmatic considerations. For example, a lower threshold of <3/100,000/year would be considered as common epithelial cancers of the oral cavity and lip, epithelial cancer of the oropharynx, epithelial cancers of the larynx, epithelial tumour of the gallbladder, soft tissue sarcomas, tumours of the testis and paratestis, carcinomas of the thyroid tumour of central nervous system, neuroendocrine tumours, myeloproliferative neoplasms and acute myeloid leukaemia. Yet these forms present all the characteristics of rare cancers, being often inadequately diagnosed and treated in relation both to lack of knowledge and lack of clinical expertise, clinical trials are rarely performed. They are best treated in specialised centres. Thus, the <6/100,000 threshold was selected to include all the forms with the problems typically present in rare cancers.
3 The Burden of Rare Cancers
In Europe, based on the above definition (incidence <6/100,000/year), 22 % of all cancers diagnosed in the EU27 each year are rare. In absolute terms, this is slightly more than half a million new rare cancer cases each year. About 4,300,000 patients are living today in the European Union with a diagnosis of a rare cancer, 24 % of the total cancer prevalence. Essentially, all childhood cancers and most cancers (sarcomas and lymphomas) in persons aged up to 39 years were rare. From age 40 on, the common cancers (breast, prostate, colon, rectum and lung) became increasingly prominent. Average age at diagnosis was 60 years for rare cancers and 67 for common cancers.
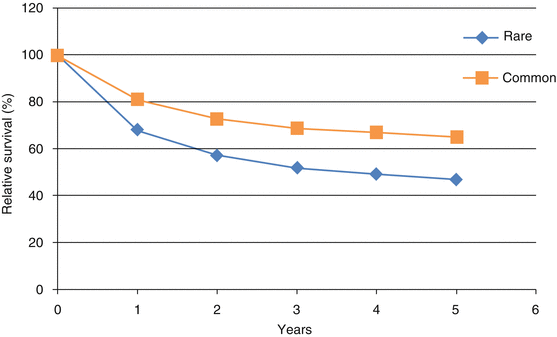
Rare cancers had, on average, worse relative survival than common cancers. Five-year relative survival was 47 and 65 % (Fig. 1) for rare and common cancers, respectively. Survival differences between rare and common cancers were small 1 year after diagnosis, but survival for rare cancers declined more markedly thereafter, suggesting that less effective treatment, and not later stage at diagnosis, is the main determinant of the poorer survival for rare cancers. Five-year survival was similarly high for both rare and common cancers in children and young adults (up to 39 years), but survival for rare cancers fell increasingly behind that of common cancers as age of diagnosis increased. Most cancers in children and young adults were rare embryonal or haematological types, for which effective treatments are available. In older patients, most of the rare cancers were rare epithelial forms, for which therapies are not as effective as for the rare paediatric cancers.


