Cancer Screening


Cancer Screening


Otis W. Brawley

Howard L. Parnes


INTRODUCTION

Cancer screening refers to a test or examination performed on an asymptomatic individual. The goal is not simply to find cancer at an early stage, nor is it to diagnose as many patients with cancer as possible. The goal of cancer screening is to prevent death and suffering from the disease in question through early therapeutic intervention.

The assumption that early detection improves outcomes can be traced back to the concept that cancer inexorably progresses from a small, localized, primary tumor to local-regional spread, to distant metastases and death. This linear model of disease progression predicts that early intervention would reduce cancer mortality.

Cancer screening was an element of the “periodic physical examination,” as espoused by the American Medical Association in the 1920s.1 It consisted of palpation to find a mass or enlarged lymph nodes and auscultation to find a rub or abnormal sound. Today, screening has grown to include radiologic testing, the measurement of serum markers of disease, and even molecular testing. A positive screening test leads to further diagnostic testing, which might lead to a cancer diagnosis.

The intuitive appeal of early detection accounts for the emphasis that has long been placed on screening. However, it is not widely understood that screening tests are always associated with some harm (e.g., anxiety, financial costs) and may actually cause substantial harm (e.g., invasive follow-up diagnostic or therapeutic procedures). Because screening is, by definition, done in healthy people, all early detection tests should be carefully studied and their risk-benefit ratio determined before they are adopted for widespread usage.

Screening is a public health intervention. However, some draw a distinction between screening an individual within the doctor-patient relationship and mass screening, a program aimed at screening a large population. The latter may involve advertising campaigns to encourage people to be screened for a particular cancer at a shopping mall or at a community event, such as state fair.

Screening may be either opportunistic (i.e., a patient sees a health-care provider who chooses to screen or not to screen) or programmatic. Programmatic refers to a standardized approach with algorithms for screening and follow-up as well as recall of patients for regular routine screening with quality control measures. Programmatic screening is usually more effective.


PERFORMANCE CHARACTERISTICS

The degree to which a screening test can discriminate between individuals with and without a particular disease is described by its performance characteristics. These include the a test’s sensitivity, specificity, positive predictive value (PPV), and negative predictive value (NPV) (Table 34.1). It should be noted that these measures relate to the accuracy of a screening test; they do not provide any information regarding a test’s efficacy or effectiveness.


  • Sensitivity is the proportion of persons designated positive by the screening test among all individuals who have the disease: true positive (TP)/(TP + false negative [FN]).


  • Specificity is the proportion of persons designated negative by the screening test among all individuals who do not have the disease: true negative TN/(TN + false positive [FP]).


  • Positive predictive value is the proportion of individuals with a positive screening test who have the disease: (TP)/(TP + FP).


  • Negative predictive value is the proportion of individuals with a negative screening test who do not have the disease: (TN)/(TN + false negative [FN]).2

For a given screening test, sensitivity and specificity are inversely related. For example, as one lowers the threshold for considering a serum prostate-specific antigen (PSA) level to represent a positive screen, the sensitivity of the test increases and more cancers will be detected. This increased sensitivity comes at the cost of decreased specificity (i.e., more men without cancer will have positive screenings tests and, therefore, will be subjected to unnecessary diagnostic procedures).

Some screening tests, such as mammograms, are more subjective and operator dependent than others. For this reason, the sensitivity and specificity of screening mammography varies among radiologists. For a given radiologist, the lower his or her threshold for considering a mammogram to be suspicious, the higher the sensitivity and lower the specificity will be for them. However, mammography can have both a higher sensitivity and higher specificity in the hands of a more experienced versus a less experienced radiologist.

As opposed to sensitivity and specificity, the PPV and NPV of a screening test are dependent on disease prevalence. PPV is also highly responsive to small increases in specificity. As shown in Table 34.2, given a disease prevalence of 5 cases per 1,000 (0.005), the PPV of a hypothetical screening test increases dramatically as specificity goes from 95% to 99.9%, but only marginally as sensitivity goes from 80% to 95%. Given a disease prevalence of only 1 per 10,000 (0.0001), the PPV of the same test is poor even at high sensitivity and specificity. The positive association between breast cancer prevalence and age is the major reason why screening mammography is a better test (higher PPV) for women aged 50 to 59 than for women 40 to 49 years of age.


ASSESSING SCREENING TESTS AND OUTCOMES


Screening Test Results

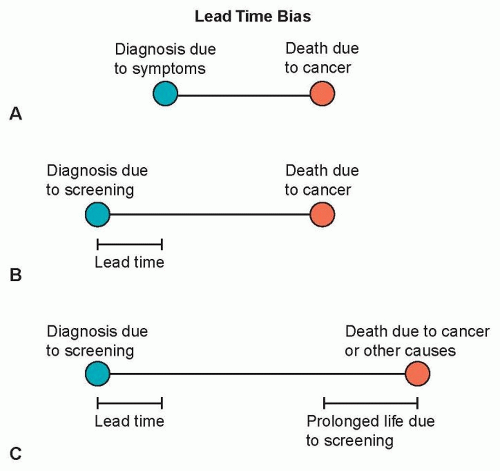
Lead time bias occurs whenever screening results in an earlier diagnosis than would have occurred in the absence of screening.
Because survival is measured from the time of diagnosis, an earlier diagnosis, by definition, increases survival. Unless an effective intervention is available, lead time bias has no impact on the natural history of a disease and death will occur at the same time it would have in the absence of early detection (Fig. 34.1).


TABLE 34.1 Performance Characteristics of a Screening Test


Sensitivity is the proportion designated positive by the screening test among all individuals who have the disease.


image


Specificity is the proportion designated negative by the screening test among all those who do not have the disease.


image


Positive predictive value is the proportion of individuals with a positive test who have the disease.


image


Negative predictive value is the proportion of individuals with a negative test negative who do not have the disease.


image


TP, true positive, the condition present and the test is positive; FN, false negative, the condition is present and the test is negative; FP, false positive, the condition is absent and the test is positive; TN, true negative, the condition is absent and test is negative.


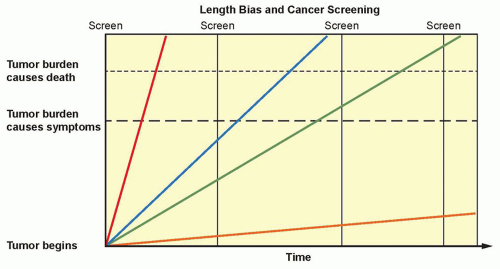
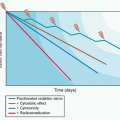
Length bias is a function of the biologic behavior of a cancer. Slower growing, less aggressive cancers are more likely to be detected by a screening test than faster growing cancers, which are more likely to be diagnosed due to the onset of symptoms between scheduled screenings (interval cancers). Length bias has an even greater effect on survival statistics than lead time bias (Fig. 34.2).

Overdiagnosis is an extreme form of length bias and represents pure harm. It refers to the detection of tumors, often through highly sensitive modern imaging modalities and other diagnostic tests, that fulfill the histologic criteria for malignancy but are not biologically destined to harm the patient (see Fig. 34.2).


TABLE 34.2 Positive Predictive Value Given Varying Sensitivity and Specificity and Prevalence


Prevalence 0.005


Sensitivity %


80


90


95


Specificity %


95


7


8


9


99


29


31


32


99.9


80


82


83


Prevalence 0.0001


Sensitivity %


80


90


95


Specificity %


95


0.2


0.2


2.0


99


0.8


0.9


0.9


99.9


0.7


8.0


9.0


PPV improves dramatically in response to small changes in specificity. Changes in specificity influence PPV much more than changes in sensitivity. Note the influence of prevalence on PPV. Screening tests do not perform as well in populations with a low prevalence of disease.


Figure 34.1 Survival is the time from cancer diagnosis to death. (A) Lead time bias occurs when screening results in an earlier diagnosis. Without screening, a patient is diagnosed with cancer due to symptoms. (B) With screening, the patient is often diagnosed earlier. When screening and treatment do not prolong life, the screened patient can have a longer survival solely due to the earlier diagnosis. The survival increase is pure lead time bias. (C) When screening and treatment are beneficial, the patient is diagnosed before the onset of symptoms and the patient lives beyond the point in which death would have occurred without screening.

There are two categories of overdiagnosis: the detection of histologically defined cancers not destined to metastasize or harm the patient, and the detection of cancers not destined to metastasize or cause harm in the life span of the specific patient. The importance of this second category is illustrated by the widespread practice in the United States of screening elderly patients with limited life expectancies, who are thus unlikely to benefit from early cancer diagnosis.

Overdiagnosis occurs with many malignancies, including lung, breast, prostate, renal cell, melanoma, and thyroid cancers.3 Neuroblastoma provides one of the most striking examples of overdiagnosis.4 Urine vanillylmandelic acid (VMA) testing is a highly sensitive screening test for the detection of this pediatric disease. After screening programs in Germany, Japan, and Canada showed marked increases in the incidence of this disease without a concomitant decline in mortality, it was noticed that nearby areas that did not screen had similar death rates with lower incidence.4,5 It is now appreciated that screen-detected neuroblastomas have a very good prognosis with minimal or no treatment. Many actually regress spontaneously.

Stage shift—i.e., a cancer diagnosis at an earlier stage than would have occurred in the absence of screening—is necessary, but not sufficient, for a screening test to be effective in terms of reducing mortality. Both lead time bias and length bias contribute to this phenomenon. Although it is tempting to speculate that diagnosis at an earlier stage must confer benefit, this is not necessarily the case. For example, a substantial proportion of men treated with radical prostatectomy for what appears to be a localized prostate cancer relapse after undergoing surgery. Conversely, some men who are treated with definitive therapy would never have gone on to develop metastatic disease in the absence of treatment.


Selection bias occurs when enrollees in a clinical study differ from the general population. In fact, people who voluntarily participate in clinical trials tend to be healthier than the general population, perhaps due to a greater interest in health and healthcare research. Screening studies tend to enroll individuals healthier than the general population. This so-called healthy volunteer effect6,7 can introduce a powerful bias if not adequately controlled for by randomization procedures.


Figure 34.2 Length bias and cancer screening. The red line is indicative of a fast-growing tumor that is not amenable to regular screening. The blue line is indicative of a fast-growing tumor that can be diagnosed by screening or later by symptoms; death may possibly be prevented by treatment. The green line is a slower growing but potentially deadly cancer that can be detected by symptoms or several screenings and treated, possibly preventing death. The orange line is indicative of a very slow growing tumor that would never cause death and would never need treatment despite being screen detected. This is classic overdiagnosis.


Assessing Screening Outcomes

The usual primary goal of cancer screening is to reduce mortality from the disease in question (a reduction in disease-specific mortality). Screening studies generally do not have sufficient statistical power to assess the impact of screening for a specific malignancy on overall mortality. (Lung cancer screening provides an exception to this rule; see the following.) As discussed previously, the fact that a screening test increases the percentage of people diagnosed with early stage cancer and decreases that of late stage cancer (stage shift) is not equivalent to proof of mortality reduction. Further, due to the healthy volunteer effect, case control and cohort studies cannot provide definitive evidence of mortality benefit. Prospective, randomized clinical trials are required to address this issue. In such trials, volunteers are randomized to be screened or not and are then followed longitudinally to determine if there is a difference in disease-specific or overall mortality.

A reduction in mortality rates or in the risk of death is often stated in terms of relative risk. However, this method of reporting may be misleading. It is preferable to report both the relative and absolute reduction in mortality. For example, the European Randomized Study of Screening for Prostate Cancer (ERSPC) showed that screening reduced the risk of prostate cancer death by 20%. However, this translates into only 1 prostate cancer death averted per 1,000 men screened (5 prostate cancer deaths per 1,000 men not screened versus 4 prostate cancer deaths per 1,000 men screened) and a relatively modest lifetime reduction in the absolute risk of prostate cancer death of only 0.6%, from 3.0% to 2.4%.8


PROBLEMS WITH RANDOMIZED TRIALS

It is important to acknowledge that even prospective, randomized trials can have serious methodologic shortcomings. For example, imbalances caused by flaws in the randomization scheme can prejudice the outcome of a trial. Other flaws include so-called drop-in or contamination, in which some participants on the control arm get the intervention. Patients on the intervention arm may also drop out of the study. Both drop-ins and drop-outs reduce the statistical power of a clinical trial.

In the United States, it is now considered standard to obtain informed consent before randomization takes place. However, there have been several published studies that randomized participants from rosters of eligible subjects such as census lists. In these trials, informed consent was obtained after randomization and only among those randomized to the screening arm of the study. Those randomized to the control arm were not contacted, and indeed, did not know they were in a clinical trial. They were followed through national death registries. Although the study was analyzed on an intent-to-screen basis, this method can still introduce biases. For example, only patients on the intervention arm had access to the screening facility and staff for counseling and treatment if diagnosed; those in the control group were more likely to be treated in the community as opposed to high-volume centers of excellence and were less likely to be treated with surgery and more likely to be treated with hormones alone than those on the screened arm. The study arms would also tend to differ in their knowledge of the disease, which may contribute to an overestimate of the benefits of a screening test.9

Virtually every screening test is a balance between known harms and potential benefits. The most important risk of screening is the detection and subsequent treatment of a cancer that would never have come to clinical detection or harmed the patient in the absence of screening (i.e., overdiagnosis and overtreatment). Treatment can cause emotional and physical morbidity and even death.10 Even when screening has a net mortality benefit, there can be considerable harm. For example, in the recent randomized trial of spiral lung computed tomography (CT) scan, approximately 27,000 current smokers and former smokers were given three annual low-dose CT scans. More than 20% had a positive screening CT scan, necessitating further testing. About 1,000 subsequently underwent invasive diagnostic procedures and 16 deaths were reported within 60 days of the procedure.11 It is not known how many of these deaths were directly related to the screening.

It can be dangerous to extrapolate estimates of benefit from one population to another. In particular, studies showing that a radiographic test is beneficial to average risk individuals may not mean that it is beneficial to a population at high risk, and vice versa. For example, women at high risk for breast cancer due to an inherited mutation of a DNA repair gene may be at higher risk for radiation-induced cancer from mammographies compared to the general population; a screening test (e.g., spiral lung CT scan), shown to be efficacious in a high-risk population of heavy smokers may result in net harm if applied to a low or average risk population.


SCREENING GUIDELINES AND RECOMMENDATIONS

A number of organizations develop cancer screening recommendations or guidelines. These organizations use varying methods. The Institute of Medicine (IOM) has released two reports to establish standards for developing trustworthy clinical practice guidelines and conducting systematic evidence reviews that serve as their basis.12,13 The U.S. Preventive Services Task Force (USPSTF) and the American Cancer Society (ACS) are two organizations that issue respected and widely used cancer guidelines (Table 34.3). Both have changed their methods to comply with the IOM standards.

The USPSTF is a panel of experts in prevention and evidencebased medicine.14 They are primary care providers specializing in internal medicine, pediatrics, family practice, gynecology and obstetrics, nursing, and health behavior. The task force process begins by conducting an extensive structured scientific evidence review. The task force then develops recommendations for primary care clinicians and health-care systems. They adhere to some of the highest standards for recommending a screening test. They are very much concerned with the question, “Does the evidence supporting a screening test demonstrate that the benefits outweigh its harms?”

The ACS guidelines date back to the 1970s. The current process for making guidelines involves commissioning academics to do an independent systematic evidence review. A single generalist group digests the evidence review, listens to public input, and writes the guidelines. The ACS panel tries to clearly articulate the benefits, limitations, and harms associated with a screening test.15


BREAST CANCER

Mammographies, clinical breast examinations (CBE) by a healthcare provider, and breast self-examinations (BSE) have long been advocated16 for the early detection of breast cancer. In recent years, ultrasound, magnetic resonance imaging (MRI), and other technologies have been added to the list of proposed screening modalities.

Mammographic screening was first advocated in the 1950s. The Health Insurance Plan (HIP) Study was the first prospective, randomized clinical trial to formally assess its value in reducing death from breast cancer. In this study, started in 1963, about 61,000 women were randomized to three annual mammograms with clinical breast examination versus no screening, which was the standard practice at that time. HIP first reported that mammography reduced breast cancer mortality by 30% at about 10 years after study entry. With 18 years of follow-up, those in the screening arm had a 25% lower breast cancer mortality rate.16

Nine additional prospective randomized studies have been published. These studies provide the basis for the current consensus that screening women 40 to 75 years of age does reduce the relative risk of breast cancer death by 10% to 25%. The 10 studies demonstrate that the risk-benefit ratio is more favorable for women over 50 years of age. Mammography has also been shown to be operator dependent, with better performance characteristics (higher sensitivity and specificity and lower FP rates) reported by high-volume centers (Table 34.4).

It is important to note that every one of these studies has some flaws and limitations. They vary in the questions asked and their findings. The Canadian screening trial suggests mammographies and clinical breast examinations do not decrease risk of death for woman aged 40 to 49 and that mammographies add nothing to CBEs for women age 50 to 59 years.17 On the other extreme, the Kopparberg Sweden study suggests that mammographies are associated with a 32% reduction in the risk of death for women aged 40 to 74 years.18

To date, no study has shown that BSEs decrease mortality. BSEs have been studied in two large randomized trials. In one, approximately 266,000 Chinese women were randomized to receive intensive BSE instruction with reinforcements and reminders compared to a control group receiving no instruction on BSE. At 10 years of follow-up, there was no difference in mortality, but the intervention arm had a significantly higher incidence of benign breast lesions diagnosed and breast biopsies preformed. In the second study, 124,000 Russian women were randomized to monthly BSEs versus no BSEs. There was no difference in mortality rates, despite the BSE group having a higher proportion of early stage tumors and a significant increase in the proportion of cancer patients surviving 15 years after diagnosis.

Ultrasonography is primarily used in the diagnostic evaluation of a breast mass identified by palpation or mammography. There is little evidence to support the use of ultrasound as an initial screening test. This modality is highly operator dependent and time consuming, with a high rate of FP findings.19 An MRI is used for screening women at elevated breast cancer risk due to BRCA1 and BRCA2 mutations, Li-Fraumeni syndrome, Cowden disease, or a very strong family history. MRI is more sensitive but less specific than mammography, leading to a high FP rate and more unnecessary biopsies, especially among young women.20 The impact of MRI breast screening on breast cancer mortality has not yet been determined.

Thermography, an infrared imaging technology, has some advocates as a breast cancer screening modality despite a lack of evidence from several small cohort studies.21 Nipple aspirate cytology and ductal lavage have also been suggested as possible screening methods. Both should be considered experimental at this time.22


Effectiveness of Breast Cancer Screening

Breast cancer screening has been associated with a dramatic rise in breast cancer incidence. At the same time, there has been a dramatic decrease in breast cancer mortality rates. However, in the United States and Europe, incidence-by-stage data show a dramatic increase in the proportion of early stage cancers without a concomitant decrease in the incidence of regional and metastatic cancers.23 These findings are at odds with the clinical trials data and raise questions regarding the extent to which early diagnosis is responsible for declining breast cancer mortality rates.

From 1976 to 2008, the incidence of early-stage breast cancer for American women aged 40 and older increased from 112 to 234 per 100,000. This is a rise of 122 cases per 100,000, whereas the absolute decrease in late-stage cancers was only 8 cases per 100,000 (from 102 to 94 cases per 100,000). These data raise questions regarding the magnitude of benefit, as well as the potential risks, of breast cancer screening. The discrepancy between the magnitude of the increase of early disease and the decrease of late-stage cancer and cancer mortality suggests that a proportion of invasive breast cancers diagnosed by screening represents overdiagnosis. These data suggest that overdiagnosis accounts for up to 31% of all breast cancers diagnosed by screening.24 Others have estimated that up to 50% of breast cancers detected by screening mammography are overdiagnosed cancers. In an exhaustive review of the screening literature, a panel of experts concluded that overdiagnosis does exist and estimated it to be 11% to 19% of breast cancers diagnosed by screening.25

A confounding factor with regard to the mortality benefits of breast cancer screening is the improvement that has occurred in breast cancer treatment over this period of time. The effects of the advances in therapy are supported by cancer modeling studies. Indeed, the Cancer Intervention and Surveillance Modeling Network (CISNET), supported by the U.S. National Cancer Institute (NCI), has estimated that two-thirds of the observed breast cancer mortality reduction is attributable to modern therapy, rather than to screening.26


TABLE 34.3 Screening Recommendations for Normal-Risk Asymptomatic Subjects


Cancer Type


Test or Procedure


American Cancer Society


U.S. Preventive Services Task Force


Breast


Self-examination


Women ≥20 years: Breast self-exam is an option


“D”


Clinical examination


Women 20-39 years: Perform every 3 years Women ≥40 years: Perform annually


Women ≥40 years: “I” (as a stand alone without mammography)


Mammography


Women ≥40 years: Screen annually for as long as the woman is in good health


Women 40-49 years: The decision should be an individual one, and take patient context/values into account (“C”) Women 50-74 years: Every 2 years (“B”) Women ≥75 years: “I”


MRI


Women >20% lifetime risk of breast cancer: Screen with MRI plus mammography annually Women 15%-20% lifetime risk of breast cancer: Discuss option of MRI plus mammography annually Women <15% lifetime risk of breast cancer: Do not screen annually with MRI


“I”


Cervical


Pap test (cytology)


Women ages 21-29 years: Screen every 3 years


Women ages 21-65 years: Screen every 3 years (“A”)


Women 30-65 years: Acceptable approach to screen with cytology every 3 years (see HPV test)


Women <21 years: “D” Women >65 years, with adequate, normal prior Pap screenings: “D”


Women <21 years: No screening Women >65 years: No screening following adequate negative prior screening


Women after total hysterectomy for noncancerous causes: Do not screen


Women after total hysterectomy for noncancerous causes: “D”


HPV test


Women <30 years: Do not use HPV testing Women ages 30-65 years: Preferred approach to screen with HPV and cytology cotesting every 5 years (see Pap test) Women >65 years: No screening following adequate negative prior screening Women after total hysterectomy for noncancerous causes: Do not screen


Women ages 30-65 years: Screen in combination with cytology every 5 years if woman desires to lengthen the screening interval (see Pap test) (“A”) Women <30 years: “D” Women >65 years, with adequate, normal prior Pap screenings: “D” Women after total hysterectomy for noncancerous causes: “D”


Colorectal


Sigmoidoscopy


Adults ≥50 years: Screen every 5 years Note: For all CRC screening tests, stop screening when benefits are unlikely due to life-limiting comorbidity.


Adults 50-75 years: Every 5 years in combination with high-sensitivity fecal occult blood testing (FOBT) every 3 years (“A”)a Adults 76-85 years: “C” Adults ≥85 years: “D”


Fecal occult blood testing (FOBT)


Adults ≥50 years: Screen every year with high sensitivity guaiac based FOBT or fecal immunochemical test (FIT) only


Adults 50-75 years: Annually, for highsensitivity FOBT (“A”) Adults 76-85 years: “C” Adults ≥85 years: “D”


Colonoscopy


Adults ≥50 years: Screen every 10 years


Adults 50-75 years: every 10 years (“A”) Adults 76-85 years: “C” Adults ≥85 years: “D”


Fecal DNA testing


Adults ≥50 years: Screen, but interval uncertain


“I”


Fecal immunochemical testing (FIT)


Adults ≥50 years: Screen every year


“I”


CT colonography


Adults ≥50 years: Screen every 5 years


“I”


Lung


Complete skin examination by clinician or patient


Men and women, 55-74 years, with ≥30 pack-year smoking history, still smoking or have quit within past 15 years: Discuss benefits, limitations, and potential harms of screening. Only perform screening in facilities with the right type of CT scanner and with high expertise/specialists.


“I” (“B” draft recommendation issued for public comment in July 2013)


Ovary


CA-125 Transvaginal ultrasound


There is no sufficiently accurate test proven effective in the early detection of ovarian cancer. For women at high risk of ovarian cancer and/or who have unexplained, persistent symptoms, the combination of CA-125 and transvaginal ultrasound with pelvic exam may be offered.


“D” “D”


Prostate


Prostate-specific antigen (PSA)


Starting at age 50, men should talk to a doctor about the pros and cons of testing so they can decide if testing is the right choice for them. If African American or have a father or brother who had prostate cancer before age 65, men should have this talk starting at age 45. How often they are tested will depend on their PSA level.


Men, all ages: “D”


Digital rectal examination (DRE)


As for PSA; if men decide to be tested, they should have the PSA blood test with or without a rectal exam.


No individual recommendation


Skin


Complete skin examination by clinician or patient


Self-examination monthly; clinical exam as part of routine cancer-related checkup


“I”


Note: Summary of the screening procedures recommended for the general population by the American Cancer Society and the U.S. Preventive Services Task Force. These recommendations refer to asymptomatic persons who have no risk factors for the cancer, other than age or gender.


a USPSTF lettered recommendations are defined as follows: “A”: The USPSTF recommends the service, because there is high certainty that the net benefit is substantial. “B”: The USPSTF recommends the service, because there is high certainty that the net benefit is moderate or moderate certainty that the net benefit is moderate to substantial. “C”: The USPSTF recommends selectively offering or providing this service to individual patients based on professional judgment and patient preferences. There is at least moderate certainty that the net benefit is small. “D”: The USPSTF recommends against the service, because there is moderate or high certainty that the service has no net benefit or that the harms outweigh the benefits. “I”: The USPSTF concludes that the current evidence is insufficient to assess the balance of benefits and harms of the service.


Questions have also been raised regarding the quality of the randomized screening trials that demonstrated the mortality benefits of mammography and clinical breast examination because these trials suffered from a variety of design flaws. In some, randomization methods were suboptimal, others reported varying numbers of participants over the years, and still others had substantial contamination (drop-ins). Perhaps more importantly, most trials were started and concluded before the widespread use of more advanced mammographic technology, before the modern era of adjuvant therapy, and before the advent of targeted therapy.

Although randomized control trials (RCT) remain the gold standard for assessing the benefits of a clinical intervention, they cannot take into account improvements in both treatment and patient awareness that occurred over time. For this reason, observational and modeling studies can provide important, complementary information.

One systematic review of 17 published population-based and cohort studies compared breast cancer mortality in groups of women aged 50 to 69 years who started breast cancer screening at different times. Although these studies are subject to methodologic limitations, only four suggested that breast cancer screening reduced the relative risk of breast cancer mortality by 33% or more and five suggested no benefit from screening. The review concluded that breast cancer screening likely reduces the risk of breast cancer death by no more than 10%.27

Even with these limitations, a systematic review of the data sponsored by the USPSTF concluded that regular mammography reduces breast cancer mortality in women aged 40 to 74 years.28 The task force also concluded that the benefits of mammography are most significant in women aged 50 to 74 years.


Screening Women Age 40 to 49

Experts disagree about the utility of screening women in their forties. In the HIP Randomized Control Trial, women who entered at age 40 to 49 years had a mortality benefit at 18 years of follow-up. However, to a large extent, the mortality benefit among those aged 45 to 49 years at entry was driven by breast cancers diagnosed after they reached age 50 years.16

Mammography, like all screening tests, is more efficient (higher PPV) for the detection of disease in populations with higher disease prevalence (see Table 34.2). Mammography is, therefore, a better test in women age 50 to 59 years than it is among women age 40 to 49 years because the risk of breast cancer increases with age. Mammography is also less optimal in women age 40 to 49 years compared to women 50 to 59 years of age for the following reasons:


  • A larger proportion have increased breast density, which can obscure lesions (lower sensitivity).


  • Younger women are more likely to develop aggressive, fast-growing breast cancers that are diagnosed between regular screening visits. By definition, these interval cancers are not screen detected.29

The USPSTF meta-analysis of eight large randomized trials suggested a 15% relative reduction in mortality (relative risk [RR], 0.85; 95% confidence interval [CI], 0.75 to 0.96) from mammography screening for women aged 40 to 49 years after 11 to 20 years of follow-up. This is equivalent to a needing to invite 1,904 women to screenings over 10 years to prevent one breast cancer death. Studies, however, show that more than half of women aged 40 to 49 years screened annually over a 10-year period will have an FP mammogram necessitating further evaluation, often including biopsy. In addition, estimates of overdiagnosis in this group range from 10% to 40% of diagnosed invasive cancers.30

In an effort to decrease FP rates, some have suggested screening every 2 years rather than yearly. Comparing biennial with annual screening, the CISNET Model consistently shows that biennial screening of women ages 40 to 70 only marginally decreases the number of lives saved while halving the false positive rate.29 Notably, the Swedish two-county trial, which had a planned 24-month screening interval (the actual interval was 33 months) reported one

of the greatest reductions in breast cancer mortality among the RCTs conducted to date.


TABLE 34.4 Randomized Controlled Trials


Study


Randomization


Sample Size


Intervention and Age at Entry


Follow-up


Finding


Health Insurance Plan, United States 1963a,b


Individual


60,565-60,857


MMG and CBE for 3 years Age 40-64 years


18 years


RR 0.77 (95% CI: 0.61-0.97)


Malmo, Sweden 1976c,d


Individual


42,283


Two-view MMG every 18-24 months × 5 Age 45-69 years


12 years


RR 0.81 (95% CI: 0.62-1.07)


Ostergotland (County E of Two-County Trial) Sweden 1977e,f,g


Geographic cluster


38,405-39,034 study 37,145-37,936 control


Three single-view MMG every 2 years women, Age 40-50 years Every 33 months women, Age 50-74


12 years


RR 0.82 (95% CI: 0.64-1.05)


Kopparberg (County W of Two-County Trial) Sweden 1977e,f,g


Geographic cluster


38,562-39,051 intervention 18,478-18,846 control


Three single-view MMG every 2 years women, Age 40-50 years Every 33 months women, Age 50-74 years


12 years


RR 0.68 (95% CI: 0.52-0.89)


Edinburgh, United Kingdomh


Cluster by physician practice


23,266 study 21,904 control


Initially, two-view MMG and CBE Then annual CBE with single-view MMG years 3, 5, and 7, Age 45-64 years


10 years


RR 0.84 (95% CI: 0.63-1.12)


NBSS-1, Canada 1980i,j


Individual


25,214 study (100% screened after entry CBE) 25,216 control


Annual two-view MMG and CBE for 4-5 years, Age 40-49 years


13 years


RR 0.97 (95% CI: 0.74-1.27)


NBSS-2, Canada 1980i,j


Individual


19,711 study (100% screened after entry CBE) 19,694 control


Annual two-view MMG and CBE versus CBE, Age 50-59 years


11-16 years (mean 13 years)


RR 1.02 (95% CI: 0.78-1.33)


Stockholm, Sweden 1981k


Cluster by birth date


40,318-38,525 intervention group 19,943-20,978 control group


Single view MMG every 28 months × 2 Age 40-64 years


8 years


RR 0.80 (95%) CI: 0.53-1.22)


Gothenberg, Sweden 1982d


Complex


21,650 invited 29,961 control


Initial two-view MMG, then singleview MMG every 18 months × 4 Single read first three rounds, then double-read, Age 39-59 years


12-14 years


RR 0.79 (95% CI 0.58-1.08) In the evaluation phase RR 0.77 (95% CI 0.60-1.00) In follow-up phase


Age Triall


Individual


160,921 (53,884 invited; 106,956 not invited)


Invited group aged 48 and younger offered annual screening by MMG (double-view first screen, then single mediolateral oblique view thereafter); 68% accepted screening on the first screen an 69% and 70% were reinvited (81% attended at least one screen) Age 39-41 years


10.7 years


RR 0.83 (95% CI: 0.66-1.04)


a Shapiro S, Venet W, Strax P, et al. Ten- to fourteen-year effect of screening on breast cancer mortality. J Natl Cancer Inst 1982;69:349-355.

b Shapiro S. Periodic screening for breast cancer: the HIP Randomized Controlled Trial. Health Insurance Plan. J Natl Cancer Inst Monogr 1997:27-30.

c Andersson I, Aspegren K, Janzon L, et al. Mammographic screening and mortality from breast cancer: the Malmo mammographic screening trial. BMJ 1988;297:943-948.

d Nystrom L, Rutqvist LE, Wall S, et al. Breast cancer screening with mammography: overview of Swedish randomised trials. Lancet 1993;341:973-978.

e Tabar L, Fagerberg CJ, Gad A, et al. Reduction in mortality from breast cancer after mass screening with mammography. Randomised trial from the Breast Cancer Screening Working Group of the Swedish National Board of Health and Welfare. Lancet 1985;1:829-832.

f Tabar L, Fagerberg G, Duffy SW, Day NE. The Swedish two county trial of mammographic screening for breast cancer: recent results and calculation of benefit. J Epidemiol Community Health 1989;43:107-114.

g Tabar L, Fagerberg G, Duffy SW, et al. Update of the Swedish two-county program of mammographic screening for breast cancer. Radiol Clin North Am 1992;30:187-210.

h Roberts MM, Alexander FE, Anderson TJ, et al. Edinburgh trial of screening for breast cancer: mortality at seven years. Lancet 1990;335:241-246.

i Miller AB, To T, Baines CJ, Wall C. The Canadian National Breast Screening Study-1: breast cancer mortality after 11 to 16 years of follow-up. A randomized screening trial of mammography in women age 40 to 49 years. Ann Intern Med 2002;137:305-312.

j Miller AB, Wall C, Baines CJ, et al. Twenty five year follow-up for breast cancer incidence and mortality of the Canadian National Breast Screening Study: randomised screening trial. BMJ 2014;348-366.

k Frisell J, Eklund G, Hellstrom L, et al. Randomized study of mammography screening—preliminary report on mortality in the Stockholm trial. Breast Cancer Res Treat 1991;18:49-56.

l Moss SM, Cuckle H, Evans A, et al. Effect of mammographic screening from age 40 years on breast cancer mortality at 10 years’ follow-up: a randomised controlled trial. Lancet 2006;368:2053-2060.


Screening Women at High Risk

There is interest in creating risk profiles as a way of reducing the inconveniences and harms of screening. It might be possible to identify women who are at greater risk of breast cancer and refocus screening efforts on those most likely to benefit.

Risk factors for breast cancer include the following:


  • Extremely dense breasts on mammography or a first-degree relative with breast cancer are each associated with at least a twofold increase in breast cancer risk


  • Prior benign breast biopsy, second-degree relatives with breast cancer, or heterogeneously dense breasts each increase risk 1.5-to twofold


  • Current oral contraceptive use, nulliparity, and age at first birth 30 years and older increase risk 1- to 1.5-fold.31

Importantly, these are risk factors for breast cancer diagnosis, not breast cancer mortality. Few studies have assessed the association between these factors and death from breast cancer; however, reproductive factors and breast density have been shown to have limited influence on breast cancer mortality.32,33

Genetic testing for BRCA1 and BRCA2 mutations and other markers of breast cancer risk has identified a group of women at high risk for breast cancer. Unfortunately, when to begin and the optimal frequency of screening have not been defined. Mammography is less sensitive at detecting breast cancers in women carrying BRCA1 and BRCA2 mutations, possibly because such cancers occur in younger women in whom mammography is known to be less sensitive.

MRI screening may be more sensitive than mammography in women at high risk, but specificity is lower. MRIs are associated with both an increase in FP and an increase in the detection of smaller cancers, which are more likely to be biologically indolent. The impact of MRIs on breast cancer mortality with or without concomitant use of mammographies has not been evaluated in a randomized controlled trial.


Breast Density

It is well established that mammogram sensitivity is lower in women with heterogeneously dense or very dense breasts.29,32 However, at this time, there are no clear guidelines regarding whether or how screening algorithms should take breast density into account.

In the American College of Radiology’s Imaging Network (ACRIN)/NCI 666 Trial, breast ultrasound was offered to women with increased mammographic breast density and, if either test was positive, they were referred for a breast biopsy.34 The radiologists performing the ultrasounds were not aware of the mammographic findings. Mammography detected 7.6 cancers per 1,000 women screened; ultrasound increased the cancer detection rate to 11.8 per 1,000. However, the PPV for mammography alone was 22.6%, whereas the PPV for mammography with ultrasound was only 11.2%.

It has yet to be determined whether supplemental imaging reduces breast cancer mortality in women with increased breast density. Although it continues to be strongly advocated by some, systematic reviews have concluded that the evidence is currently insufficient to recommend for or against this approach.35 There are also a number of barriers to supplemental imaging, including inconsistent insurance coverage, lack of availability in many communities, concerns about cost-effectiveness (particularly with regard to MRI), and the increased FP rate associated with supplemental imaging leading to unnecessary biopsies.36

Newer technologies may improve screening accuracy for women with dense breasts. Compared to conventional mammography, full field digital mammography (FFDM) appears to have less FPs. This could reduce the number of women needing supplemental imaging and biopsies.37 Digital breast tomosynthesis (DBT) uses x-rays and a digital detector to generate cross-sectional images of the breasts. Data are limited, but compared to mammograms, DBT appears to offer increased sensitivity and a reduction in the recall rates.38 Another potential supplementary imaging modality currently under investigation is three-dimensional (3-D) automated breast ultrasound, and having screening ultrasounds performed by technologists rather than radiologists.


Ductal Carcinoma In Situ

The incidence of noninvasive ductal carcinoma in situ (DCIS) has increased more than fivefold since 1970 as a direct consequence of widespread screening mammographies.39 DCIS is a heterogeneous condition with low- and intermediate-grade lesions taking a decade or more to progress. Nevertheless, women with this diagnosis are uniformly subjected to treatment. A better understanding of this entity and an increased ability to predict its biologic behavior may enable more judicious, personalized treatment of DCIS.

Only gold members can continue reading. Log In or Register to continue

Stay updated, free articles. Join our Telegram channel

Jun 28, 2016 | Posted by in ONCOLOGY | Comments Off on Cancer Screening

Full access? Get Clinical Tree

Get Clinical Tree app for offline access