Estimated new cases
Estimated deaths
Both genders
Male
Female
Both genders
Male
Female
All sites
1,665,540
855,220
810,320
585,720
310,010
275,710
Oral cavity and pharynx
42,440
30,220
12,220
8390
5730
2660
Digestive system
289,610
162,730
126,880
147,260
84,970
62,290
Respiratory system
242,550
130,000
112,550
163,660
90,280
73,380
Bones and joints
3020
1680
1340
1460
830
630
Soft tissue
12,020
6550
5470
4740
2550
2190
Skin
81,220
46,630
34,590
12,980
8840
4140
Breast
235,030
2360
232,670
40,430
430
40,000
Genital system
338,450
243,460
94,990
59,970
30,180
28,790
Urinary system
141,610
97,420
41,190
30,350
20,610
9740
Eye and orbit
2730
1440
1290
310
130
180
Brain and nervous system
23,380
12,820
10,560
14,320
8090
6230
Endocrine system
65,630
16,600
49,030
2820
1300
1520
Lymphoma
79,990
43,340
36,650
20,170
11,140
9030
Myeloma
24,050
13,500
10,550
11,090
6110
4980
Leukemia
52,380
30,100
22,280
24,090
14,040
10,050
Other
31,430
16,370
15,060
44,680
24,780
19,900
The fifth leading cause of cancer deaths among women is ovarian cancer. The death rate for this cancer illustrates the need for better diagnostic tools. It is estimated that during 2014, 21,980 women will be diagnosed with ovarian cancer during and 14,270 will die from this disease (http://www.ovariancancer.org/about-ovarian-cancer/statistics/) [1]. Funding to support ovarian cancer research in the USA has predominantly come from federal agencies, which committed $112 million in the year 2010 (http://www.ovariancancerresearch.thegcf.org/). Other nonprofit organizations have contributed another $16 million, for a total national commitment of at least $128 million to support ovarian cancer research. Overall this funding level represents greater than $9000 for every woman who will die from ovarian cancer. Unfortunately, even at this fiscal commitment, the prognosis for women diagnosed with ovarian cancer remains poor. This disease does not have a reliable early detection or screening test, resulting in more than 60 % of patients being initially diagnosed with stage III or stage IV cancer. At these stages the cancer has already spread beyond the ovaries. A lack of progress in diagnosing and/or treating ovarian cancer is reflected in Table 6.2 (http://www.ovariancancer.org/about-ovarian-cancer/statistics/). Over the first decade of this century, there was little change in the number of women diagnosed with this disease and no significant change in the number of deaths. Overall the ratio of new cases report and deaths shows no significant change over this 10 year period.
Table 6.2
Yearly ovarian cancer cases and deaths in the USA between 1999 and 2009
Year | Cases | Deaths | Cases/Deaths |
|---|---|---|---|
2009 | 21,500 | 14,600 | 1.47 |
2005 | 19,842 | 14,787 | 1.34 |
2004 | 20,069 | 14,716 | 1.36 |
2003 | 20,445 | 14,657 | 1.39 |
2002 | 19,792 | 14,682 | 1.35 |
2001 | 19,719 | 14,414 | 1.37 |
2000 | 19,672 | 14,060 | 1.40 |
1999 | 19,676 | 13,627 | 1.44 |
Ovarian cancer is typically diagnosed in patients that already show symptoms. The symptoms may include pressure or pain within the pelvis, abdomen, back, or legs, bloating within the abdomen, chronic tiredness, gas, diarrhea, constipation, indigestion, and nausea (http://www.medicinenet.com/ovarian_cancer/article.htm; http://www.mayoclinic.com/health/ovarian-cancer/DS00293/DSECTION=symptoms). Other less common symptoms include unusual vaginal bleeding and urinary frequency. Unfortunately the symptoms of ovarian cancer are nonspecific and are similar to those other more common conditions such as digestive and bladder disorders. Before being diagnosed with ovarian cancer, a woman may be told she has another condition such as irritable bowel syndrome, stress and depression. If the physician suspects ovarian cancer he/she will order additional tests. A physical exam, in which the doctor presses on the abdomen to check for tumors or ascites fluid buildup, as well as a fluid examination, may be conducted. A pelvic exam to check the ovaries and nearby organs for lumps or abnormalities in shape or size may be done along with an ultrasound to get a picture of the ovaries and surrounding tissues. The doctor may also order a blood test to measure the levels of mucinous glycoprotein serum cancer antigen 125 (CA125). After all of these tests are conducted, a biopsy may be required to physically remove tissue from the ovary, as well as surrounding fluid, and have them examined by a pathologist. It is easily seen why most women that receive a diagnosis of ovarian cancer are already at an advanced stage. It would be ideal if the circulating CA125 levels could be used to routinely screen women for ovarian cancer at yearly physicals. However, its measurement lacks the necessary sensitivity and specificity (http://www.cancer.gov/cancertopics/factsheet/Detection/tumor-markers). In fact the US Food and Drug Administration (FDA) only approves the use of CA125 for monitoring the response to ovarian cancer treatment and for detecting its post-treatment recurrence. One of the major issues associated with using CA125 measurement to diagnose ovarian cancer is the large number of false positives that it predicts [2]. Obviously CA125, like the other well-known prostate cancer biomarker prostate-specific antigen, lack the sensitivity and specificity required for diagnosing patients.
6.2 Hypothesis Versus Discovery-Driven Studies
One important change in how cancer research is conducted in the omics-age is perspective. In previous decades where data collection was often challenging most cancer studies were hypothesis driven. In a hypothesis-driven study, the investigator formulates an educated guess to explain a cause-and-effect relationship. A series of experiments are performed to examine this idea and determine if the hypothesis is correct. In a discovery-driven study, the goal is to collect a specific type of data on as many features as possible and use the data to draw a conclusion or formulate a hypothesis. The success of many discovery-driven studies is how well the data can formulate novel specific hypotheses. The advent of technologies that can gather large amounts of data on thousands of biological molecules in clinical samples has driven cancer research towards discovery-driven studies at an exponential rate. A great example is genome-wide association studies (GWAS) [3]. In GWAS, the genomes of different individuals are sequenced to determine how their genes vary. The most common comparisons made in GWAS studies are between healthy individuals and those with a specific disease condition. The aim is to find regions in the genome that can be associated with specific traits such as diseases.
In the field of proteomics, the development of high-throughput technologies has enabled discovery-driven studies as never before. As shown in Fig. 6.1, these studies include biomarker discovery, quantitative proteomics, protein complex characterization, and global proteome characterization. Probably the biggest impact to cancer research has been the ability to conduct discovery driven studies to find cancer-specific biomarkers. The greatest challenge in finding biomarkers for specific cancers is having no a priori information as to the identity (or even character) of a protein biomarker for any cancer. It is even impossible to determine which class of protein (e.g., kinase, phosphatase, membrane, or nuclear) a biomarker likely belongs. Therefore, this type of study is often left to a purely unbiased discovery-driven in which samples from healthy and cancer-affected individuals are compared. In addition, the ability to collect large amounts of data has also impacted how hypothesis-driven proteomic experiments are conducted. For example, protein complexes no longer need to be characterized protein by protein, rather the entire complex can be analyzed in a single experiment. The amount of data collected in an experiment does not necessarily indicate if it is hypothesis-driven or discovery-driven. For example, clinical trials that collect a great deal of patient data are primarily hypothesis-driven as specific outcomes are being monitored. This ability to conduct meaningful discovery-driven studies has provided the basis for the large increase in proteomic biomarker discovery, primarily for cancers. Reasonable or not, biomarker discovery projects begin with essentially no information as to the identity of the protein of interest. The only reliable information available is the source of the samples being analyzed. To understand how proteomics is applied to cancer research it is important to gain an understanding of the major technologies used in this field.
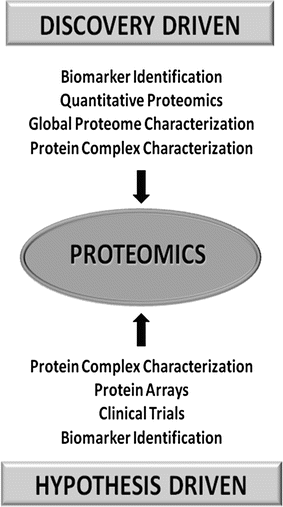

Fig. 6.1
List of discovery-driven and hypothesis-driven studies . In the proteomics era, some studies (such as protein complex characterization and biomarker identification) can be performed using either approach.
6.3 Proteomic Technologies
The previous decade has seen a revolution on how cancer is studied. In times past, cancer research was conducted on a molecule-by-molecule basis, whereas today’s experiments aim to simultaneously uncover large numbers of genes, transcripts, proteins, and metabolites that characterize a specific cancer. The primary driver that introduced this new omics era was technology development. Massively parallel sequencing methods, such as 454 Sequencing, have made surveying entire genomes for genetic aberrations possible [4]. High-density microarrays allow tens of thousands of transcripts to be characterized in a high-throughput fashion [5]. For proteins and metabolites, advances in chromatography and mass spectrometry (MS) have permitted thousands of these molecules to be characterized in complex clinical samples [6, 7].
In the field of proteomics, gone are the days in which cancer was studied at an individual protein level. While fundamental technologies such as Western blotting, enzyme-linked immunosorbent assays (ELISA), immunoprecipitations (IPs), and other methods will continue to be critical in protein analysis, modern proteomic technologies enable cancer to be studied at pathway, network, and global levels. An excellent example of proteomic technologies changing the way a fundamental experiment is conducted is illustrated by the analysis of protein complexes (Fig. 6.2) [8]. Protein complex isolation has been routinely conducted using IPs. Historically, the extracted material has been separated using sodium dodecyl sulfate polyacrylamide gel electrophoresis (SDS-PAGE) and then transferred to a polyvinylidene fluoride (PVDF) membrane. To identify a protein interaction, the PVDF membrane is blotted using an antibody directed against a protein hypothesized to interact with the protein targeted in the IP. While this hypothesis-driven strategy has proven fruitful over the years, it provides a limited amount of information and lacks the ability to find truly novel interactions that fall outside the investigators hypotheses.
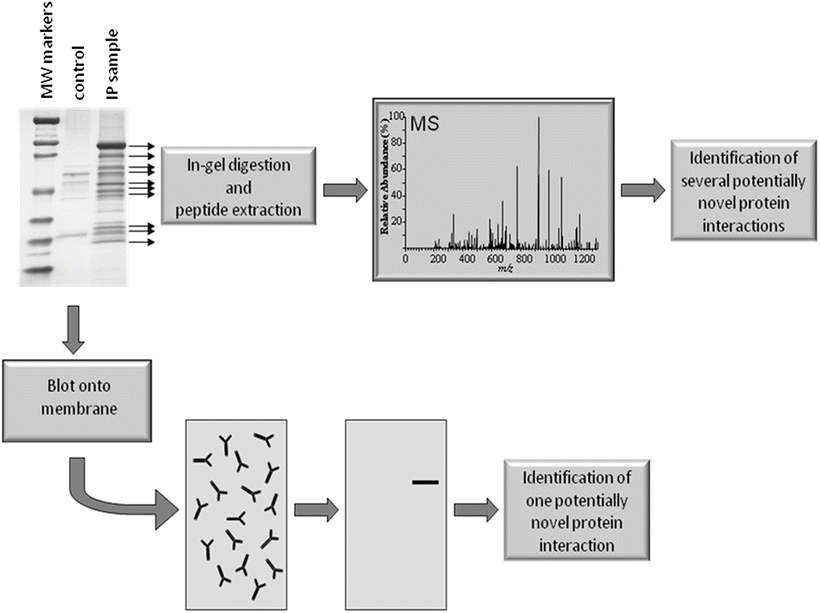

Fig. 6.2
Identifying protein interactions using hypothesis and discovery-driven methods. In a hypothesis-driven approach a protein complex is isolated using a technique such as immunoprecipitation (IP). The complex is separated by gel electrophoresis and the proteins blotted onto a membrane, which is interrogated using an antibody specific for a protein that is hypothesized to interact with the target protein. In the discovery-driven approach the complex is separated using gel electrophoresis, the protein bands are colorimetrically stained, and individually subjected to in-gel digestion. After extracting the peptides from each gel piece, they are individually analyzed using mass spectrometry (MS). While the hypothesis-driven method results in the identification of a single potential protein interaction per experiment, the discovery-driven approach identifies several potentially novel interactions.
The proteomics era has brought the ability to conduct more discovery-driven approaches. For example, in the characterization of protein-protein interactions no longer requires a hypothesis to identify individual proteins, rather the entire complex can be characterized using mass spectrometry (MS). The procedure for characterizing protein complexes using MS is straightforward and incorporates many of the steps used in the hypothesis-driven strategy (Fig. 6.2). The isolated protein complex is separated using SDS-PAGE and rather than transferring the proteins to a PVDF membrane, they are stained using a colorimetric reagent such as Coomassie blue or silver stain. The protein bands are excised from the gel and are subjected to in-gel digestion with a proteolytic enzyme (usually trypsin). Peptides are extracted from the individual gel pieces and identified using MS. The identified peptides are then compared to a proteomic or translated genomic database to determine the origin of the peptides. This discovery-driven approach offers a number of key advantages over hypothesis-driven methods. Several interacting proteins can be identified within a single study, no antibodies (save those used to isolate the complex) are required, and truly novel protein interactions can be identified since any testing does not rely on a formulated hypothesis.
6.3.1 Mass Spectrometry
The greatest fundamental advance that proteomics has contributed to cancer research is in the identification of proteins. While having been a mainstay in biochemistry for over a half-century, the technology used for identifying proteins has seen enormous leaps in the past decade. In the 1950s Edman degradation enabled the sequencing of purified proteins [9]. While Edman sequencing is still in use today, it has been largely replaced by MS. The two primary reasons are throughput and the fact that MS does not require a pure sample to confidently identify a protein. Mass spectrometry is able to identify a single highly purified protein or identify thousands of proteins within a complex mixture. The two main methods used to identify proteins by MS are peptide mapping [10] and tandem MS (MS/MS) [11].
To identify a protein using peptide mapping, it is first enzymatically digested into peptide fragments (Fig. 6.3). Trypsin is by far the most commonly used protease for this purpose owing to its specificity and the relative distribution of lysine and arginine residues throughout proteins in the proteome. The masses of the tryptic peptides are measured using MS and this list of experimental masses is compared to theoretical masses of the tryptic peptides that would result from a tryptic in silico digest of proteins present in a protein or genomic database. The protein is identified based on the best match between the experimental peptide masses and the digest of the proteins within the database. The drawback with peptide mapping is that, although it does not require a pure protein, the best identifications come from samples in which the target protein is highly enriched.
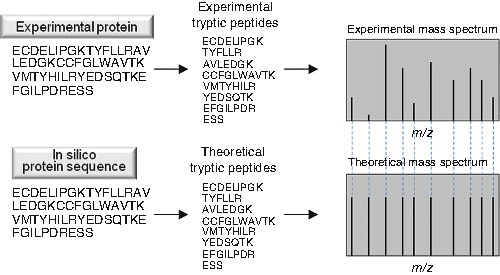

Fig. 6.3
Identification of a protein via peptide mapping . Proteins are digested into peptides (usually tryptic) and their masses are measured using mass spectrometry (MS). The resulting masses are compared to theoretical mass spectra that are generated by an in silico digest of a suitable proteome database. The protein is identified by the correspondence between the list of experimental peptide masses and the in silico digest of each protein within the database.
When using MS/MS for identification (Fig. 6.4), individual peptides enter the mass spectrometer and are isolated within the instrument and collided with an inert gas (i.e., He, Ar, N2, etc.). This process, known as collisional induced dissociation (CID) breaks the peptide into fragments that are then sent to detector. Fortunately, the ways in which peptides fragment are fairly well understood with cleavage across the amide bond one of the favored fragmentation pathways. In addition, CID does not cleave every amide bond in every peptide. The fragmentation results in populations of various lengths of residues both from the N-terminus and C-terminus, as well as internally, being recorded for each peptide. Peptides are identified by how well the fragmentation pattern matches the in silico fragmentation patterns calculated from all corresponding peptides within a database. When the sample is primarily comprised of a single protein, the MS/MS spectra of several peptides are used to confidently identify the protein. When very complex mixtures are being analyzed, the MS/MS spectrum of a single peptide can provide evidence for the presence of a specific protein within the sample. However, the rule is that the more peptides identified, the greater the confidence that the protein is present in the sample. The advantage of MS/MS is that it identifies peptides based on sequence information.
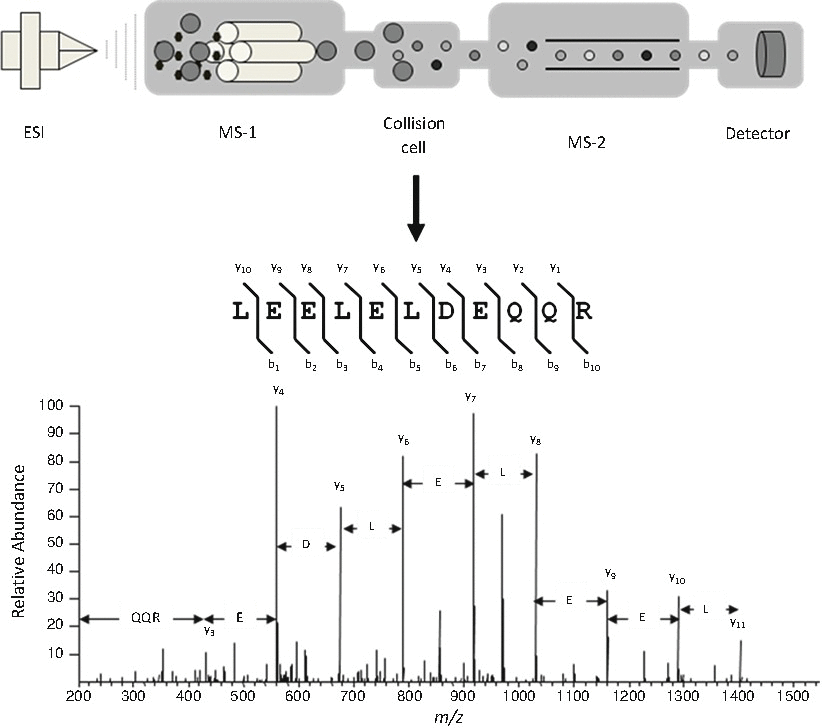

Fig. 6.4
Identification of a protein via tandem mass spectrometry (MS/MS). A specific peptide entering the mass spectrometer (large grey circle) is isolated within the instrument and subjected to collisional induced dissociation (CID). The fragments of the peptide produced by CID are then directed onto the detector where the MS/MS spectrum is acquired. The most common fragmentation occurs across the amide bond creating a series of b and y ions. Software programs compare the MS/MS spectra with proteomic databases to determine the sequence of the peptides subjected to CID.
When combined with high resolution liquid chromatography (LC), modern mass spectrometers can sequence thousands of peptides per hour. For these types of studies, a complex sample (e.g., biofluid, tissue, or cell lysate) is digested into tryptic peptides. These peptides are fractionated by a selected number of chromatography methods prior to being eluted directly into the mass spectrometer. The most commonly used modes of fractionation involve strong cation exchange followed by reversed phase LC. As they enter the mass spectrometer, the instrument isolates individual peptides based on their intensity and subjects them to CID (Fig. 6.5). The MS/MS spectra are then analyzed against a suitable database turning the raw data into identified peptides. The identified peptides are binned to their specific protein of origin. The seminal example of using MS to identify large numbers of proteins in a biological sample was developed by Dr. John Yates’ lab in 2001 [12]. A dual strong cation exchange/reversed-phase LC column was used to separate tryptically digested yeast proteins directly on-line with an ion-trap mass spectrometer. This experiment resulted in the identification of almost 1500 proteins. This multidimensional protein identification technology or MudPIT, as it was coined, was subsequently used by different laboratories to interrogate clinical samples with the ultimate goal of discovering biomarkers. This technique, now commonly referred to as shotgun proteomics , has been used to tremendously increase our knowledge of the proteome of peripheral body fluids such as serum, plasma, and urine. While today investigators have been able to identify upwards of 4000 proteins within complex samples [13–15], the mass spectrometer is still unable to identify all of the proteins within a complex mixture.
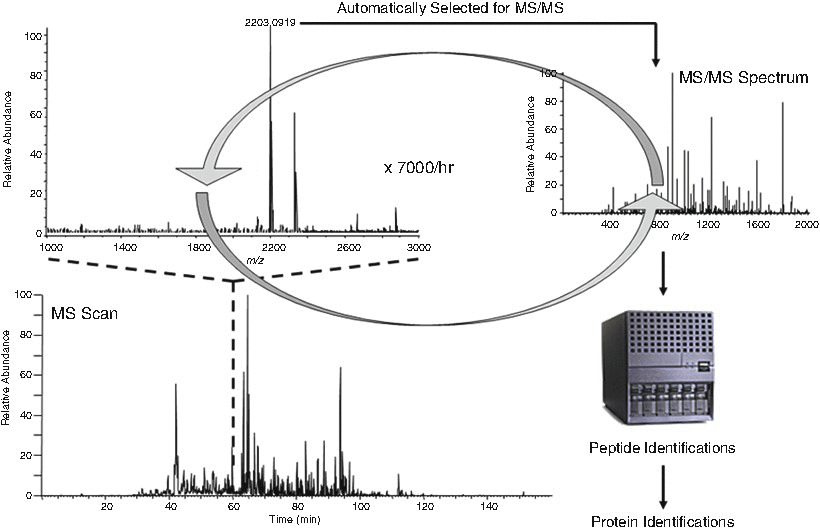

Fig. 6.5
Data-dependent tandem mass spectrometry identification of peptides in complex mixtures. In this method, peptides observed in the MS scan are selected for MS/MS based on their signal intensity. After the MS/MS spectrum of the most intense peptide in the preceding MS scan is acquired, the next most intense peptide signal is selected and so on. After 5–10 peptides are selected the mass spectrometer acquires another MS scan to find new signals from peptides that have eluted into the instrument. This sequence of MS and MS/MS occurs at a rate of approximately 7000 times per hour resulting in the identification of thousands of peptides from complex mixtures.
6.3.2 Protein Arrays
While MS has been the primary tool for advancing cancer research into the proteomics era, protein arrays represent a more directed and potentially more powerful tool to perform broad proteome surveys of different cellular systems. Owing to its dominance, this chapter is devoted to the role of MS in cancer proteomics. However, it is worth including a section to make the reader aware of protein array technologies. While MS will continue to play a dominant role in biomarker discovery, protein arrays will be increasingly important in validation studies. Like ELISA’s, Western blotting, and immunohistochemistry (IHC), protein arrays make use of affinity reagents (primarily antibodies) to measure changes in proteins present within complex samples. Put simply, protein arrays are essentially an attempt to simultaneously conduct hundreds of microscale IHCs, ELISAs, or Westerns. While protein arrays may seem limited since they target specific proteins (hypothesis-driven), large numbers of different antibodies can be used to provide a comprehensive view of protein changes.
Stay updated, free articles. Join our Telegram channel

Full access? Get Clinical Tree


