Cancer Clinical Trials: Design, Conduct, Analysis, and Reporting
Cancer Clinical Trials: Design, Conduct, Analysis, and Reporting
Susan G. Hilsenbeck
Lisa R. Bomgaars
Stacey L. Berg
Outcomes for many forms of childhood cancer have improved greatly over the past 50 years (see Chapter 1). These improvements are largely attributable to the widespread and systematic enrollment of children with cancer in clinical trials that have elucidated diagnostic and prognostic criteria and identified effective therapy for these diseases. Clinical trials produce the data upon which the understanding of current best treatment as well as the choice of the most important questions for subsequent trials are based. In order to generate good data, the study must include clearly stated objectives, an experimental design that will permit the objectives to be accomplished, a data analysis plan that will determine the results objectively and definitively, and a reporting plan that will permit dissemination of the results for use by other clinicians. Every pediatric oncologist should understand the essential principles of clinical trial design and conduct in order to critically evaluate the literature, to offer the best care to his or her patients, and to contribute to further advancements in care for future patients.
PLANNING A CLINICAL TRIAL
Objectives
The first step in planning a clinical trial is to define the objectives clearly. In pediatric clinical trials, the choice of primary study objective is especially critical, because the available patient population is not large enough to provide reliable answers to many experimental questions at once, and it may take several years to enroll enough subjects to complete a single clinical trial in a particular disease. The objectives therefore should reflect the most important unanswered question that is feasible to ask about the particular patient population and disease type. A protocol will usually have one major objective and a number of minor ones. For example, the major objective might be “to determine whether addition of New Drug X to standard therapy improves the 5-year event-free survival of patients with leukemia compared with standard therapy alone.” The secondary objectives might be “to determine the prognostic significance of mutations in the x gene”; “to describe the pharmacokinetic behavior of Drug X”; and so on. It is important to select objectives that will provide useful information regardless of whether the study results are positive or negative; establishing conclusively that a new intervention does not contribute to improved outcomes is as important as identifying advances in therapy.
The parameters for assessing the effects of interventions on individual patients are generally referred to as end points. An end point is a medical event that represents an outcome, either good (e.g., complete remission) or bad (e.g., relapse, death). A well-constructed protocol uses end points that are objective, practical, and relevant to the clinical situation under study. By defining end points, the researcher indicates precisely which measures of outcome will be used to meet the objectives of the protocol. The clinical and laboratory data obtained during the trial are those that are required to determine whether a patient has had the specified events. The research protocol should not attempt to include or collect all interventions that are necessary for good patient care; rather, only those that contribute to the end points should be specified.
Trial Design
Cancer clinical trials are conventionally categorized into three types. A phase 1 trial investigates the adverse events associated with a particular agent or combination of agents and determines the maximum tolerated dose (MTD) or the appropriate dose with a given schedule and route of administration. A phase 2 trial obtains expanded safety data and estimates the activity of the agent against individual tumor types. A phase 3 trial assesses the activity of the agent in a comparative fashion, usually with reference to standard therapy or, in some cases, to the natural history of the disease. Pilot studies, often testing the feasibility of an approach before a large scale study is launched, are designed to obtain intermediate information before definitive studies are conducted.
Phase 1 Trials: Specific Designs
The objective of a phase 1 trial is to select a dose for further evaluation, either the “MTD” or the “recommended phase 2 dose.”1 For cytotoxic drugs it is generally assumed that both efficacy and toxicity increase with the dose; so the goal is to identify the MTD, and the primary end point of dose-finding trials with these agents is toxicity.2 For molecularly targeted agents, there is controversy regarding whether efficacy increases with increased dose.3 In some cases, the appropriate phase 1 objective for these agents may be the determination of the dose that best produces the desired response (the “optimal dose”), rather than the MTD,4 and a co-primary end point may be assessment of the agent’s modulation or inhibition of its target.
The phase 1 protocol should specify the frequency of monitoring for toxicity and what grading scale is to be used, for example, the NCI Common Terminology Criteria for Adverse Events. The grade and types of toxicity that will be deemed dose-limiting toxicities (DLTs), and will determine dose escalation or de-escalation, are also specified ahead of time in the protocol. Common definitions and standards are important to ensure comparability across studies.
Phase 1 designs have two parts: specification of the doses to be tested (dose levels) and rules for moving from one level to the next (dose escalation). In adults, the starting dose for “first in human” oncology phase 1 trials is based on animal toxicology studies and generally is one-tenth the dose lethal to 10% of a cohort of mice, expressed in milligram per square meter (0.1 MELD10).5 Dose levels for successive cohorts are often determined using a modified Fibonacci scheme where the starting dose is increased by 100% in the second level and by 67%, 50%, and so on, in the subsequent levels.6 The diminishing proportion increase reflects increasing caution as the dose gets higher. An alternate version of this scheme is to double the dose until “biologic activity,” such as mild myelosuppression, is observed, and then to institute the diminishing increases of the Fibonacci series.7
In children, phase 1 trials usually start after some adult data on the agent of interest are already available. One efficient method is to start children’s trials at 80% of the adult phase 2 dose, or at 80% of the dose at which biologic activity was observed in adults, bypassing levels that are presumably safe in children but may be too low to be of benefit. These starting doses are presumably close to the childhood MTD, and escalation should proceed cautiously, using approximately 30% increases. The pediatric MTD usually does not exceed 160% of the adult MTD.8 In some cases, a phase 1 approach is used when agents are being combined for the first time. Determining the MTD may be more complex in this setting.9,10
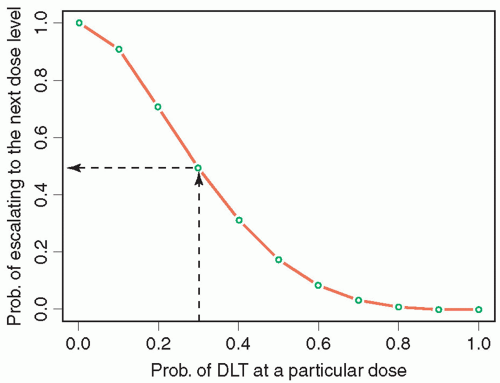
Phase 1 studies use two broad approaches to moving between dose levels: algorithmic and model based.9 The algorithmic designs, which include 3 + 3-like designs and accelerated titration designs, are characterized by prespecified deterministic rules that govern dose escalation or de-escalation. Model-based designs, including continual reassessment (CRM) designs, fit accumulating data to a likelihood or Bayesian dose-toxicity probability model in order to estimate the dose level associated with the target rate of DLT, and to select the next dose level to be tested. The oldest and still most commonly used phase 1 design is the so-called 3 + 3, in which patients are enrolled in cohorts of 3, beginning at the lowest dose level, and are then observed for acute toxicity. If any of these patients is inevaluable for toxicity, he or she is replaced. If none of the three evaluable patients experiences DLT, the dose level is escalated. At any dose level, when DLT is observed in one patient, the cohort is expanded to six patients. The MTD is defined as the dose level immediately below that at which two patients (in a cohort of three to six) experience DLT. Figure 17.1 shows the probability of escalation to the next level for a given probability of DLT at the current dose level. If, for example, the target probability of DLT is 30%, there is a fairly high probability of overshooting or stopping too early. From both past experience and simulations, 3 + 3 designs are widely considered to be safe, but have a tendency to stop too early when the starting level is far below the true MTD. In children, a modification of the 3 + 3 called the “rolling 6”11,12 has been developed to decrease trial duration without increasing the risk of toxicity. This design permits enrollment of up to three additional patients in a cohort as long as no DLTs have been seen in the prior patients. This design performs especially well in simulations when the accrual rate is relatively slow and when inevaluability rates are not negligible, and is routinely used in phase 1 trials by the Children’s Oncology Group.
A recognized limitation of the algorithmic designs is an inability to provide formal estimates or confidence/credible intervals for MTDs or to borrow information across dose levels. That is, in the 3 + 3, only the current dose level information is considered in determining the next dose level; information from other dose levels that have already been studied are ignored. In contrast, the CRM13 targets the dose to an “acceptable” toxicity level selected by the investigators. Either likelihood or Bayesian methods are used to continually update the expected probability of toxicity based on the experience observed up to that point in the study, using all the data. Another advantage of model-based methods is the ability to use the actual dose received, which may vary from the target dose level, especially in small children.14 The Pediatric Brain Tumor Consortium has used a pediatric-focused modified CRM design in recently completed trials of lenalidomide and the gamma secretase inhibitor MK-0752.15,16
Figure 17.1 Graph of probability of escalation to the next dose level in a traditional 3 + 3 phase 1 trial for given probability of DLT at a particular dose level.
Most phase 1 trials are focused on acute toxicity occurring in the first course of therapy, but late or chronic toxicity may also be an important determinant of the clinically relevant dose. An enhancement of the CRM called the time-to-event CRM (TiTECRM) considers toxicity over a longer period of time while still allowing relatively quick escalation decisions.17,18 Finally, as discussed above, for some molecularly targeted agents it is appropriate to perform a combined assessment of toxicity and efficacy or target modulation.19,20 A limitation of this approach is the need for a reliable assay of target modulation.
Phase 1 Trials: Sample Size, Subject Population, and Reporting
Sample sizes for phase 1 trials typically range from 15 to 40 subjects and are driven by the number of dose levels studied and the number of subjects at each level. Analysis and reporting of phase 1 trial results are largely descriptive and include detailed summarization of patient characteristics, observed toxicities, MTD, and consequent recommended phase 2 dose. It is common to perform pharmacokinetic studies as part of phase 1 trials, and those results should be summarized.
Phase 2 Trials: Objectives and End Points
The primary purpose of a “standard” phase 2 trial is to determine whether the new agent is sufficiently promising to warrant further study, usually by comparing the new treatment to a prespecified standard or historical control. More recently, questions addressed by phase 2 studies have become more diverse, with objectives ranging from dose refinement and evaluation of early evidence of efficacy to selection of biomarker-defined subgroups to definitive comparison. Designs are correspondingly diverse.
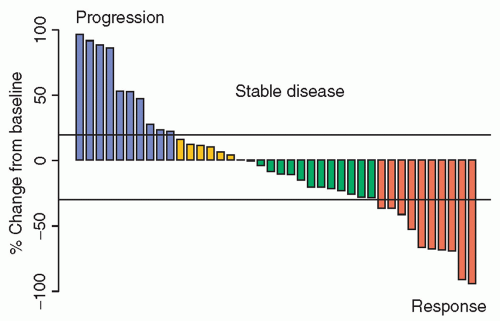
Although the gold standard for evaluation of clinical benefit in oncology is improvement in overall survival, this is rarely a practical outcome to study in phase 2 trials. Instead, the most common phase 2 end point is objective response, usually assessed by the Response Evaluation Criteria in Solid Tumors (RECIST) guidelines21,22 or corresponding leukemia guidelines. Objective response, usually defined as confirmed complete or partial response, is a relatively rapidly assessable binary outcome that represents a direct effect of treatment on the cancer, although it may not accurately reflect clinical benefit. More recently, dissatisfaction with the loss of information due to categorization has resulted in the suggestion to treat response as a continuous variable.23,24 In this approach, response data are often shown as “waterfall plots,” which depict change in tumor size from baseline at a fixed time point (Fig. 17.2), and/or spider plots, which show individual change trajectories over time.25 Theoretically, continuous outcomes provide more information and thus more power for a fixed sample size than dichotomized versions of the same data, and could allow randomized comparison of two or more treatments. One drawback, however, is that small early differences in tumor size may not reflect clinically meaningful effects, perhaps lowering an already low bar for calling a treatment “active,” with the risk that these kinds of phase 2 studies will predict phase 3 success even less well than those using the object response rate to determine drug activity. In addition, accurate measurement of small changes in tumor size is notoriously difficult, and even small errors could seriously bias results. Furthermore, with continuous approaches, it is unclear how to account for the appearance of new lesions, which would automatically be deemed progression by RECIST. An argument for continued use of RECIST criteria, and objective response as a dichotomous or ordinal outcome, is a recent evaluation of alternative cut points for RECIST using a large database of several common adult tumors. The study confirmed a moderate association with long-term outcome (i.e., overall survival), which varied somewhat by tumor type and did not identify improved cut points over the current standard.26
Figure 17.2 Example of a waterfall plot showing change in tumor burden (sum of longest diameters) from baseline.
TABLE 17.1 Comparison of Single-Arm Phase 2 Designs with the Same Operating Characteristics
“Nontoxicities” required to continue to second stage
—
—
—
—
13
N
27
27
28
35
43
Responses required to conclude in favor of drug
6
6
6
7
8
“Nontoxicities” required to conclude in favor of drug
—
—
—
—
30
Expected N when drug is bad (or too toxic)
27
20.4
18.7
18.3
26.1
Other commonly used end points in phase 2 studies include time to tumor progression (where deaths not due to cancer are censored), progression-free survival (PFS; where deaths not due to cancer count as events), event-free survival (see below), overall survival, quality of life, change in molecular biomarkers, and change in functional imaging. “Time to” outcomes can be treated as continuous outcomes or, more commonly and conveniently for purposes of design, can be dichotomized by considering status at a fixed time (i.e., 6-month PFS), and can be used in the same kinds of designs that apply to response as an outcome.
Phase 2 Trials: Specific Designs—Single Arm
Most phase 2 trials use a binary or categorical outcome and include only a single-arm or disease cohort. In pediatric studies, different diagnoses may be included as strata, with the agent evaluated separately in each one. The simplest design has only one stage—accruing, treating, and evaluating the entire sample before drawing a conclusion. The design can be based on attaining a certain confidence interval or a more formal test of hypothesis, usually selected to have good power but more relaxed one-sided type I error rates. Table 17.1, column 1, illustrates a hypothetical study where the uninteresting response rate is p0 = 10%, the response rate that would be clinically interesting is p1 = 30%, the desired probability of spuriously declaring the new treatment to be interesting is α = 5% (one-sided), and the power (1-β error) is 85%. The required sample size N, calculated assuming an underlying binomial distribution for the outcome, is 27, and at the end of the trial we would conclude that the drug is active if six or more responses are observed.27
A disadvantage of one-stage designs is that all the subjects have to be treated before we conclude that the drug is not effective. Multistage or one-sample group sequential designs address this problem by allowing early termination if certain activity criteria are not met in the course of the trial. The Simon two-stage design is by far the most common approach.28 As shown in Table 17.1, column 3, we might accrue 13 patients in the first stage, and only if at least two responses are seen would we proceed to stage 2 to accrue the remainder of the sample. Even with only two stages, for given operating characteristics (i.e., p0, p1, α, and power), there are many possible choices of stage size and decision rule, so that some sort of optimization is necessary. Different approaches involve minimizing the maximum sample size (minimax) and minimizing the “expected” sample size when the response rate is poor (optimal), as well as something in between with good characteristics of both (admissible).29 In our example, the optimal design sample is about 25% larger than the minimax, but the first stage is considerably smaller, possibly allowing an early decision with fewer subjects. Bayesian approaches to phase 2 trials have also been described that incorporate prior information and continually update the estimated probability of response based on the accumulating observations.30,31
Finally, toxicity information available after phase 1 may be based on very limited sample size. Although toxicity is always monitored in phase 2 studies and early stopping or pausing may be considered on an ad hoc basis, it may be prudent to incorporate more formal rules for early stopping in the face of excessive toxicity. Bryant and Day32 suggested adding a Simon-like decision rule (see Table 17.1) where low rates of “nontoxicity” are considered undesirable. The approach assumes that toxicity and response are approximately independent, and has been shown to have reasonably robust performance.33
Phase 2 Trials: Specific Designs—Phase 2 Windows
Both phase 1 and phase 2 studies ideally would be conducted with previously untreated patients to avoid the problems of cumulative toxicity from prior therapy (for phase 1 trials) and acquired tumor drug resistance (for phase 2 trials). Most patients in early-phase pediatric trials, however, have had prior therapy. One strategy to identify drug activity in untreated patients is to perform a brief phase 2 study, usually for 1 or 2 cycles, in newly diagnosed patients before standard therapy begins.34 The major concern regarding this approach is whether delay in starting standard therapy may compromise patient outcome if the agent used in the upfront window is inactive. Therefore, the phase 2 window approach is reserved for patients in high-risk categories where treatment results remain unsatisfactory and identification of active new agents would be particularly helpful. Available data, while limited, show no difference in outcome between patients who did or did not receive a phase 2 window.35,36 When this approach is used, it is imperative that patients and their parents be fully informed about the role and optional nature of upfront window research in the patient’s overall treatment plan.
Phase 2 Trials: Specific Designs—Multiple Arms
The biggest disadvantage of single-arm studies is that they do not permit direct comparison of their results to those of other studies. Formal comparison among interventions is usually performed in randomized phase 3 trials, discussed in detail below. Recently, however, the desire to compare outcomes earlier has led to development of randomized phase 2 designs. Single-arm trials may be preferred when available sample size is small, whereas randomized trials can be beneficial when available sample sizes are larger, or there is greater uncertainty about historical controls, for example, when biomarker-positive cases are posited to have a different prognosis from the general population. Another rationale is the desire to select among two or more competitors. Most “pick the winner” or screening designs are only modestly comparative, however, and have no real ability to determine whether one arm is better. For example, a trial designed to have a high probability (85%) of selecting the treatment that appears to be better, when the true response rates are 30% and 10%, would only need 9 subjects in each group,37 even though this is smaller than the sample size required for a single-arm trial (N = 27) to test whether the response rate of the new treatment is greater than the historical value, and far smaller than the 57 per group that would be needed to compare the response rates of the two treatments definitively. Bayesian adaptive randomization designs have also been proposed in which the randomization probabilities start out equal among the arms, but after a certain number of enrolled subjects, begin to drift in favor of arms with better observed outcomes.38,39 Such methods may prove useful for more rapid paired development of targeted therapy and biomarkers.40 Umbrella trials and basket trials are two novel types of early trials being explored in adult oncology to investigate potential treatment-guiding biomarkers and targeted therapy. Umbrella or “histology-specific” trials study a particular disease, where several biomarkers such as mutations in different genes might be used to direct patients with potentially responsive tumors to different treatments. Basket or aberration-specific trials study one or more targeted therapies in cohorts of patients with different diseases that exhibit the same potential marker(s) of responsiveness.41 These trial designs are likely to become increasingly important as molecularly targeted approaches to treatment are developed.
Only gold members can continue reading. Log In or Register to continue