Epidemiology is one of the cornerstones of public health and provides a key scientific methodology for conducting health-related research. It involves the comparative study of the distribution and determinants of disease and other health-related conditions within defined human populations. Identifying, describing, and interpreting patterns of cancer occurrence (distribution) and studying factors that may cause or contribute to the occurrence, prevention, control, and outcome of cancer (determinants) encompass the activities of epidemiologists.1,2
Epidemiologists incorporate knowledge and research methodologies from the biological, clinical, social, and statistical sciences to study health outcomes. There are two central tenets of chronic disease causation that we can exploit to better understand the distribution and determinants of cancer. First, disease is not randomly distributed; there are measurable factors that influence the patterns and causes of disease within a defined population. Cataloguing these patterns of disease is the principal role of descriptive epidemiology. Second, disease causation is multifactorial. Disease often arises as a result of a multitude of endogenous and exogenous factors. Identifying and measuring the relative contribution and interaction of these factors on disease risk and outcome is the primary goal of analytic epidemiology.
This chapter provides an update of the descriptive epidemiology of childhood cancer, an overview of epidemiologic methods useful in the study of childhood cancers, and an overview of the known risk factors associated with various childhood cancers.
CANCER SURVEILLANCE AND DESCRIPTIVE EPIDEMIOLOGY
Public health surveillance involves the systematic collection, analysis, and interpretation of health data, and the timely dissemination of the findings to prevent and control disease. Surveillance systems are thus essential to plan, implement, and evaluate public health practice.3,4 These systems provide data on disease incidence and mortality on a population basis for policy makers and researchers. In the United States, an exceptionally high-quality cancer surveillance system is funded and coordinated by the National Cancer Institute’s Surveillance, Epidemiology, and End Results (SEER) program. The SEER program was established in 1973 and now encompasses nine state and four large metropolitan cancer registries and registries covering the Alaska Native and Arizona American Indian populations (http://www.seer.cancer.gov). In addition, all states in the United States have cancer registries and report their data to the North American Association for Central Cancer Registries (http://www.naaccr.org), which is supported by the Centers for Disease Control and Prevention.
Data from the SEER program and the other state cancer registries enable evaluation, otherwise unachievable, of rare childhood malignancies and of cancer patterns in demographic subgroups. Descriptive analyses from cross-sectional (prevalence) or ecologic (correlational) studies allow investigators to develop hypotheses on the patterns and causes of cancer and then test those hypotheses using analytic approaches.1,2 The rarity of any specific type of childhood cancer, however, makes it very difficult to recruit enough cases for statistically meaningful studies, even with statewide population-based registries. This problem of conducting good epidemiologic research on rare cancers prompted the Children’s Oncology Group (COG) to develop a nationwide, volunteer childhood cancer registry, the Childhood Cancer Research Network (CCRN).5,6 The CCRN allows newly diagnosed childhood cancer patients and their parents to participate in the data registry with or without the option of being recontacted for future research. More recently, COG initiated Project:EveryChild (http://www.projecteverychild.org), to extend the efforts of the CCRN to include the ability to provide biological specimens on all COG-treated patients. These specimens are becoming increasingly important as we understand more about the biological landscape of cancer and how these features can be exploited to discover the causes of cancer and develop more appropriate therapies. About 90% of children with cancer in the United States are treated on COG protocols; therefore, the CCRN and Project: EveryChild make it possible to perform essentially population-based research on childhood cancer etiology.
Incidence of Cancer among Children and Adolescents
Each year approximately 16,400 children and adolescents younger than 20 years are diagnosed with cancer in the United States (˜12,000 cases among children 0 to 14 years7 and ˜4,400 cases among 15- to 19-year-olds).8 These numbers correspond to an age-adjusted incidence rate for all cancers of 15.8 cases per 100,000 person-years for children and 21.7 per 100,000 person-years for adolescents.9 Childhood cancer remains the leading cause of disease-related mortality among children 1 to 14 years of age, and there were approximately 1,300 cancer-related deaths in 2010 in the United States among children younger than 15 years. The relative contribution of cancer to overall mortality for 15- to 19-year-olds is lower than for the younger children, although approximately 600 deaths from cancer occurred in 2010 in this age group.10
The population-based data for invasive cancer incidence and survival, unless otherwise indicated, are from the SEER program of the National Cancer Institute. The SEER data for this chapter are based on 76,937 cases of childhood and adolescent cancers diagnosed between 1973 and 2010 among residents of 18 SEER areas that represent approximately 28% of the U.S. population. (More information on the inclusion of these SEER areas and their contribution to case data are available from the SEER website.) The mortality data cover all cancer deaths among children in the United States, as provided by the National Center for Health Statistics. The classification scheme used in this chapter is the International Classification of Childhood Cancer, which divides tumors into 12 major diagnostic groups that reflect the most prevalent tumors in the pediatric population.11
Figure 1.1 compares the distribution by percentages of the cancers that occurred among 0- to 14-year-olds and 15- to 19-year-olds for the years 1973 to 2010, whereas Table 1.1 provides the annual incidence of the major types of cancers in these two age groups by gender. In children aged 0 to 14 years, acute lymphoblastic leukemia (ALL) was the most common cancer, accounting for 25.4% of all cancer diagnoses. Acute myeloid leukemia (AML) was the next most common type of leukemia in this age group, occurring at a rate one-fifth that for ALL. Central nervous system (CNS) cancers, primarily occurring in the brain, accounted for 20.6% of cancer diagnoses, and together with ALL and AML, made up 50% of cancer diagnoses among children younger than 15 years. The most common non-CNS solid tumor in the 0- to 14-year age group was neuroblastoma (7.0%), followed by Wilms tumor (5.4%) and non-Hodgkin lymphoma (NHL) (5.9%). Other diagnoses that individually represented 2% to 4% of cancer diagnoses in this age group included Hodgkin disease, rhabdomyosarcoma, nonrhabdomyosarcoma soft tissue sarcomas, germ cell tumors, retinoblastoma, and osteosarcoma.
The distribution of cancer diagnoses for 15- to 19-year-olds is significantly different (Fig. 1.1). For example, Hodgkin disease (16.0%) and germ cell tumors (13.7%) were the most frequently diagnosed cancers. The percentages of cases represented by NHL (8.0%), melanoma (7.0%), thyroid cancer (8.7%), nonrhabdomyosarcoma soft tissue sarcoma (6.0%), osteosarcoma (4.1%), and Ewing sarcoma (2.0%) were also higher for 15- to 19-year-olds than for 0- to 14-year-olds. Although CNS tumors were the third most common tumor type, representing 9.7% of all cancer diagnoses (Fig. 1.1), their incidence was lower for 15- to 19-year-olds than for 0- to 14-year-olds (Table 1.1). ALL accounted for a much lower proportion of cases among 15- to 19-year-olds (7.5%) than among children 0 to 14 years (25.4%), and occurred only slightly more frequently than AML (4.3% of cases) in this age group. The percentages of rhabdomyosarcoma and nonrhabdomyosarcoma soft tissue sarcoma were nearly equal among 0- to 14-year-olds, but the percentage of nonrhabdomyosarcoma soft tissue sarcoma was higher than that for rhabdomyosarcoma among 15- to 19-year-olds (Fig. 1.1). Some cancers that are more common in young children (e.g., CNS cancers, neuroblastoma, retinoblastoma, hepatoblastoma, and Wilms tumor) occurred at very low rates among 15- to 19-year-olds (Table 1.1).
Cancer Incidence by Sex
Table 1.1 shows the incidence of cancer by sex for children (<15 years) and adolescents (15 to 19 years). For children <15 years of age, cancer diagnoses that showed a male predominance were ALL, Hodgkin lymphoma, NHL, retinoblastoma, hepatoblastoma, Ewing sarcoma, rhabdomyosarcoma, and nasopharyngeal carcinoma, whereas female children showed a predominance for thyroid cancer. For adolescents, the patterns of incidence by gender were generally similar to those observed in younger children, but with the following exceptions: (a) Hodgkin disease among younger children occurred at a higher incidence among males, whereas among adolescents Hodgkin disease occurred equally between males and females; (b) germ cell tumors occurred equally between males and females among younger children; however, males had a 3.2-fold higher rate among adolescents; (c) osteosarcoma occurred at similar rates in males and females in the 0- to 14-year-old population, although the rate was 1.7-fold higher in males among 15- to 19-year-olds; and (d) the male predominance for Ewing sarcoma was more pronounced in the 15- to 19-year-old group (2.0-fold higher) than in younger children (1.4-fold higher). Among adolescents, females showed a predominance of Wilms tumor and melanoma.
Figure 1.1 Distribution of specific cancer diagnoses for children (0 to 14 years) and adolescents (15 to 19 years), 1973 to 2010. Percent distribution by International Classification of Childhood Cancer diagnostic groups and subgroups for younger than 15 years and 15 to 19 years of age (all races and both sexes). ALL, acute lymphoblastic leukemia; CNS, central nervous system; RMS, rhabdomyosarcoma; STS, soft tissue sarcoma. (Incidence data are from the Surveillance, Epidemiology, and End Results [SEER] program, National Cancer Institute.)
TABLE 1.1 Incidence of Different Cancers by Gender for the 0- to 14-Year-Old and 15- to 19-Year-Old Populations (2000 to 2010)
Diagnosis
<15-Year-Old Population
15-19-Year-Old Population
Incidence Rate
Incidence Rate
Both Sexes
Male
Female
M:F Ratio
Both Sexes
Male
Female
M:F Ratio
Acute lymphoblastic leukemia (ALL, Ia)
40.0
43.6
36.3
1.2
17.5
22.9
11.7
2.0
Acute myeloid leukemia (Ib)
7.8
8.3
7.4
1.1
9.6
9.6
9.7
1.0
Hodgkin disease (IIa)
5.8
6.9
4.7
1.5
30.3
29.2
31.5
0.9
Non-Hodgkin lymphoma (IIb, c, e)
9.2
12.2
6.1
2.0
18.1
22.9
12.9
1.8
Central nervous system tumors (III)
32.8
34.3
31.2
1.1
20.3
21.9
18.6
1.2
Neuroblastoma (IVa)
10.2
10.3
10.1
1.0
0.4
0.5
0.3
1.7
Retinoblastoma (V)
4.3
4.6
4.0
1.2
—
—
—
—
Wilms tumor (VIa)
7.7
7.4
8.0
0.9
0.3
0.2
0.5
0.4
Hepatic tumors (VII)
2.6
3.2
1.9
1.7
1.3
1.6
1.0
1.6
Hepatoblastoma (VIIa)
2.1
2.7
1.6
1.7
—
—
—
—
Malignant bone tumors (VIII)
6.9
7.2
6.6
1.1
14.4
18.3
10.3
1.8
Osteosarcoma (VIIIa)
4.0
3.8
4.1
0.9
8.4
10.6
6.1
1.7
Ewing sarcoma (VIIIc)
2.3
2.6
1.9
1.4
3.9
5.2
2.6
2.0
Rhabdomyosarcoma (RMS, IXa)
5.3
5.9
4.6
1.3
3.4
4.0
2.8
1.4
Non-RMS soft tissue sarcoma (IXb, c, d, e)
5.6
5.9
5.3
1.1
12.7
12.7
12.7
1.0
Germ cell/other gonadal tumors (Xa, b, c)
5.7
5.3
6.1
0.9
27.4
41.1
12.7
3.2
Thyroid carcinoma (XIb)
2.3
1.1
3.6
0.3
19.8
7.0
33.3
0.2
Nasopharyngeal carcinoma (XIc)
0.3
0.4
0.1
4.0
1.3
1.8
0.8
2.3
Malignant melanoma (XId)
2.0
1.9
2.2
0.9
14.9
12.0
18.1
0.7
Total
155.1
164.5
145.1
1.1
211.0
222.5
198.8
1.1
Rates are per 1,000,000, and the <15-year rates are age-adjusted to the 2000 U.S. standard population. The roman numerals in parentheses represent the International Classification of Childhood Cancers category for each tumor type.
Cancer Incidence by Race and Ethnicity
For many adult cancers, black Americans have higher incidence rates than white Americans. However, for children and adolescents, the incidence of cancer among white children was approximately 50% higher than that for black children (Table 1.2). The largest difference in absolute incidence between white children and black children was for ALL (33.6 vs. 17.0 per million). The higher rates for leukemia were limited to ALL, as white children and black children had identical rates for AML (Table 1.2). The incidence of Ewing sarcoma in white children was 6.2 times higher than that in black children. For melanoma, white children had incidence rates 22 times higher than those in black children (Table 1.2). However, black children had a higher incidence of nasopharyngeal carcinoma (ratio, 5.0), retinoblastoma (ratio, 1.25), and osteosarcoma (ratio, 1.28) than did white children.
In contrast to black children, Hispanic children had higher rates of ALL than did white children (44.8 per million vs. 33.6 per million) (Table 1.2). Hispanic children had a higher rate of AML (9.0 per million), compared with both white (7.9 per million) and black (7.8 per million) children. However, the overall cancer incidence for Hispanic children was lower than that for white children because of lower rates for CNS tumors, lymphomas, neuroblastoma, and Ewing sarcoma. The incidence of leukemia was similar for Asian/Pacific Islander children and white children, but Asian/Pacific Islander children had lower rates of CNS tumors and lymphomas. American Indian/Alaska Native children had among the lowest incidences for almost all cancers, except AML, for which they have the highest incidence (10.4 per million).
Survival among Children and Adolescents with Cancer
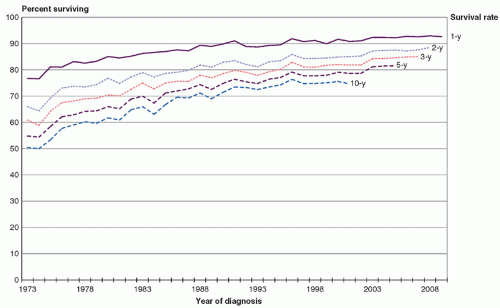
Survival rates for children 0 to 14 years of age have improved markedly since the 1960s, when the overall 5-year survival rate after a cancer diagnosis was estimated as 28%. Improvements in survival rates have continued into the early 2000s in the United States (Fig. 1.2), with 3-year and 5-year survival rates exceeding 80% for children and adolescents diagnosed during this period. In fact, 10-year survival rates have exceeded 75%, looking at those diagnosed in 2000 (the most recent data available for this rate). However, this trend of increasing survival seems to have plateaued over the last decade.
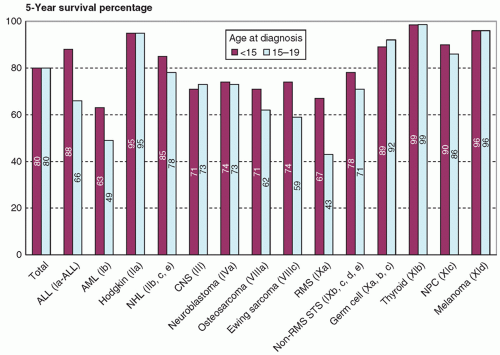
Five-year survival rates (Fig. 1.3) for children aged 0 to 14 years diagnosed between 2001 and 2005 (most recent data) were best for thyroid cancer, melanoma, Hodgkin disease, nasopharyngeal carcinoma, germ cell tumors, and ALL. The worst survival in this age group was seen among children diagnosed with AML and rhabdomyosarcoma.
Five-year survival rates for 15- to 19-year-olds were similar to those for younger children for most cancer types, including thyroid cancer, melanoma, nasopharyngeal carcinoma, CNS tumors, Hodgkin disease, neuroblastoma, non-RMS soft tissue sarcomas, and germ cell tumors (Fig. 1.3). Survival rates for 15- to 19-year-olds with ALL were lower than those for younger children, which could be due, in part, to a higher proportion of cases with unfavorable biology among 15- to 19-year-olds. A similar explanation may explain the lower survival rates for 15- to 19-year-olds with rhabdomyosarcoma. Five-year survival rates were also lower among adolescents diagnosed with Ewing sarcoma, osteosarcoma, and AML.
TABLE 1.2 Incidence of Different Cancers by Race/Ethnicity for 0- to 19-Year-Old Populations (2000 to 2010)
Diagnosis
Incidence Rate
Ratio
White
Black
Hispanic
Am Ind
API
B:W
H:W
Acute lymphoblastic leukemia (ALL, Ia)
33.6
17.0
44.8
30.5
30.3
0.51
1.33
Acute myeloid leukemia (Ib)
7.9
7.8
9.0
10.4
8.2
0.99
1.14
Hodgkin disease (IIa)
14.1
9.7
10.1
5.0
8.0
0.69
0.72
Non-Hodgkin lymphoma (IIb, c, e)
12.4
11.1
9.7
8.0
10.7
0.90
0.78
Central nervous system tumors (III)
35.6
23.0
24.3
17.3
20.7
0.65
0.68
Neuroblastoma (IVa)
9.8
6.9
5.1
4.3
5.8
0.70
0.52
Retinoblastoma (V)
2.8
3.5
3.5
3.2
3.4
0.70
1.25
Wilms tumor (VIa)
6.4
6.6
5.0
6.8
3.0
1.00
0.78
Hepatoblastoma (VIIa)
1.6
0.7
1.8
2.4
2.3
0.44
1.13
Osteosarcoma (VIIIa)
4.7
6.0
5.7
2.9
4.3
1.28
1.21
Ewing sarcoma (VIIIc)
3.7
0.6
2.3
2.5
1.6
0.16
0.62
Rhabdomyosarcoma (RMS, IXa)
5.1
5.4
4.4
4.2
3.5
1.06
0.86
Non-RMS soft tissue sarcoma (IXb, c, d, e)
7.6
7.9
7.1
5.1
5.2
1.04
0.93
Germ cell/other gonadal tumors (Xa, b, c)
11.2
5.9
13.6
7.0
11.5
0.53
1.21
Thyroid carcinoma (XIb)
8.3
2.0
5.9
7.0
6.3
0.24
0.71
Nasopharyngeal carcinoma (XIc)
0.3
1.5
0.4
0.7
0.8
5.00
1.33
Malignant melanoma (XId)
8.9
0.4
1.5
0.4
1.3
0.05
0.17
Total
185.2
126.8
165.1
132.2
137.9
0.68
0.89
Am Ind, American Indian/Alaska Native; API, Asian/Pacific Islander.
Rates are per 1,000,000 and are age-adjusted to the 2000 U.S. standard population. The roman numerals in parentheses represent the International Classification of Childhood Cancers category for each tumor type.
Figure 1.2 Trends in relative survival rates for all childhood cancers, age 0 to 19 years (all races and both sexes), for Surveillance, Epidemiology, and End Results (SEER) program regions, 1973 to 2010. (Data are from the SEER program, National Cancer Institute.)
Figure 1.3 Five-year survival for 0- to 14-year-olds and for 15- to 19-year-olds diagnosed between 2001 and 2005 in Surveillance, Epidemiology, and End Results (SEER) program regions, 1973 to 2010. Rates are for all races and both sexes. ALL, acute lymphoblastic leukemia; AML, acute myeloid leukemia; CNS, central nervous system; NHL, non-Hodgkin lymphoma; non-RMS STS, nonrhabdomyosarcoma soft tissue sarcoma; RMS, rhabdomyosarcoma; NPC, nasopharyngeal carcinoma. (Data are from the SEER program, National Cancer Institute.)
Figure 1.4 shows the distribution of causes of cancer death for 0- to 14-year-olds (Fig. 1.4A) and 15- to 19-year-olds (Fig. 1.4B) in 2010. Overall, these proportions have remained fairly constant over time. Approximately one-third of cancer-related deaths among children were caused by leukemias, and another third were due to CNS tumors. The other primary causes of cancer-related mortality among children were neuroblastoma (classified under endocrine tumors), bone tumors, and soft tissue sarcomas. For adolescents, one-third of cancer-related deaths were due to leukemias, 20% due to CNS tumors, and 15% due to bone tumors. Soft tissue sarcomas and NHL were the other primary contributors to cancer-related deaths among adolescents.
Only gold members can continue reading. Log In or Register to continue