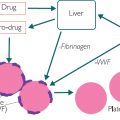
Figure 1.1: Composition of whole blood, serum and plasma
The main disadvantage of using serum is that the blood has already clotted. In other words, a series of metabolic processes occurred after the sample was collected but before the sample was measured. This can lead to errors in measuring such elements as potassium, phosphate, magnesium, aspartate aminotransferase, lactate dehydrogenase, serotonin, neurone-specific enolase and zinc content. The advantage is that serum can be used to measure constituents that would be destroyed or compromised by the anticoagulant chemicals used in the preparation of plasma samples such as serum protein electrophoresis (SPEP).
The main disadvantage of using plasma (blood that has not clotted, due to the addition of anticoagulants) is that the anticoagulants can interfere with certain analytical methods or change the concentration of the constituents being measured. The advantages of using plasma samples include ‘cleaner’ samples that have not undergone the clotting process, time saving and a higher yield (up to 20%).
Different types of anticoagulants are denoted by different-coloured caps on collection tubes. Typical anticoagulants include sodium heparin (green), sodium fluoride (grey), sodium citrate (blue) and EDTA (lavender). Your local healthcare setting will have a tube guide showing the active component of the tube. A clear cap means that neither a clot-activating (serum) nor an anticoagulant (plasma) is present; these clear-capped tubes are often used as discard tubes. The order of draw can be important if multiple tubes are used, to avoid contamination from one tube to the next. Check with your local healthcare setting, but a typical order of draw using the vacutainer system would be:
1Blood culture
2Sodium citrate (light blue) for coagulation testing (PT, INR, aPTT) and D-Dimer
3Serum (red) for LDH, ionised Ca, drugs (phenytoin, theophylline, methotrexate, lithium), vitamin D, parathyroid hormone, osmolality, bone markers, endocrine testing (excluding thyroid)
4Serum separator tube (SST) (gold) for thyroid function (TSH, FT4, T3, cortisol), nutritional markers (gastrin, B12 folate, ferritin), tumour markers (PSA, CEA, AFP, HCG, CA125, CA19.9, CA15.3), immunoglobulins (IgG, IgA, IgM, IgE), electrophoresis, CRP, thyroid Ab, liver Ab, rheumatology Ab
5Plasma separator tube (PST) (light green) for U&Es, LFTs, cardiac enzymes, Ca, Mg, phosphate, uric acid, total protein, amylase, lipids, bone profile, troponin, iron status
6EDTA (lavender) for full blood count (FBC) and ESR, haemoglobin A1c, homocysteine (send on ice and state time), ACTH
7Cross match (pink) for blood transfusion samples
8Fluoride oxalate (grey) for glucose
9Trace element (royal blue) for lithium and magnesium
Haemolysed samples
If, following centrifugation, the plasma or serum looks reddish rather than straw yellow, the sample has probably haemolysed. In a haemolysed sample, some of the red blood cells have lysed (broken open) and their contents will have contaminated the plasma or serum sample. This will cause errors in reporting, for example, elevated potassium, magnesium and phosphate. The laboratory may be able to negate the effect of using a haemolysed sample if the result is needed urgently or it is difficult to obtain another sample. Common reasons for the sample being haemolysed include:
•the collection needle gauge being too narrow
•over-vigorous shaking of the sample
•an underlying haematological disorder
•red cells being isolated for storage and then stored in water or a non-isotonic solution
•over-vigorous dispensing of blood from the hypodermic syringe to collection tubes.
Reference ranges
Most people are comfortable with the idea of reference ranges, but what do they actually tell us? Or, rather, what don’t they tell us? To create a reference range, a number of volunteers (usually over 120) are matched for factors such as age, gender and ethnicity, and the analyte of interest is then measured. Firstly, most ranges have a 95% confidence, which means that the top 2.5% of values and the bottom 2.5% of values are omitted. In other words, it is possible to be healthy but outside the reference range because you are at the very top or the very bottom, neither of which are shown. Secondly, you should use ranges from unvalidated sources with great care, as ranges can vary with age and gender and local population. Best practice is to use the range that is presented with the actual value.
Storytelling: If you measured the height of 120 shoppers at a supermarket, the world’s smallest man and the world’s tallest man might be present and be included in your sample. However, it’s unlikely that you’ll see them again, so the top and bottom of the data is cropped, leaving more of the average making up the range. This is the first problem with reference ranges. Of the healthy cohort, around 5% are excluded at this initial stage, leaving them outside the range.
Range hangover
As we have seen, reference ranges refer to us on ‘good day’ or peak health. However, most of our patients will be ‘out of range’ so we need a strategy to deal with this. Firstly, let’s consider the idea of range hangover.
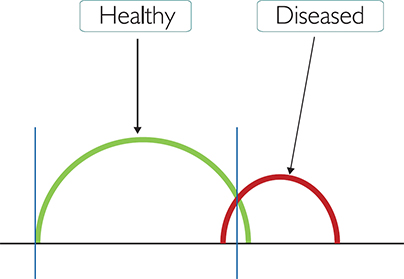
Figure 1.2: Range hangover
In Figure 1.2 (above), the x-axis shows the increase in number from left to right. The green line represents a healthy (usually asymptomatic) individual and the red line a patient with a disease (usually symptomatic). The two blue vertical lines represent the reference range. The line on the left is the lowest value and the one on the right is the highest. Because the upper range blue vertical has been drawn in a particular place (called the cut-off value), some of the green line ‘overhangs’. This means that the patient who is healthy may be reported ‘out of range’.
Clinical sensitivity and specificity
Because most blood tests have an associated pathology but may not be very accurate in detecting a specific disease, they sometimes produce ‘false positives’. Clinical specificity refers to whether the test can correctly report someone without the disease as being ‘healthy’. Conversely, clinical sensitivity refers to whether the test can correctly report someone with the disease as being ‘diseased’.
The terms used to describe this are:
•True negative (TN): patient is healthy and blood test result is within reference range
•True positive (TP): patient has condition and blood test result is outside the reference range
•False negative (FN): patient has condition but the blood test result falls within the normal reference range
•False positive (FP): patient is healthy but the blood test result is outside the reference range.
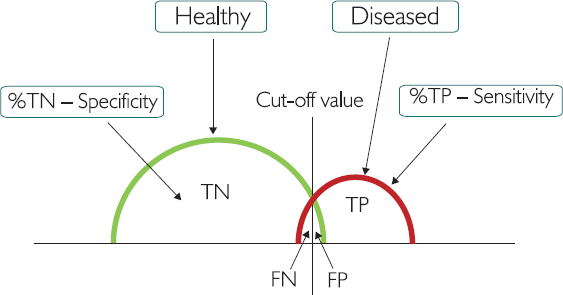
Figure 1.3: The cut-off value between ‘healthy’ and ‘diseased’
The cut-off value is the point at which people change from being labelled ‘healthy’ to being labelled ‘diseased’, or the reverse. If we move the cut-off value to the far right, everyone who is healthy will be reported as healthy, but more diseased people will be missed (because they are wrongly labelled healthy). If we move the cut-off value to the far left, everyone who is diseased will be reported as diseased, but more healthy people will be wrongly labelled ‘diseased’. At this point, we need to consider factors such as cost of screening, reliability of data and (most importantly) medical ethics. Is telling someone they have cancer when they don’t as serious as missing someone who does have cancer?
Clinical decision limits (CDLs)
A clinical decision limit (CDL) allows us to prepare protocols and flow charts and consider patient journey management which often informs what we do next.
If we look again at the range hangover diagram (Figure 1.2) but this time add several arbitrary additional cut-off values, we can give each of these a letter and assign typical conditions and actions to each one. (Remember to seek local confirmation as these are only examples to illustrate the theory.)
In Figure 1.3 (below) the disease group is divided into sections A to D, based on the values being 2-fold, 4-fold and 10-fold higher than the upper range.
In practice, if we consider the liver enzyme alanine aminotransferase (ALT) this usually has an upper limit of 40. Our CDLs may therefore look as follows:
•‘Normal’ reference range for ALT = (10–40)
•Group A = a blood test result for ALT between 40 and 80 (2x the upper normal limit of 40)
•Group B = a blood test result for ALT between 80 and 160 (4x the upper normal limit of 40)
•Group C = a blood test result for ALT between 160 and 400 (10x the upper normal limit of 40)
•Group D = a blood test result for ALT over 400 (greater than 10x the upper normal limit of 40)
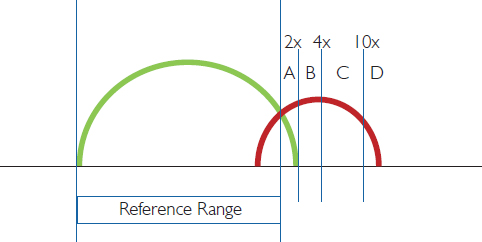
Figure 1.3: The cut-off value between ‘healthy’ and ‘diseased’
Strategy for values outside the range
Quite often the patient’s blood test results will fall outside the reference range. As blood test results take the form of numbers and are not binary (like a broken arm), they can be viewed subjectively. It may be helpful to ask yourself the following questions:
1How close is the value to the limits of the reference range? Consider FN, FP, TN, TP, and the mathematical limitations of reference ranges discussed above. This point is about the inherent variance in the range, person, blood sample, and so on.
2Has the test been repeated?
3Is the value increasing or decreasing over time?
4Has the patient had surgery or intervention? An elevated range of inflammatory markers, such as C-reactive protein (CRP), erythrocyte sedimentation rate (ESR) and interleukin 6 (IL6) would be expected post-surgery.
5Does the blood test fit with other ‘indices’ or family markers? Most tests fit into a family group (Hb, RBC and Hct). This point will be further explored in the case study in Chapter 4.
6Is it clinically relevant? The patient may have competing pathologies. Some values will therefore be outside the range because they represent a pathology or condition that is being managed, such as chronic obstructive pulmonary disease (COPD), alcoholism or diabetes. You may be looking for a new out-of-range value or an unusually high value.
7Will it change the patient’s treatment? Before requesting the test, consider what you will do with the result and why you are requesting it.
However, you should bear in mind that the above questions should always be used in conjunction with local clinical procedures in your own healthcare setting.
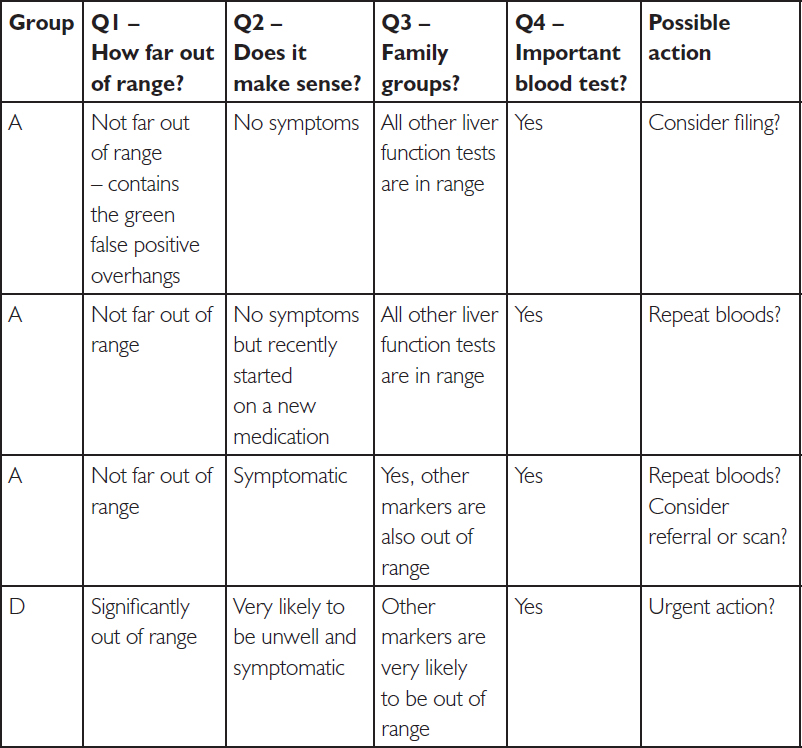
We may therefore choose to do the following by applying the four key questions we outlined earlier:
Question 1: How far out of range is the result?
Question 2: Does it make sense? Is the patient symptomatic?
Question 3: Do the other family group blood tests agree?
Question 4: Is this an important blood test?
You may choose to construct a decision table.
I have made a start on one below.
Example clinical decision table for the liver enzyme ALT:
We can do this with any blood tests. Let’s try C-reactive protein, which increases with more cellular damage (inflammation). This one is a little trickier, given the timing of CRP and the white cell response (see Chapters 7, 8 and 11).
Example clinical decision table for the inflammatory marker CRP:
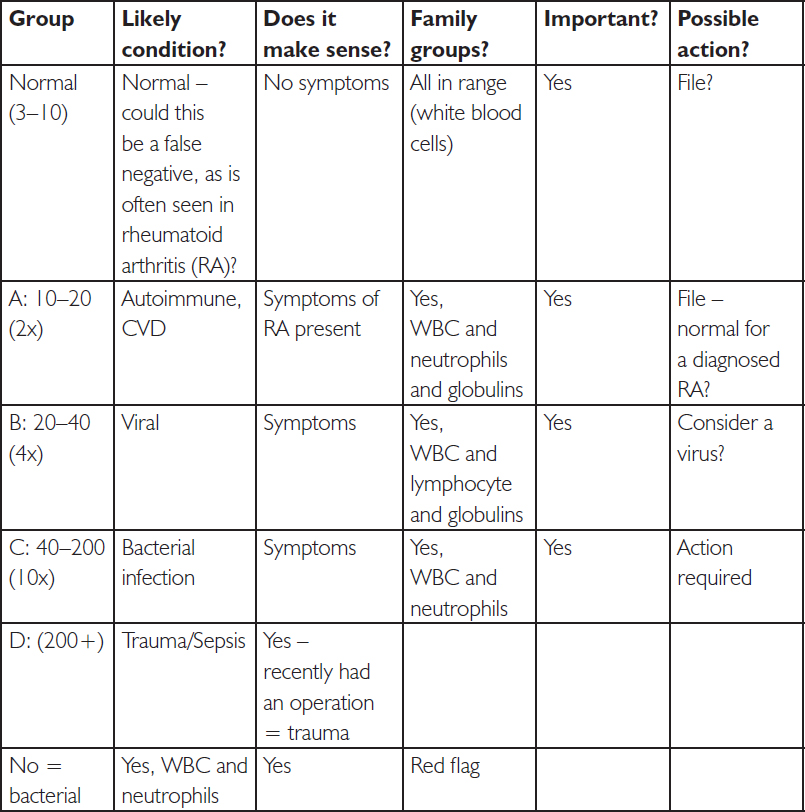
There are lots of examples of CDLs being used, from tracking troponin levels in heart attacks to the level of creatinine kinase (CK) in rhabdomyolysis. We then have the extra challenge from the four questions, linked to family groups. We need to ask what we are actually measuring, in order to propose likely actions.
Please note that in these examples we have looked at a pathology which increases blood test values. In patterns of anaemia, for example, the cut-off groups A–D would be less than normal.
Self-assessment
1.Name two components of the blood. Can you give an example of each type?
2.List four ways in which the blood can change, using words that make sense to you.
Can you list some examples for each type of change?
3.What are the four questions you need to consider when reviewing a blood test?
4.Using symptoms and blood test results, define ‘false positive’ and ‘false negative’.
Can you give any examples?
Quick reference glossary
The following table shows common terms, abbreviations and some typical observations relating to the various blood tests. Some examples also have metaphors, shown in quotation marks, to aid memory and understanding. These will be explained further in the corresponding chapters.
Table 1.1: Glossary of terms used in blood tests
Stay updated, free articles. Join our Telegram channel

Full access? Get Clinical Tree


 urea
urea to Na levels
 to cardiac markers/chest pain
 to RBC, MCV and folate to differentiate between alcohol, B12 and diabetes neuropathies