and Christian Waldherr1
(1)
Bern, Switzerland
The Breast Imaging Reporting and Data System (BI-RADS) was developed in 1993 by the American College of Radiology (ACR) to standardize mammographic reporting, to improve communication, to reduce confusion regarding mammographic findings, to aid research, and to facilitate outcomes monitoring. It contains a lexicon of standardized terminology (descriptors) for mammography, breast US, and MRI, as well as chapters on Report Organization and Guidance Chapters for use in daily practice. Because breast tomosynthesis (three dimensional, or 3D, mammography) only unmasks and highlights the morphology of mammographic findings, the descriptors of the BI-RADS lexicon can be easily adopted for use. The standard reporting includes the description of the breast composition (ACR a-d, previously ACR 1-4) as well as the description of any significant finding using standardized morphological descriptors. These descriptors eventually guide to a final assessment category, a measure of how likely is malignancy (BI-RADS categories 0–6).
The following tables from the BIRADS 2013 edition illustrate the system of reporting and name the descriptors.
Table 2.1
Standard reporting
Standard reporting | ||
|---|---|---|
1. Indication | ||
2. Breast composition | → | Composition: a-b-c-d |
3. Important findings | → | Mass |
Asymmetry | ||
Architectural distortion | ||
Calcifications | ||
Associated features | ||
4. Comparison to previous studies | ||
5. Final assessment category | ||
6. Give management recommendations | ||
7. Communicate unsuspected findings with the referring clinician | ||
Table 2.2
Descriptors
Mammography lexicon | Ultrasound lexicon | |||||
|---|---|---|---|---|---|---|
Breast composition | A. Entirely fatty B. Scattered areas of fibroglandular density C. Heterogeneously dense, which may obscure masses D. Extremely dense, which lowers sensitivity | Breast composition | (a) Homogeneous – fat (b) Homogeneous – fibroglandular (c) Heterogeneous | |||
Mass | Shape | Oval, round, irregular | Mass | Shape | Oval, round, irregular | |
Margin | Circumscribed, obscured, microlobulated, indistinct, spiculated | Margin | Circumscribed or not circumscribed: indistinct, angular, microlobulated, spiculated | |||
Density | Fat, low, equal, high | Orientation | Parallel – not parallel | |||
Asymmetry | Asymmetry, global, focal, developing | Echo pattern | Anechoic, hyperechoic, complex cystic/solid hypoechoic, isoechoic, heterogeneous | |||
Architectural distortion | Distorted parenchyma with no visible mass | Posterior features | No features, enhancement, shadowing, combined pattern | |||
Calcifications | Morphology | Typically benign | ||||
Suspicious | 1. Amorphous 2. Coarse heterogeneous 3. Fine pleomorphic 4. Fine linear or fine linear branching | Calcifications | In mass, outside mass, intraductal | |||
Distribution | Diffuse, regional, grouped, linear, segmental | Associated features | Architectural distortion, duct changes, skin thickening, skin retraction, edema, vascularity (absent, internal, rim), elasticity | |||
Associated features | Skin retraction, nipple retraction, skin thickening, trabecular thickening, axillary adenopathy, architectural distortion, calcifications | Special cases (case with a unique diagnosis) | Simple cyst, clustered microcysts, complicated cyst, mass in or on skin, foreign body (including implants), intramammary lymph node, AVM, Mondor disease, postsurgical fluid collection, fat necrosis | |||
Table 2.3
Final assessment categories (BIRADS 0-6)
Category | Management | Likelihood of cancer | |
|---|---|---|---|
0 | Need additional imaging or prior examinations | Recall for additional imaging and/or await prior examinations | n/a |
1 | Negative | Routine screening | Essentially 0 % |
2 | Benign | Routine screening | Essentially 0 % |
3 | Probably Benign | Short-interval follow-up (6 month) or continued | >0 % but ≤2 % |
4 | Suspicious | Tissue diagnosis | (4a) Low suspicion for malignancy (>2 % to ≤10 %) (4b) Moderate suspicion for malignancy (>10 % to ≤50 %) (4c) High suspicion for malignancy (>50 % to <95 %) |
5 | Highly suggestive of malignancy | Tissue diagnosis | ≥95 % |
6 | Known biopsy proven | Surgical excision when clinical appropriate | n/a |
The following sections provide examples of breast tomosynthesis for the descriptors.
2.1 Breast Composition
The fifth edition of Breast Imaging-Reporting and Data System (BI-RADS) Atlas included changes in breast density reporting categories.
The new breast composition categories are:
The breasts are almost entirely fatty, ACR a.
There are scattered areas of fibroglandular density, ACR b.
The breasts are heterogeneously dense, which may obscure small masses, ACR c.
The breasts are extremely dense, which lowers the sensitivity of mammography, ACR d.
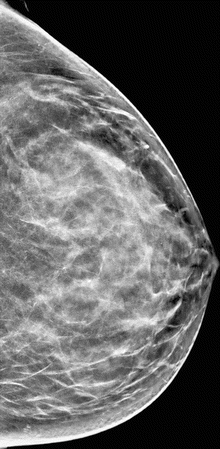
ACR 1/a
The breast is composed almost entirely of fat (Fig. 2.1a, b). Fibrous and glandular tissue makes up less than 25 % of the breast.
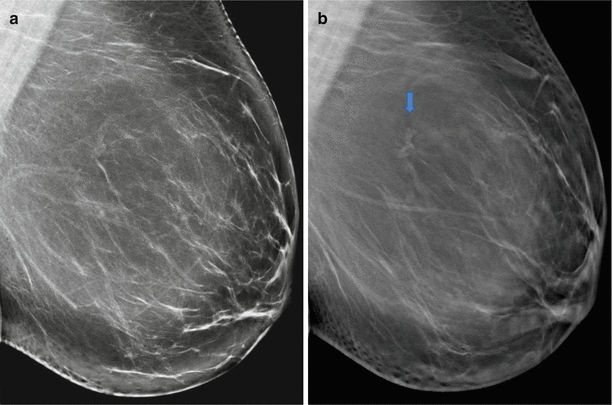

Fig. 2.1
(a) 2D synthetic left breast oblique view (Lobl), (b) 3D Lobl. In addition to breast density, 3D mammography uncovered an irregular mass with slight spiculation/distortion/desmoplastic reaction. Histologically this was an invasive breast cancer
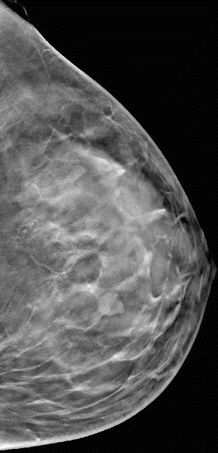
BI-RADS ACR 2/b
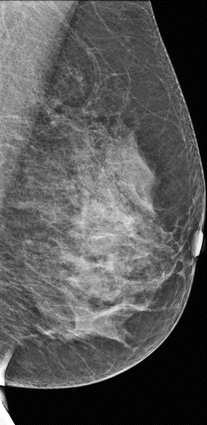
There are scattered fibroglandular densities (Fig. 2.2a, b). Fibrous and glandular tissue makes up from 25 to 50 % of the breast.
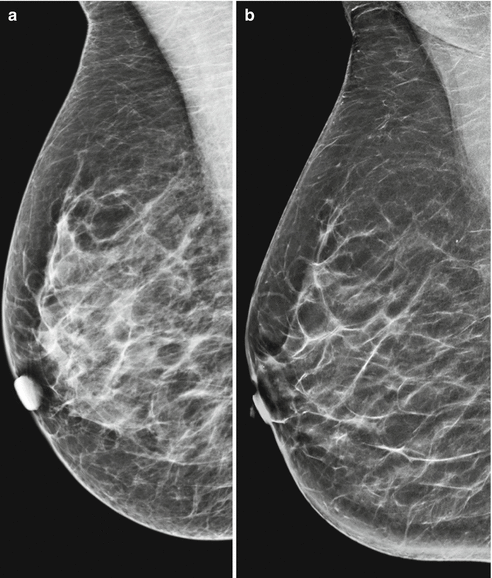

Fig. 2.2
(a, b) 2D right breast oblique view (Robl) and 2D (synthetic) Robl
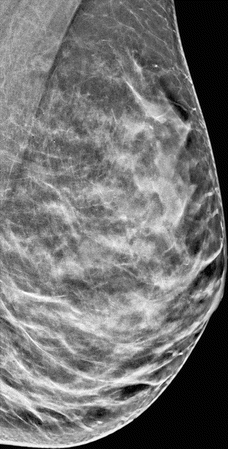
ACR 3/c
The breast tissue is heterogeneously dense (Fig. 2.3a–c). More areas of fibrous and glandular tissue (from 51 to 75 %) are found throughout the breast. This can make it hard to see small masses (cysts or tumors).
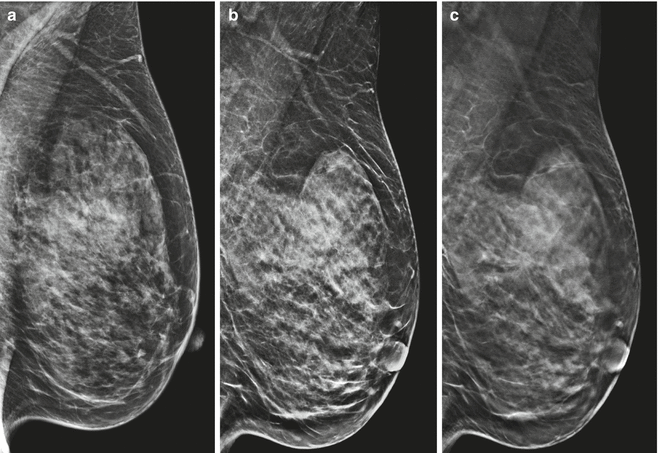

Fig. 2.3
(a–c) 2D Lobl and 2D (synthetic) Lobl and 3D Lobl. Appreciate the small spicular mass and radial distortion only visible on 3D
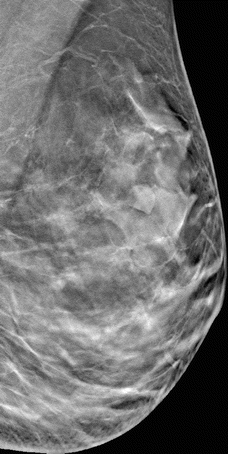
ACR 4/d
The breast tissue is extremely dense (Fig. 2.4a–c). The breast is made up of more than 75 % fibrous and glandular tissue. This can cause some cancers to be missed. The focus here should be on minimal signs such as slight distortions and masses with halos, asymmetries, and asymmetric differences in densities.
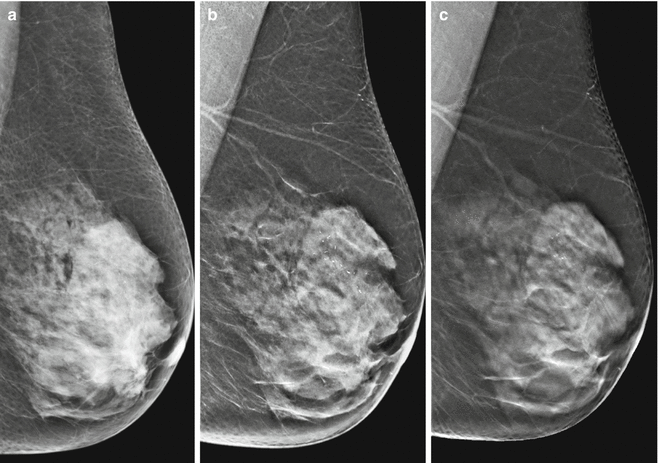

Fig. 2.4
(a–c) 2D Lobl and 2D (synthetic) Lobl and 3D Lobl. Appreciate that the calcifications pop up in synthetic 2D and 3D and thus become better visible
2.2 3D Mammography Lexicon
2.2.1 Mass
2.2.1.1 Size
Figures 2.5a, b and 2.6a, b show a spiculated, histologically proven, invasive breast cancer. The advantage of 3D can be seen by comparing the obscured lesion in 2D in Fig. 2.5a, b with the spiculated lesion in 3D in Fig. 2.6a, b. Figures 2.5 and 2.6 depict improved measuring as a result of better delineation of lesion margins and extension of distortions.
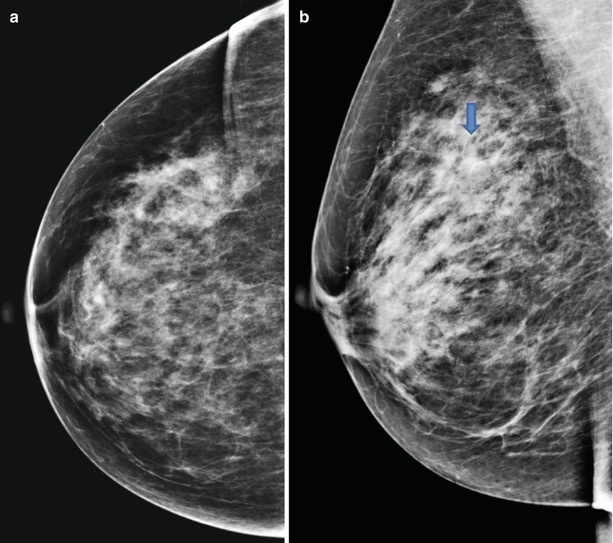
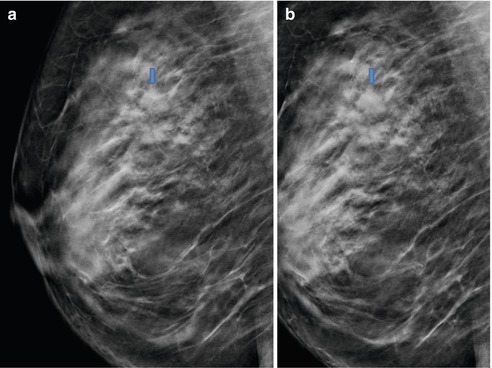

Fig. 2.5
(a, b) 2D Rcc, and 2D Robl

Fig. 2.6
(a, b) 3D slices Robl
2.2.1.2 Shape
Oval
Appreciate better delineation of this oval, well defined mass.
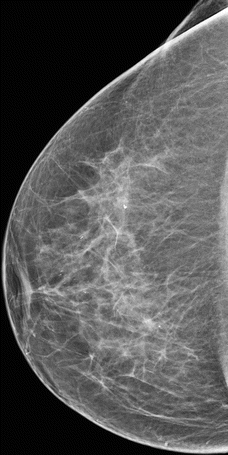
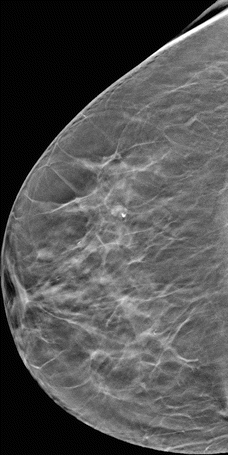

Fig. 2.7
2D (synthetic) Rcc

Fig. 2.8
3D Rcc
Round
Appreciate the obscured margin in 2D, clearly well defined in 3D.
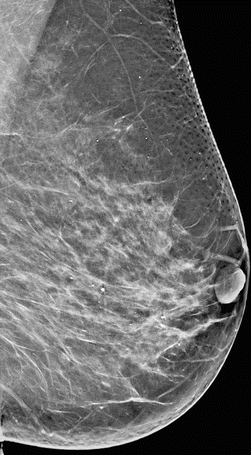
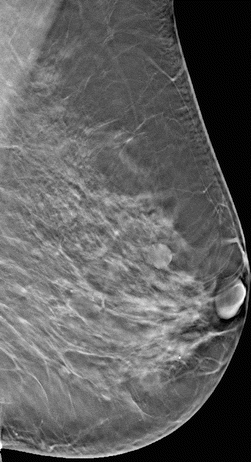

Fig. 2.9
2D Lobl

Fig. 2.10
3D Lobl
Irregular
Appreciate an irregular mass with spiculated margin and adjoining archtictural distortion in 3D.
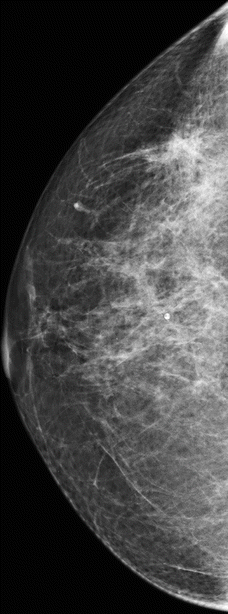
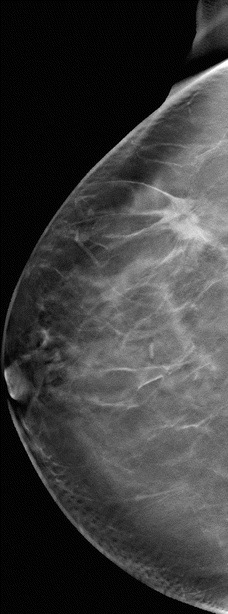

Fig. 2.11
2D Rcc

Fig. 2.12
3D Rcc
2.2.1.3 Margin
Circumscribed (Well Defined)
Appreciate the well-defined margin of the oval masses, partially obscured in 2D.
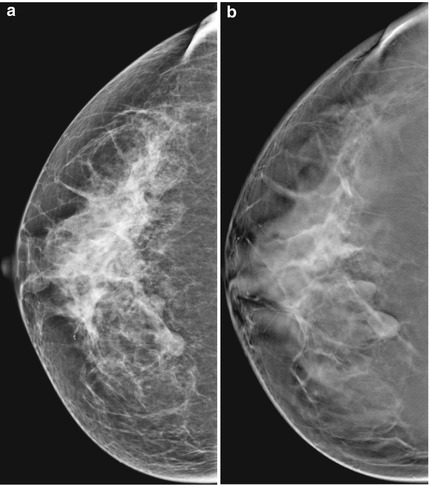
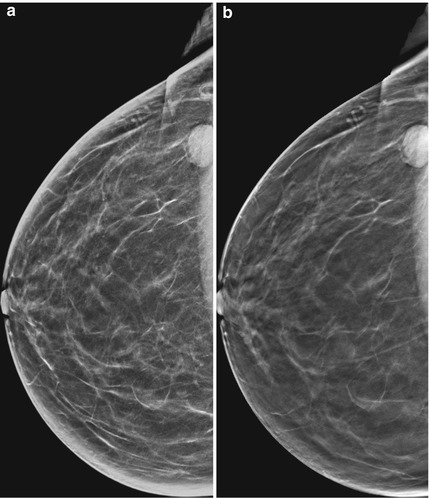

Fig. 2.13
(a, b) 2D (synthetic) Rcc and 3D Rcc

Fig. 2.14
(a, b) 2D Rcc and 3D Rcc
Obscured
Appreciate the better delineation of this oval-well defined mass with 3D, for the most part obscured in 2D.
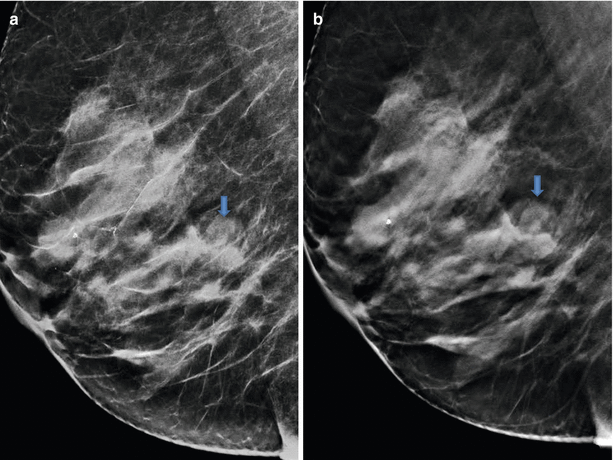

Fig. 2.15
(a, b) 2D synthetic Robl and 3D Robl
Microlobulated
Appreciate the microlobulated margin and architectural distortion in 3D.
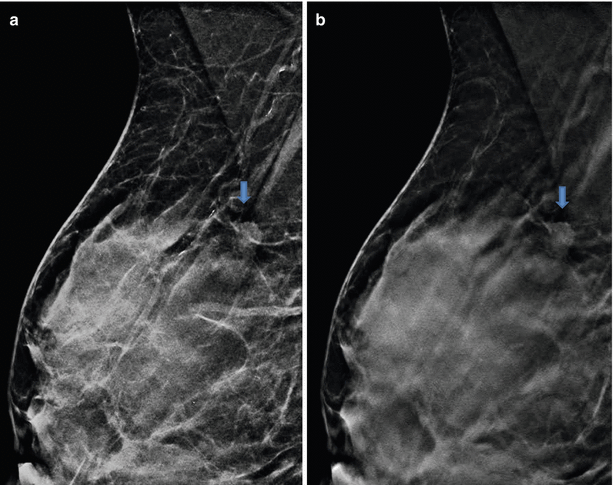

Fig. 2.16
(a, b) 2D synthetic Robl and 3D Robl
Indistinct
Appreciate in 3D the inherently poorly defined margin of this invasive breast cancer.
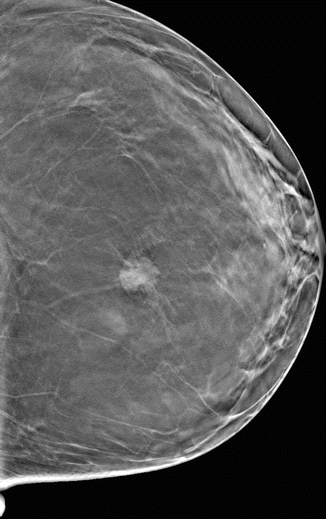
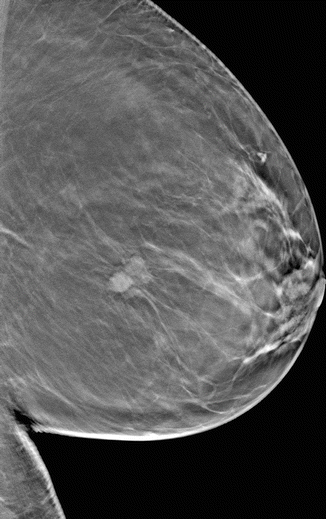

Fig. 2.17
3D Lcc

Fig. 2.18
3D Lmlo
Spiculated
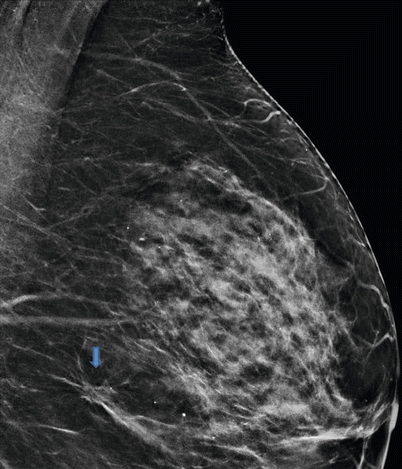
Fig. 2.19
2D Lmlo
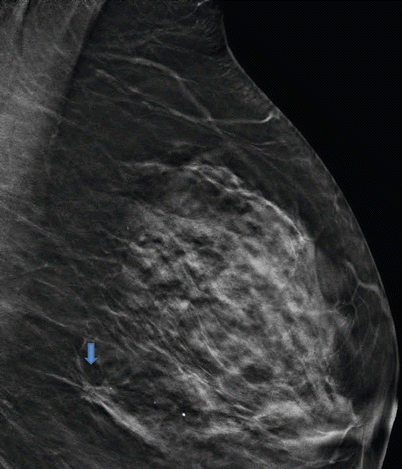
Fig. 2.20
3D Lmlo
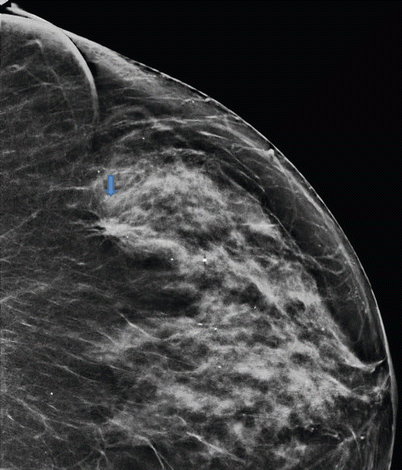
Fig. 2.21
2D Lcc
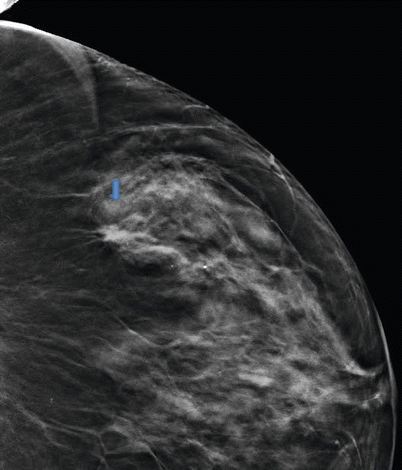
Fig. 2.22
3D Lcc
Appreciate the spiculated margin and adjoining architectural distortion clearly shown in synthetic 2D and 3D.
2.2.1.4 Density of Masses
Low Density
Equal Density
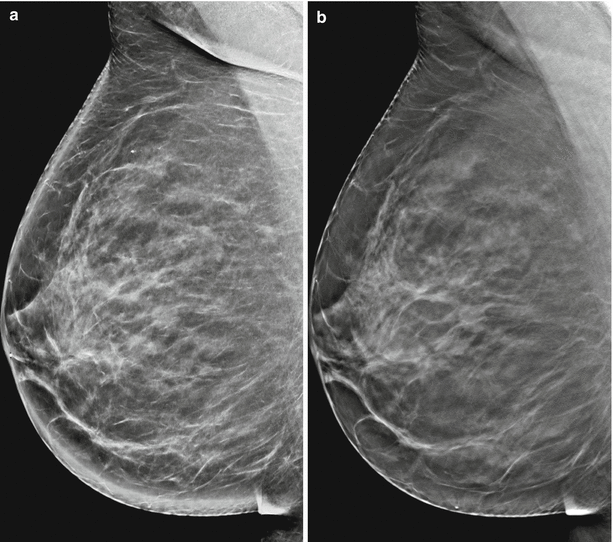
Fig. 2.27
(a) 2D Rmlo (b) 3D Rmlo
Appreciate in 3D in the middle third of of the right breast the lobulated, well defined mass of equal density compared to normal breast tissue.
Appreciate the architectural distortion of the irregular mass of equal density in the upper posterior part unmasked only in 3D.

