Assessment of Clinical Response


Assessment of Clinical Response


Antonio Tito Fojo

Susan E. Bates


INTRODUCTION

Approaches to response assessments have become increasingly important over the past decade as the drug development pipeline has steadily increased in volume. In 2012, an estimated 981 medicines were in development for cancer, and the number is certainly higher today.1 The challenge is, first, how to measure the activity of an agent in the research setting, and, second, how to measure activity in the standard of care setting.

The “modern era” of drug development began in 1976 when 16 experienced oncologists treating lymphoma gathered to decide what would be considered a reliable measure of response to a therapy.2 Each oncologist measured 12 simulated tumor masses employing usual clinical methods (i.e., calipers or rulers). A principal goal was to identify the amount of shrinkage that could not be ascribed to operator error and that would not be found if a placebo was administered. Moertel and Hanley recommended that to avoid error, a 50% reduction in the product of perpendicular diameters be employed as the criterion for efficacy.2 It was from this beginning that our current methodologies of response assessment evolved. The important point to note is that the decision to use a 50% reduction in the product of perpendicular diameters as a measure of efficacy was made so as to reduce error and not because it represented a value that conferred clinical benefit.


From Calipers and Rulers in Lymphoma to the Bidimensional World Health Organization Criteria

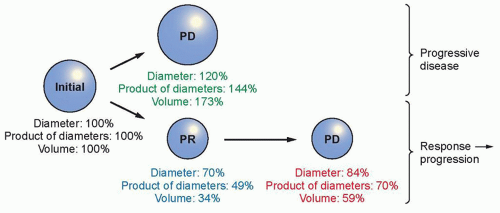
In 1981, five years after the Moertel and Hanley report,2 a World Health Organization (WHO) initiative developed standardized approaches for the “reporting of response, recurrence and disease-free interval.”3 The WHO criteria, like Moertel and Hanley, recommended that malignant disease be measured in two dimensions. Complete response (CR) was defined as the disappearance of all known disease, and a partial response (PR) was scored if there occurred a “50% decrease in the sum of the products of the perpendicular diameters of the multiple lesions.” Thus, the 50% reduction initially chosen as an operationally optimal value became institutionalized as the threshold for declaring efficacy in the majority of cancers. This measure of efficacy was perpetuated in 2000 with the now widely used Response Evaluation Criteria in Solid Tumors (RECIST), but shifting to one dimension.4 The authors noted “the definition of a partial response, in particular, is an arbitrary convention— there is no inherent meaning for an individual patient of a 50% decrease in overall tumor load.” Nevertheless, the threshold chosen—a 30% reduction in one dimension—was comparable in volume to the 50% decrease in the sum of the products of the perpendicular diameters and thus perpetuated the 1976 standard. In spite of its arbitrary origins, the 50% reduction has held up over time. But the major impact of the WHO criteria was that it marked the beginning of a common language of response. These criteria have been revisited and refined over time, as technology and medicine advanced. Table 30.1 compares the WHO criteria with those of RECIST 1.0 and RECIST 1.1 and three modifications of RECIST, whereas Figure 30.1 provides a visual presentation of the RECIST threshold required to qualify as response or progression.3,4,5,6,7,8,9


ASSESSING RESPONSE


RECIST 1.1

The RECIST 1.0 guidelines were updated as RECIST 1.1 in 2009, with a number of differences between the two response criteria highlighted. RECIST 1.1 preserves the same categories of response found in RECIST 1.0:


  • Complete response: Complete disappearance of all disease


  • Partial response: ≥30% reduction in the sum of the longest diameter of target lesions


  • Stable disease: Change not meeting criteria for response or progression


  • Progression: ≥20% increase in the sum of the longest diameter of target lesions

However, a decade of experience with RECIST identified several problems with the criteria, some of which could be corrected. In RECIST 1.0, minimum size varied between 1 and 2 cm depending on technique; in RECIST 1.1, a 1-cm lesion is the minimum measurable. In RECIST 1.0, 10 lesions were to be measured, 5 per organ; RECIST 1.1 reduced that to 5 lesions, 2 per organ. Response criteria in RECIST 1.0 did not address lymph nodes; in RECIST 1.1, lymph nodes decreasing to <1 cm in their short axis could constitute a complete response. Disease progression in nontarget disease was further defined to indicate that in addition to a 20% increase in target lesions over the smallest sum on study, there must be an absolute increase of 5 mm, and that an increase of a single nontarget lesion should not trump an overall disease status assessment based on target lesions.


Variations of the RECIST Criteria

The RECIST criteria have been widely used for standardizing the reporting of clinical trial results and have improved reproducibility. However, the increasing precision and codification of RECIST has led to recognition of its limitations. For example, there are unique challenges in central nervous system (CNS) disease, relating response to tumor size measurements based on contrast enhancement. Pseudoprogression refers to an increase in contrast enhancement due to a transient increase in vascular permeability after irradiation, whereas pseudoresponse is a decrease in contrast enhancement that may occur due to a reduction in vascular permeability following corticosteroids or an antiangiogenic agent such as bevacizumab.10,11,12 The McDonald criteria, traditionally used in determining glioma response based

on two-dimensional measurements, have been recently updated as part of the Response Assessment in Neuro-Oncology (RANO) response criteria and extended to include a response assessment for metastatic CNS disease.7,13


TABLE 30.1 Key Features of Response Criteria


WHO3


RECIST 1.04


RECIST 1.15


CNS RANO Criteria7


RECIST Mesothelioma8


RECIST Immunotherapy9


Dimension


Uni- and bidimensional


Unidimensional


Unidimensional


Bidimensional


Unidimensional


Bidimensional


Measurable Lesion


Not defined


Longest diameter, ≥20 mm with most modalities; ≥10 mm with spiral CT


Longest diameter ≥10 mm on CT or on skin if using calipers; ≥20 mm if using CXR


Two perpendicular diameters of contrast enhancing lesions ≥10 mm


Tumor thickness perpendicular to chest wall or mediastinum, measured in two positions at three levels on transverse cuts of CT scan


Longest perpendicular diameters


Measurable Lymph Nodes


Not defined


Not defined


≥15 mm short axis


Disease Burden to be Assessed at Baseline


All (not specified)


Measurable target lesions up to 10 total (5 per organ); other lesions nontarget


Measurable target lesions up to 5 total (2 per organ); other lesions nontarget


Two to five lesions in patients with several lesions


Pleural disease in perpendicular diameter; nodal, subcutaneous, and other bidimensional lesions measured unidimensionally as per the RECIST criteria


5 lesions per organ, up to 10 visceral lesions and five cutaneous lesions


Sum


Sum of the products of bidimensional diameters or sum of linear unidimensional diameters


Sum of longest diameters of all measurable lesions


Sum of the longest diameters of target lesions with only exception use of short axis for lymph nodes


Sum of the products of perpendicular diameters of all measurable enhancing target lesions


Sum of the six measurements defines a pleural unidimensional measure


SPD with new lesions incorporated into baseline; tumor burden = SPDindex lesions + SPDnew lesions


Complete Response


Disappearance all known disease


Disappearance all known disease


Disappearance all known disease; lymph nodes <10 mm


Disappearance all target lesions with no evidence of tumor elsewhere


Disappearance all lesions in two consecutive observations


Partial Response


≥50% decrease


≥30% decrease; all other no evidence of progression


≥30% decrease; all other disease, no evidence of progression


≥50% reduction; stable or decreased steroid use compared to baseline


≥30% reduction in total tumor measurement


≥50% decrease compared with baseline in two observations


Response Confirmation?


≥4 weeks apart


≥4 weeks apart


≥4 weeks apart (if response primary end point); no, if secondary endpoint


≥4 weeks apart


Repeat on two occasions ≥4 weeks apart


≥4 weeks apart


Progressive Disease


≥25% increase in size of one or more measurable lesions or appearance of new lesions


≥20% increase, taking as reference smallest sum in study; or appearance of new lesions


≥20% increase, with absolute increase ≥5 mm, taking as reference smallest sum in study; or appearance of new lesions


≥25%, or any new lesions


≥20% increase in the total tumor measurement over the nadir measurement, or the appearance of one or more new lesions


≥25% increase compared with nadir confirmed ≥4 weeks apart; up to five new lesions (≥5 × 5 mm) per organ incorporated into tumor burden


Nonmeasurable disease: Estimated increase of ≥25%


Nonmeasurable disease: unequivocal progression


Nonmeasurable disease: unequivocal progression


Nonmeasurable disease: >5 mm increase in maximal diameter; ≥25% increase in SPD; or significant increase in nonenhancing lesions on same or lower dose of corticosteroids


New, nonmeasurable lesions (i.e., <5 × 5 mm) do not define progression


Stable Disease


Stable disease or non-PR and non-PD ≥4 weeks


Non-PR, non-PD; minimum time defined by protocol


Non-PR, non-PD; minimum time defined by protocol


Non-PR, non-PD


Non-irPR, non-irPD


CXR, Chest X-ray; SPD, sum of products of two largest perpendicular diameters; PD, progressive disease; irPR, immune-related partial response; irPD, immune-related progressive disease.


Other examples where RECIST is limited include mesothelioma, gastrointestinal stromal tumors (GIST), hepatocellular cancers, among others. The pleural disease of mesothelioma increases in depth while following the pleural surface. GIST tumors may remain unchanged in size after treatment, whereas the center of the tumor mass undergoes necrosis, and progression may occur in the remaining rim.14 Hepatocellular cancers are often treated with local-regional therapy in which the goal is tumor necrosis and treatment failure occurs in surviving viable tumor.15 Different strategies have emerged to quantify these diseases, including modifications of RECIST, quantifying positron-emission tomography (PET) imaging, and biomarker criteria, as will be discussed. The RECIST adaptation for mesothelioma, growing along the pleural surface, is to measure the diameter perpendicular to the chest wall or mediastinum, and to measure at three levels.8 The adaptation for hepatocellular cancer following local therapy is measurement of the longest diameter of the tumor that shows enhancement on the arterial phase of the scan, bypassing the dense, homogeneous Lipiodol-containing necrotic area.15


Figure 30.1 RECIST thresholds in three parameters: diameter, product of diameters, and volume. In the figure, spheres meeting RECIST criteria for progressive disease (PD) and for PR are shown with the percentage relative to the baseline calculated for each parameter. To meet the threshold for PD, the longest diameter must increase to 120%, which is equivalent to a 144% increase in the product of the perpendicular diameters and a 173% increase in the volume of a sphere. Although PR definitions are almost identical to those employed with WHO, RECIST has a higher threshold to meet PD.6

Investigators have also observed that following immunotherapy, tumor lesions may increase in size due to the increased infiltration of T cells, even meeting criteria for RECIST-defined progressive
disease (PD). Previously radiographically undetectable lesions may appear. Departing from conventional RECIST, which defines any new lesion as PD, the immune response criteria allow the appearance of new lesions, adding them to the total tumor burden.9 An increase in total tumor burden of >25% relative to baseline or nadir is required to define PD.


International Working Group Criteria for Lymphoma

Revised guidelines for lymphoma assessment were promulgated by the International Working Group (IWG) in 2007.16 These guidelines incorporated 18F-fluorodeoxyglucose (FDG)-PET assessments in metabolically active lymphomas.16 Although a CR requires the complete disappearance of detectable disease, a posttreatment residual mass is permitted if it is negative on FDG-PET and was positive at baseline. For lymphomas that are not consistently FDG avid, or if FDG avidity is unknown, a CR requires that nodes >1.5 cm before therapy regress to <1.5 cm, and nodes that were 1.1 to 1.5 cm in long axis and >1.0 cm in the short axis shrink to ≤1.0 cm in short axis. The definition of PR resembles the WHO criteria, in that a ≥50% decrease in the sum of the product of the diameters in up to six nodal masses or in hepatic or splenic nodules must be documented. Although RECIST 1.1 now includes lymph node assessment, the IWG criteria remain the assessment method typically used in lymphoma clinical trials.


ALTERNATE RESPONSE CRITERIA

The previous examples represent attempts to more accurately measure tumor burden. Evolving imaging technology enabling volumetric measurements of tumor masses may eventually resolve some of these problems, but effective therapeutic agents are required to enable validation and utilization of response assessment tools. The lack of an agent that can mediate substantial tumor shrinkage underlies the concept of clinical benefit response (CBR) as an endpoint in pancreatic cancer. Clinical benefit was defined as a combination of improvement in pain, performance status, and weight; the assessment of CBR supported the U.S. Food and Drug Administration (FDA) approval of gemcitabine in pancreatic cancer.17,18 Better therapies for pancreatic cancer that result in tumor shrinkage or eradication should include and then eclipse clinical benefit.

Response criteria may be specific to a particular disease or clinical setting. Some diseases by their nature require specific strategies for response assessment.


Severity-Weighted Assessment Tool Score in Cutaneous T-Cell Lymphoma

Cutaneous T-cell lymphoma (CTCL) is a disease that can involve the entire epidermis, or comprise individual skin lesions varying widely in severity rather than size. The severity-weighted assessment tool (SWAT) assigns a factor for skin lesion severity—patch, plaque, or tumor—multiplies this factor by the percent of skin involved with each lesion type and then adds these together. This complex system formed the basis of the FDA approval of vorinostat for CTCL.19


Pathologic Complete Response in Breast Cancer

One unique response endpoint is the assessment of breast cancer treated in the neoadjuvant setting. The purpose of neoadjuvant therapy is to improve survival, render locally advanced cancer amenable to surgery, or to aid in breast conservation. In that setting, the absence of cancer cells in resected breast tissue has been used to define a pathologic complete response (pCR). The rate of pCR has been proposed as a surrogate endpoint for event-free survival (EFS) or overall survival (OS) to support approval of new agents or combinations of agents tested in clinical trials.20 In a pooled analysis of 11,955 patients enrolled on 12 neoadjuvant trials, individual patients with pCR had improved EFS and OS.21 However, at the trial level, pCR rates did not correlate with EFS or OS, a problem likely due to heterogeneity of breast cancer subtypes among the trials. Despite this, pCR rates were recently used to support the approval of pertuzumab and trastuzumab in the neoadjuvant setting.21,22


Computed Tomography-Based Tumor Density

One approach, often called the Choi criteria, advocates assessing tumor response in GIST, renal cell cancer, or hepatocellular cancer based on density on computed tomography (CT) scans (Table 30.2). This variation was prompted by the evident response to treatment with imatinib but with minimal tumor shrinkage.23 The Choi criteria are still considered exploratory in GIST,24,25 and it is too soon to know of benefits in other histologies.26,27 Further study should determine its utility, although it will likely be confined to specific tumor types with specific drugs.


FDG-PET

Although widely used in clinical practice, FDG-PET has become part of standardized response criteria for clinical trials only in lymphoma (see Table 30.2). In solid tumors, FDG-PET can aid in the detection of new or recurrent sites of disease, and can be used as an adjunct during assessments for disease progression when using RECIST criteria.5 Although FDG uptake is a powerful diagnostic tool and its uptake reflects a tumor’s metabolic activity, it has some limitations: Some tumors have variable FDG avidity; differences can occur due to variations in patient activity, carbohydrate intake, blood glucose, and timing; and there are several benign sources of uptake, including inflammatory and postsurgical sites. Multiple methods of quantitating FDG-PET and assessing response have been proposed, but to date there is no consensus, particularly regarding the definition of a metabolic response.28,29,30,31,32,33

The two most widely used response criteria—the European Organisation for the Research and Treatment of Cancer (EORTC) criteria and PET Response Criteria in Solid Tumors (PERCIST) (see Table 30.2)—have been evaluated in specific disease types, but unifying FDG-PET response criteria remains a challenge in anticancer drug development.28,30 We would note that, as shown in Figure 30.1, a 30% reduction in the diameter of a sphere—the magnitude of change required to score a response according to RECIST—represents a 65% decrease in volume. If an standardized uptake value (SUV) decrease is directly equated to a volume decrease, a reduction of 25% translates to a 10% reduction in diameter, a value that likely constitutes an insufficient response.


Serum Biomarkers of Response

The ideal response assessment method is an assay that could measure tumor quantity by a simple blood test (see Table 30.2). Circulating protein biomarkers have been identified and studied for several decades for screening, early detection of recurrent disease, determining prognosis, selecting therapy, and monitoring response to therapy. These serum tumor markers are to be distinguished from the assays determining the presence of an overexpressed or mutated molecular target. With the successful launch of therapies against such molecular targets, there has been increased interest in the assays needed to select therapy for individual patients (predictive biomarkers). The analytical and clinical validation of such assays, along with determination of their clinical utility, has created a new regulatory paradigm known as companion diagnostics.34,35 This investment in the development of predictive markers for companion diagnostics has reduced the focus on protein biomarkers of treatment response relative to older literature.

Only gold members can continue reading. Log In or Register to continue

Stay updated, free articles. Join our Telegram channel

Jun 28, 2016 | Posted by in ONCOLOGY | Comments Off on Assessment of Clinical Response

Full access? Get Clinical Tree

Get Clinical Tree app for offline access