Apob and the Atherogenic Apob Dyslipoproteinemias
Allan D. Sniderman
Jacqueline P. De Graaf
Patrick Couture
Vascular disease remains the greatest cause of death in the developed countries and has reached the same rank in many of the developing countries as well, making it the number one cause of death worldwide. Our challenge is to develop diagnostic and therapeutic tools that are simple enough to be applied in settings with limited health care resources but, at the same time, are better than those that are presently available anywhere so that outcomes can be improved in all societies, those with lesser resources as well as those with greater resources. ApoB is an important step forward to meeting this challenge.
A myriad of diagnostic and therapeutic technologies have been developed to treat the complications of vascular disease. But they do not work all of the time and often they cannot be applied in time. Moreover, no society can afford all of them for all their citizens. Prevention is the most practical approach. By identifying the susceptible individual more precisely than any of the cholesterol markers, apoB allows prevention to be more precisely targeted and to be more cost-effective. By determining the adequacy of low-density lipoprotein (LDL)-lowering therapy more precisely than any of the cholesterol markers, apoB allows the therapy to be more cost-effective. The additional cost of apoB is trivial compared to the additional benefit.
But apoB is a complementary not a competitive tool. By adding apoB to lipids, instead of a list of disconnected numbers, a precise and coherent picture of the number and composition of the atherogenic apoB lipoprotein particles becomes readily available. Cholesterol and triglyceride are the cargo that lipoprotein particles carry. ApoB provides the structural integrity to the particle by acting as an external envelope within which the cholesterol and triglyceride are enclosed. Because there is one apoB molecule per particle, plasma apoB equals the exact number of carriers for the cholesterol and triglyceride that need to be transported. ApoB and lipids make no sense if considered separately and apart. Put them together and a complete and detailed diagnostic algorithm of all the apoB atherogenic dyslipoproteinemias can be easily constructed. This chapter will demonstrate how.
The plasma lipoproteins are the single most important determinant of the risk of vascular disease. The INTERHEART study demonstrated that nine modifiable factors account for more than 90% of the population-attributable risk of vascular disease and that these same factors operated in all the major population groups of the world (1). Of the nine, the apoB/apoA-I ratio was the largest by far, accounting for just over 50% of risk. The apoB/apoA-I ratio expresses the balance between the proatherogenic and the antiatherogenic lipoproteins in plasma where the apoB lipoproteins— very low density lipoprotein (VLDL), intermediate-density lipoprotein (IDL), LDL, and lipoprotein (a) (Lp(a))—increase the risk of vascular disease, whereas the apoA-I lipoproteins (high-density lipoprotein [HDL]) decrease the risk of vascular disease. INTERHEART unequivocally demonstrated that apoB, apoA-I, and the apoB/apoA-I ratio were substantially superior to any of the cholesterol indices—total cholesterol (TC), low-density lipoprotein cholesterol (LDL-C), or non-high-density lipoprotein cholesterol (non-HDL-C)—and any of the cholesterol ratios—TC/HDL-C, LDL-C/HDL—C, and non-HDL-C/HDL-C-as markers of the risk of acute myocardial infarction (2). Because INTERHEART recruited large numbers of subjects from all over the world, the results apply worldwide, and therefore, for once, we know not just the answer for one group of people but the answer for all.
No issue has been as contentious in clinical lipidology as to whether apoB is a superior marker of risk than the cholesterol markers. INTERHEART strongly favored apoB and INTERHEART does not stand alone. Far from it. Among the many pieces of evidence in support, the single strongest is the AMORIS study led by Goran Walldius and Ingmar Jungner (3). This gigantic prospective study of 175,553 Swedes was the first to produce incontrovertible evidence of the superiority of apoB and the apoB/apoA-I ratio to any of the cholesterol parameter or ratios as markers of fatal myocardial infarction.
Indeed, as will be demonstrated beneath, there is now a chain of evidence, so long and so strong, as to be fairly regarded as incontrovertible, that demonstrates apoB is superior to any of the cholesterol indices as a marker of the atherogenic lipoprotein-related risk of vascular disease. It follows that apoB, not LDL-C or non-HDL-C, should be the target of LDL-lowering therapy, a position now advocated by the American Diabetes Association and the American College of Cardiology (4,5). ApoB and apoA-I can be easily and accurately measured on nonfasting plasma using standardized methods (6).
To be sure, the results on apoA-I and the apoB/apoA-I ratio remain mixed with some studies, such as the Framingham Offspring Study, showing HDL-C to be markedly better than apoA-I (7), whereas others, such as Apolipoprotein-related Mortality Risk (AMORIS) (3), INTERHEART (2), and Treating to New Targets/Incremental Decrease in End Points through Aggressive Lipid Lowering (TNT/IDEAL) (8),
show the reverse. To date, the reasons for these contradictory outcomes have not been uncovered. ApoA-I is easier to measure accurately and reproducibly than HDL-C and variance in measurement of HDL-C may be responsible, at least in part, for the variance in the conclusions of the different studies. Even so, the reasons that HDL are cardioprotective remain deeply obscure, whereas there is no doubt as to why apoB particles are atherogenic. Indeed, the trapping of an apoB particle is the first and essential step in atherogenesis and the profound and generally malign range of biologic responses to the trapping of apoB particle constitutes and defines the atherogenic process. Accordingly, this chapter will focus on apoB and the apoB atherogenic dyslipoproteinemias. Nevertheless, our view, based on the available evidence, is that the apoB/apoA-I ratio is substantially superior to any of the cholesterol ratios—TC/HDL-C, LDLC/HDL-C and non-HDL-C—to quantitate the lipoprotein-related risk of vascular disease and accordingly should be used for this purpose. Unfortunately, ratios conceal almost as much as they reveal—a reality we ignore at our patient’s peril (9). Therefore, we must learn to use ratios or they will continue to use us.
show the reverse. To date, the reasons for these contradictory outcomes have not been uncovered. ApoA-I is easier to measure accurately and reproducibly than HDL-C and variance in measurement of HDL-C may be responsible, at least in part, for the variance in the conclusions of the different studies. Even so, the reasons that HDL are cardioprotective remain deeply obscure, whereas there is no doubt as to why apoB particles are atherogenic. Indeed, the trapping of an apoB particle is the first and essential step in atherogenesis and the profound and generally malign range of biologic responses to the trapping of apoB particle constitutes and defines the atherogenic process. Accordingly, this chapter will focus on apoB and the apoB atherogenic dyslipoproteinemias. Nevertheless, our view, based on the available evidence, is that the apoB/apoA-I ratio is substantially superior to any of the cholesterol ratios—TC/HDL-C, LDLC/HDL-C and non-HDL-C—to quantitate the lipoprotein-related risk of vascular disease and accordingly should be used for this purpose. Unfortunately, ratios conceal almost as much as they reveal—a reality we ignore at our patient’s peril (9). Therefore, we must learn to use ratios or they will continue to use us.
The principal objectives of this chapter are as follows:
to summarize the overall evidence in favor of apoB as a marker of the risk of vascular disease and an index of the adequacy of LDL-lowering therapy.
to demonstrate the difference between what apoB and the cholesterol atherogenic indices measure.
to demonstrate how apoB can be integrated with cholesterol and triglyceride to diagnose the atherogenic apoB dyslipoproteinemias.
to demonstrate the treatment gap that results if apoB is not used as the principal index to judge the adequacy of LDL-lowering therapy.
 FIGURE 16.1 The major forms of very low density lipoprotein (VLDL) and low-density lipoprotein (LDL) are illustrated. Each contains one molecule of apoB but differs in the absolute and relative amounts of cholesterol and triglyceride in its core. |
THEORETICAL CONSIDERATIONS
Atherogenic Lipoprotein Particles versus Atherogenic Lipoprotein Lipids
This section will focus on explaining the biologic basis for the advantage of apoB over LDL-C. VLDL, IDL, LDL, and Lp(a) are the atherogenic apoB lipoprotein particles and each contains one molecule of apoB. Therefore, apoB equals total plasma atherogenic particle number. With only a few exceptions, the great majority of the fasting plasma triglycerides are in VLDL particles. However, these differ substantially in size and in the masses of triglyceride and cholesterol they contain within their cores. It follows that there can never be any simple accurate formula relating plasma triglycerides to VLDL particle number (Fig. 16.1). LDL particles also differ in size and lipid content—in this case, in the mass of cholesterol they contain. Larger LDL particles contain more cholesterol, smaller ones less. Just as each VLDL particle contains one molecule of apoB, each LDL particle contains one molecule of apoB. Just as triglycerides do not equal VLDL particle number, LDL-C does not equal LDL particle number (LDL-P).
In contrast to LDL (see following text), not all VLDL particles are equally atherogenic since the largest ones will enter the arterial wall substantially less easily, and therefore, on a per particle basis, substantially less often than the smallest ones. This has been recognized indirectly by the emphasis placed on remnants—the partially metabolically processed chylomicron and VLDL particles, which are, unquestionably, small enough to penetrate and lodge within the arterial wall and drive the atherosclerotic process. However, except in familial dysbetalipoproteinemia and hepatic lipase deficiency—one an uncommon and the other a rare disorder of lipoprotein
metabolism—the number of remnants is not generally large enough to pose substantial risk (10). This accounts for the multiple observations that the risk of vascular disease is substantially higher in patients with hyperTg hyperapoB than in those with hyperTg normoapoB (for review, see reference [11]). Moreover, in almost all studies, once apoB is taken into account, triglycerides are no longer an independent risk factor for clinical events.
metabolism—the number of remnants is not generally large enough to pose substantial risk (10). This accounts for the multiple observations that the risk of vascular disease is substantially higher in patients with hyperTg hyperapoB than in those with hyperTg normoapoB (for review, see reference [11]). Moreover, in almost all studies, once apoB is taken into account, triglycerides are no longer an independent risk factor for clinical events.
Nevertheless, hypertriglyceridemia is substantially more common in patients with premature vascular disease than hypercholesterolemia (12). Moreover, whether expressed as mg/dL or mmol/L, the concentration of triglycerides is often much larger than the concentration of cholesterol, implying that the amount of VLDL is much larger than the amount of LDL. This misconception dissolves once plasma lipids are understood not as masses per volume of plasma but as components of lipoprotein particles. In the great majority of individuals, there are nine times more LDL particles than VLDL particles and that is the fundamental reason LDL is so much more important in atherogenesis than VLDL. This relationship is illustrated in a normal in Figure 16.2A but holds as well in hypertriglyceridemic patients. Let us say the first subject (Fig. 16.2A) had a plasma triglyceride concentration of 1 mmol/L and an LDL-C concentration of 3 mmol/L. Now take a patient with plasma triglyceride concentration of 4 mmol/L and LDL-C concentration of 2 mmol/L. As before, there are nine times more LDL particles than VLDL particles (Fig. 16.2B). The number of apoB particles is the same in the two subjects, but in the second the larger mass of triglyceride fits easily into a much larger VLDL particle. Be aware the picture is only two dimensional, whereas the particle is three dimensional, and remember that the area of a circle is equal to πr2, whereas the volume of a particle equals πr3. Thus, VLDL particles differ twofold in diameter from 350 to 700 Å, but this equals an eightfold difference in volume.
In the patient illustrated in Figure 16.2B, the mass of LDL-C, even though only half the mass of triglyceride, is distributed among the same number of LDL particles as previously but the particles are, on average, smaller and denser than in the first normal example. But this is only one possibility. Another is illustrated in Figure 16.2C. In this patient, the VLDL triglyceride is distributed in two particles. There are consequently double the number of LDL particles, the vast majority of which are the small dense variety. The plasma lipids are the same in the two patients but the atherogenic risk is obviously not.
LDL particles differ in size because they differ in the amount of cholesterol ester they contain within their core. Smaller denser LDL particles contain less cholesterol than the larger more buoyant ones. Hypertriglyceridemia is associated with increased numbers of smaller denser LDL particles because triglyceride-rich VLDL particles tend to be converted to smaller LDL particles and because hypertriglyceridemia is associated with increased cholesterol ester-triglyceride exchanges between VLDL and LDL particles that result in more smaller LDL particles.
The relative atherogenicity of smaller versus larger LDL particles has been hotly contested. Since smaller LDL particles contain less cholesterol and since cholesterol is an integral component of atherosclerotic lesions, larger LDL particles should be more dangerous than their smaller counterparts. On the other hand, smaller LDL particles enter the arterial wall more easily because of their smaller size (11). Moreover, they bind more readily to the glycosaminoglycans of the arterial wall (11) and they oxidize more readily than larger LDL particles (11)—in both cases, most likely the consequence of changes in the conformation of the apoB as the diameter of the LDL particle shrinks.
For all these reasons, smaller LDL particles should be more dangerous than larger ones, and unquestionably, preponderantly smaller LDL particles (so-called phenotype B) are more common in patients with vascular disease or at high risk of vascular disease than predominantly larger LDL particles (phenotype A). As well, a series of studies showed that such patients were at higher risk of future events, although in most cases, the LDL phenotype B was not an independent risk factor for clinical disease (for review see reference [11]). One and one seemed to add up to two and the emphasis fell on LDL size, not LDL-P. However, more recent epidemiologic studies have not been able to distinguish between the relative atherogenicity of different size LDL particles: large and small LDL particles appear equally atherogenic (13,14). The result is that it is the number of LDL particles that matters not their composition, and therefore apoB is the critical issue, not LDL size. In summary, apoB outperforms LDL-C as an index of the risk of vascular disease because LDL-C is so frequently an inaccurate index of LDL-P.
The ApoB Model of Vascular Disease: From Risk Factors to Causal Factors
Before considering the issue of therapy, this section will outline a model in which apoB lipoproteins are the prime and proximate cause of vascular disease. The plasma lipoproteins are conventionally described as “risk factors” for cardiovascular events. The adjective “risk” declares them to be contributors to the likelihood of a clinical event where the overall chance of a clinical event is determined by the sum of the action of all the known and unknown factors that are important in the pathogenesis of that event. A risk factor connotes a probabilistic relation between the plasma level of that factor and the likelihood of a clinical event. Individuals with lower levels may suffer events and individuals with higher levels may never experience clinical events. It is all about possibility versus probability, higher likelihood versus lower likelihood. A causal factor is infinitely more muscular than a risk factor. Probability and possibility cede to certainty. Chance disappears; causality takes over. Or so some might think. Not so: with regard to the biology of disease, that is too strong a formulation even for undisputed “causes” of disease. Pneumococci are the “cause” of pneumococcal pneumonia, but simply introducing pneumococci into the upper airway does not necessarily result in infection and inflammation in the lung. Pneumococci are causal agents in the sense they are necessary for pneumococcal pneumonia, but they are not sufficient to produce the full sequence of biologic events that correspond to the clinical event. They are essential to the complete sequence of events but do not entirely dictate it.
In the same sense, apoB is a causal factor for disease within the arterial wall and vascular disease is a necessary antecedent for vascular clinical events. If apoB lipoprotein particles do not enter and are not trapped within the subintimal space of the
arterial wall, the atherosclerotic process will not be initiated and sustained. Indeed, atherosclerosis may be defined as the broad series of inflammatory responses to the trapping of apoB particles within the arterial wall. In the absence of apoB lipoprotein particles, arterial disease is absent.
arterial wall, the atherosclerotic process will not be initiated and sustained. Indeed, atherosclerosis may be defined as the broad series of inflammatory responses to the trapping of apoB particles within the arterial wall. In the absence of apoB lipoprotein particles, arterial disease is absent.
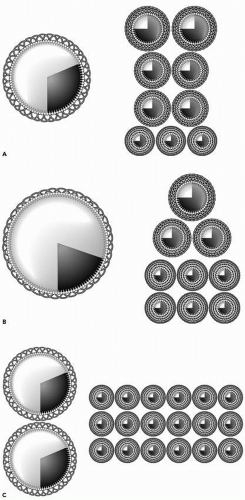 FIGURE 16.2 A: Illustrates the relationship between very low density lipoprotein (VLDL) and low-density lipoprotein (LDL) particles in a normal. B: Illustrates the relationship between VLDL and LDL particles in a patient with hyperTg normoapoB. C: Illustrates the relationship between VLDL and LDL particles in a patient with hyperTg hyperapoB. |
Any particular apoB particle that enters the arterial wall may pass harmlessly through or be trapped within it. As a general rule, the greater the concentration of apoB particles in plasma, the more will enter the arterial wall per unit time and the more that will be trapped within it. This likelihood of penetration can be modified by other factors. Smoking, for example, increases the endothelial permeability to apoB particles within the lumen of the vessel. Tabas et al. have elegantly characterized the response to retention hypothesis of vascular disease (15). They stress what happens after an apoB particle is trapped. We go one step earlier in the process—to where it actually begins, to what actually defines it. Atherosclerosis is the broad series of biologic responses to the trapping of the apoB particle. To be sure, the characteristics of the arterial wall—for example, the specific properties of the glycosaminoglycans or elastin—may influence the likelihood that an apoB particle is trapped and there may well be considerable individual differences in the broad panel of inflammatory responses with some more favorable and promoting fibrosis and healing and others more likely to lead to plaque rupture or endothelial erosion— both of which are immediate proximate causes of clinical events. There is every reason to investigate these processes and determine which drive clinical events and which may respond to intervention. But the reality is that we are at the very beginning of a very long and difficult road and saving more patients’ lives does not need to wait until that particular journey is complete. If apoB is elevated, lower it sufficiently and the rest of the process becomes irrelevant.
Prevention is the key to cost-effective cardiovascular care. But is the present approach the most effective and the least costly? All the major guideline groups have created prevention models in which the intensity of intervention is determined by the likelihood of a clinical event over a 10-year period. Ten years is both long and short. It is, on the one hand, a relatively limited period in, hopefully, a long life but, on the other, a decade is very long compared to the instant in time during which a vascular event is initiated. To say that a 70-year-old male has a 20% chance of suffering a heart attack at some particular millisecond in the next 3,650 days is not the most compellingly precise prediction.
Age matters. Age is, by far, the single most important identifier of vascular risk because vascular disease does not become an important public health problem until after the beginning of the sixth decade. This means that the overall likelihood of an event is extremely low before this time irrespective of the plasma apoB or blood pressure or extent of smoking. This does not mean that myocardial infarction or sudden death cannot occur in males or even females in their 40s. Both can and do. Moreover, even though the proportion of the population affected is extremely low and the number affected compared to the final total is also extremely low, the absolute number who suffer an infarct or die is substantial and the cost to individual families and society as a whole is enormous.
Moreover, the clock can be advanced by roughly a decade by diabetes or being of South Asian descent or, alternatively, it can be delayed by roughly a decade by being a woman. Even so, the shape of the curve—the difference from baseline, imperceptible for decades, then rising gradually for a decade or two, and then, suddenly, bursting asymptotically upward, ever more rapidly, until vascular disease claims more than one in four lives—holds for every group. Understanding the biology of this curve is the key to multiplying the success of our efforts at prevention.
Step number 1 is to appreciate that apoB is a cause, not a risk factor for vascular disease. Step number 2 is to appreciate that age is a more complicated word than we generally conceive. We have made this argument in detail elsewhere and will only summarize it here (16). Age is a biologic, not just a chronologic, commodity. The biologic effects of age on the arterial wall can be divided into those that are due to exposure over time to the malign effects of apoB, hypertension, smoking, and diabetes versus those that are due to deterioration—the inexorable pathobiologic changes in the behavior of our cells over time. This is a distinction that matters since the effects due to exposure are modifiable, whereas those due to deterioration are not. In conventional calculations of risk, these dual effects of age are not separated, the effect of which is to reduce our appreciation of the causal role of apoB in producing disease within arterial wall.
Step number 3 is to realize that we can prevent disease but we cannot reverse it. We understand little of the specific events, and their determinants, that transform stable plaques into unstable ones. Clinicians, statisticians, and epidemiologists have understandably focused on the prediction of clinical events because these are the events that alter our lives. But although this is the answer we would like to know, the reality is that we know it only within very broad limits (the probability of an event over 10 years) and after it is too late (the artery is already extensively diseased). If we took a different approach and acted on the question to which we do have the answer—what causes disease within the artery—rather than the one to which we do not—when will that disease produce clinical events— prevention would be much more effective than at present.
The approach we propose—treating the causes of vascular disease when they are present and pronounced—would be more successful for two reasons. First, therapy could start early enough to save the lives of the youngest victims. Because the conventional algorithms are driven by age, they discourage early intervention. Second, our interventions would be more successful if the internal anatomy of the artery is not already severely damaged and distorted. We have calculated that approximately 80% of events could be prevented if the causes of arterial disease were targeted for therapy (17). To succeed in the real world, such an approach demands many changes, not least will be to use our best measure of the atherogenic lipoproteins—apoB—rather than our worst—LDL-C.
Oversimplification is an enemy of progress. Steinberg et al. (18) have argued that the objective is straightforward—an LDL-C concentration of 50 mg/dL in everyone—and the tools are in hand to achieve it—statins alone or some combination of statins and other hypolipidemic agents. They miss several vital points. First, very low societal levels of vascular disease have been recorded at levels of LDL-C that are higher than this. Vascular disease in the Japanese was one-tenth of that in Americans at a point their LDL-C was only 80 mg/dL compared to 130 mg/dL for the Americans. Second, the very low levels of LDL-C in clinical trials were achieved with potent statin therapy in patients who started with levels of LDL-C that were at or below the 50th percentile of the population.
The reason they went to lower levels with therapy than before was principally because they had lower levels before therapy was begun. Before we start the war they wish to declare, we should, at a minimum, be sure we have the weapons to win it and all of the weapons are safe. Neither condition has been fully met. Even more important, we should be sure that the war needs to be fought. Not only do Steinberg et al. overlook apoB, they also overlook the curvilinear relation of vascular disease with risk. This means that the highest risk and greatest gain come with treating the most deviant. Reducing the incidence of vascular disease is not the only—or even the most important—challenge our societies face; therefore, transferring all our wealth to the pharmaceutical industry makes little or no sense. Using better technology such as apoB and more targeted and more timely therapy will produce much greater gains at much lower costs.
The reason they went to lower levels with therapy than before was principally because they had lower levels before therapy was begun. Before we start the war they wish to declare, we should, at a minimum, be sure we have the weapons to win it and all of the weapons are safe. Neither condition has been fully met. Even more important, we should be sure that the war needs to be fought. Not only do Steinberg et al. overlook apoB, they also overlook the curvilinear relation of vascular disease with risk. This means that the highest risk and greatest gain come with treating the most deviant. Reducing the incidence of vascular disease is not the only—or even the most important—challenge our societies face; therefore, transferring all our wealth to the pharmaceutical industry makes little or no sense. Using better technology such as apoB and more targeted and more timely therapy will produce much greater gains at much lower costs.
TABLE 16.1 EPIDEMIOLOGIC STUDIES IN WHICH TC/LDL-C ≥ APOB | ||||||||||||||||||||||||||||||||||||||||||
|---|---|---|---|---|---|---|---|---|---|---|---|---|---|---|---|---|---|---|---|---|---|---|---|---|---|---|---|---|---|---|---|---|---|---|---|---|---|---|---|---|---|---|
|
Epidemiologic Evidence Comparing Apolipoproteins and the Cholesterol Indices as Markers of the Risk of Cardiovascular Disease
ApoB versus LDL-C
In 1979, Pietro Avogaro et al. reported that plasma apoB was superior to cholesterol as a marker of the risk of vascular disease (19). A few months afterward, our first clinical publication appeared, demonstrating that LDL apoB was superior to TC or LDL-C as a predictor of the likelihood of angiographic coronary artery disease (20). Both were cross-sectional studies and neither apoB assay was standardized. In our study, we argued that LDL apoB was superior because the number of atherogenic particles was a more important determinant of the LDL-related injury to the arterial wall than the amount of cholesterol within the particles. Many similar studies followed with most, but not all, favoring apoB. In 1994, the assays of apoB and apoA-I were standardized (6)—an essential step for clinical application and an achievement for which Santica Marcovina and John Albers deserve particular credit—and results of prospective studies and clinical trials, using more reliable assays, became available. It is on these later results that we will focus.
Table 16.1 lists the five studies in which LDL-C or TC was equal to apoB to predict cardiovascular events. Even in these, there are inconsistencies such as the fact that in the Caerphilly Study LDL-C was more predictive than the LDL-C/HDL-C ratio, implying that a low HDL-C is protective, clearly an aberrant finding. In the other two studies, TC is equivalent to apoB, a finding not noted subsequently. By contrast, Table 16.2 lists 36 published observations in which apoB is superior to LDL-C to predict vascular risk. These studies cover asymptomatic subjects, younger subjects, older subjects, men, women, patients with vascular disease, patients with diabetes or the metabolic syndrome, and patients with and without symptomatic coronary artery disease being treated with hypolipidemic therapy. The study designs vary from case control, to nested case control, to the placebo and treatment wings of clinical trials, to prospective epidemiologic risk factor studies including the Framingham Offspring Study and AMORIS. All demonstrated apoB to be superior to LDL-C as an index of the risk of vascular events. By no means are all the studies of equal strength and therefore of equal weight. The largest studies with the greatest number of events show the greatest differences between apoB and LDL-C. Nevertheless, the breadth and depth of this evidence, the almost monotonous consistency of the outcome of the comparison, provide a massive and unassailable clinical foundation for the use of apoB in clinical practice.
Related posts:
 Pathophysiology and Vascular Biology of Atherosclerosis
Dyslipidemia in Children and Adolescents
Fish Oils in the Treatment of Dyslipidemia and Cardiovascular Disease
Use of Noninvasive Methods to Diagnose Cardiovascular Disease in Dyslipidemic Patients
Dyslipidemia in the Elderly: Special Insights to Inform the Management Strategy
Pharmacologic Treatment of Dyslipidemia and Cardiovascular Disease
Pathophysiology and Vascular Biology of Atherosclerosis
Dyslipidemia in Children and Adolescents
Fish Oils in the Treatment of Dyslipidemia and Cardiovascular Disease
Use of Noninvasive Methods to Diagnose Cardiovascular Disease in Dyslipidemic Patients
Dyslipidemia in the Elderly: Special Insights to Inform the Management Strategy
Pharmacologic Treatment of Dyslipidemia and Cardiovascular Disease
Stay updated, free articles. Join our Telegram channel

Full access? Get Clinical Tree


