Lipid-poor adrenal masses raise concerns about the underlying pathology. Herein we present a case of a patient with a lipid-poor adrenal mass that proved to be a rare adrenal leiomyosarcoma.
Case Report
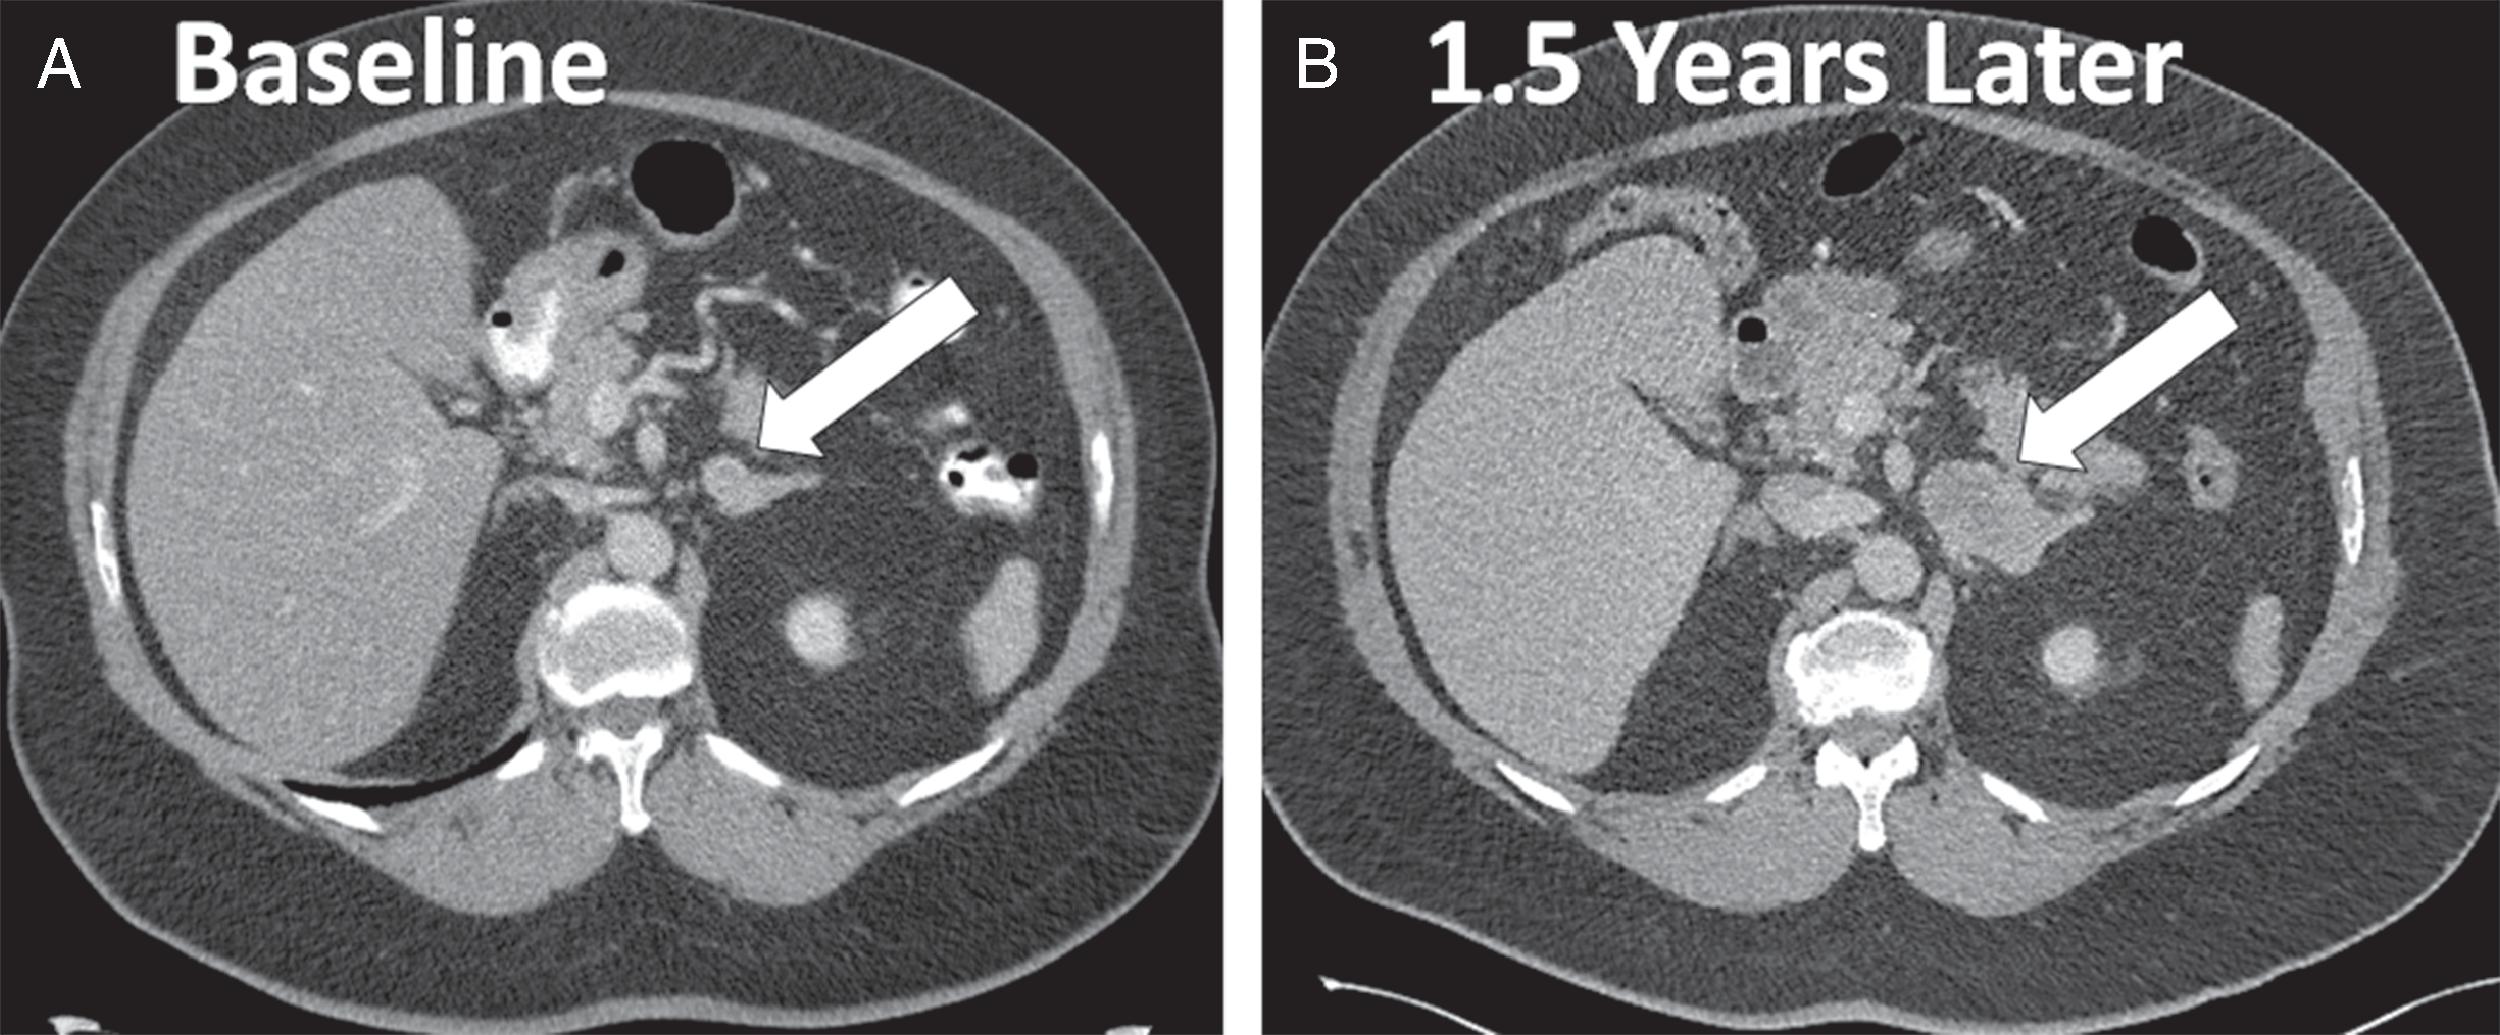
The patient was a 72-year-old man who was incidentally discovered to have a 2-cm left adrenal mass on an abdominal computed tomography (CT) scan that was obtained to evaluate abdominal pain ( Fig. 76.1 ). His physician advised follow-up CT scan 6 months later. However, the follow-upabdominal CT scan was not performed until1.5 years later, when the left adrenal mass measured 5.1 × 3.2 × 5.1 cm with an unenhanced CT attenuation of 32.3 Hounsfield units (HU) (see Fig. 76.1 ). He had no paroxysmal symptoms. He did have a 30-year history of hypertension, which was controlled with a four-drug program. Type 2 diabetes mellitus had been diagnosed 6 years previously. His weight had been stable. He had no signs or symptoms of Cushing syndrome. There was no history of hypokalemia. His medications included amlodipine, 10 mg daily; lisinopril, 20 mg daily; metoprolol, 50 mg daily; hydrochlorothiazide, 12.5 mgdaily; and metformin, 850 mg twice daily. On physical examination his body mass index was41.8 kg/m 2 , blood pressure 125/72 mmHg, and heart rate 69 beats per minute. He had no stigmata of an adrenal disorder. Heart and lung examinations were normal.
INVESTIGATIONS
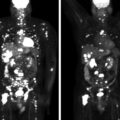
The laboratory studies were normal ( Table 76.1 ). There was no biochemical evidence of functioning pheochromocytoma, cortisol secretory autonomy, or primary aldosteronism. A F-18 fluorodeoxyglucose (FDG) positron emission tomography scan showed a FDG-avid left adrenal mass and no other areas of abnormal uptake ( Fig. 76.2 ).
| Biochemical Test | Result | Reference Range |
| Sodium, mmol/L Potassium, mmol/L Fasting plasma glucose, mg/dL Creatinine, mg/dL Aldosterone, ng/dL Plasma renin activity ng/mL per hour DHEA-S, mcg/dL 1-mg overnight DST, cortisol mcg/dL Plasma metanephrine, nmol/L Plasma normetanephrine, nmol/L | 138 4.4 115 0.9 8.1 6.8 199 <1.0 <0.2 0.56 | 135–145 3.6–5.2 70–100 0.8–1.3 ≤21 ng/dL ≤0.6–3 25–131 <1.8 <0.5 <0.9 |
Related posts:
 45-Year-Old Woman With Corticotropin-Independent Cushing Syndrome and Bilateral Adrenal Adenomas
 Adrenocortical Carcinoma Associated With Lynch Syndrome
 Metastatic Paraganglioma: Role for Systemic Chemotherapy
 Cushing Syndrome Associated With Ectopic Corticotropin and Corticotropin-Releasing Hormone–Secreting Pheochromocytoma
 A Huge Adrenal Myelolipoma in a Patient With a Suboptimally Controlled Congenital Adrenal Hyperplasia
 Catecholamine-Secreting Paraganglioma in Pregnancy
Stay updated, free articles. Join our Telegram channel

Full access? Get Clinical Tree


