Cell typea
–
Trypsinb (μg/mg protein)
Trypsin Inhibitorsc, d (μg/mg protein)
DPP-4e (ng/mg protein)
Proximal tubular
Supernatant
132
8.9
2.2
Pellet
243
15.2
19.3
Glomerular mesangial
Pellet
17
2.4
32.4
Myoctyes
Pellet
20
1.9
nil
Carcinoma
Supernatant
213
3
467
Pellet
445
6.3
–
10.3.2 Cellular Signal Response Due to Bik
Vero cells were induced with sterile Bik in serum-growth media at the G0 phase. Cell numbers declined by approximately half of initial cell counts at 24 h after Bik exposure, as shown in Fig. 10.1 (closed circles). Control cell cultures were revived with serum growth media and continued to double during the same time period. Phosphorylation of MAPK-ERK and MAPK-p38 was unchanged between control and exposed cells (data not shown here).
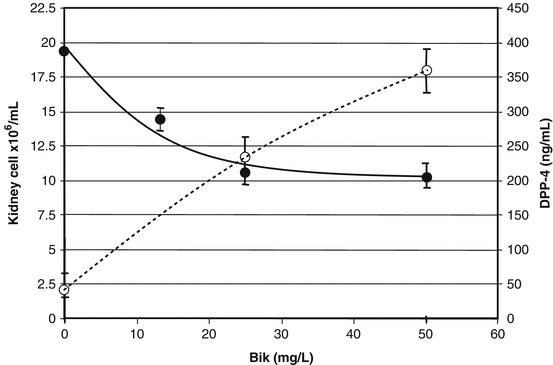

Fig. 10.1
Normal cell Loss and DPP-4 release upon exposure to Bik. Live cell count was performed with Trypan Blue staining. Cell cultures exposed to 25 mg/L Bik lost 50 % of cells within a 24 h period. Kidney cell (Vero) counts (closed circles) decreased with increasing Bik. In addition, Vero released DPP-4 (open circles) upon increased Bik exposure (units on right hand axis). Exposures and analysis were repeated in three separate trials
10.3.3 Membrane Disruption Due to Bik
Membrane disruption after Bik exposure was detected by membrane phosphatidylserine (PS)-binding dyes PSS-380 (see Table 10.2). PSS-380 binds PS on outer leaflet of cell membrane which presents only when the cell undergoes the dying process (Ma et al. 2004) Phosphatidylserine externalization was detected after 4 h of Bik treatment and increased with Bik amounts from 10 to 50 mg/L, as shown by the increased blue PSS-380 staining. Incorporation of the propidium iodide into the cell nucleus DNA was observed at a lesser extent after 24 h (data not shown here).
Table 10.2
Stress response in kidney and myocytes cells exposure to Bik
Bik mg/La | Caspase 3b | Caspase 8b | Caspase 9b | Intra-cellular calcium (μM)c | % Cells with outer membrane disruptiond | % Cells with inner membrane disruptiond | |||||
|---|---|---|---|---|---|---|---|---|---|---|---|
Inactive (32 kDa) | Active (17 kDa) | Inactive (57 kDa) | Active (43/18 kDa) | Inactive (47 kDa) | Active (37 kDa) | At 4 h | At 4 h | At 24 h | At 4 h | At 24 h | |
0 | + | – | + | – | + | – | 0.93 | 0 % | 2 % | 0 % | 0 % |
12.5 | + | – | + | – | + | – | 0.47 | 17 % | 42 % | 0 % | 5 % |
25 | + | – | + | – | + | – | 0.09 | NM | NM | NM | NM |
50 | + | – | + | – | + | – | 0.01 | 26 % | 57 % | 0 % | 14 % |
500 | + | – | + | – | + | – | 0.01 | NM | NM | NM | NM |
Apoptosis, or programmed cell death, was measured by western blot using antibodies for the intra-cellular caspase proteases 3, 8, and 9 (see Table 10.2). The absence of apoptosis signaling was confirmed in all cell models before and after exposure to Bik. Western blots showed no cleavage of caspase 3 into active forms (see Table 10.2). Inactive caspases 9 confirmed no intrinsic apoptosis signaling occurred. Caspases 8 remained inactivate which supported no extrinsic apoptosis signaling. There was no activation of apoptosis at extreme Bik exposure levels of 500 mg/L.
10.3.4 Calcium In-flux Blocking by Bik
The cellular calcium (Ca2+) was measured by fluorescent microscopy using a Ca2+ sensitive dye (Fluo-4 AM) (as previously described in Chap. 7). Harvested myocytes were treated with Bik or Uri. Muscle, and kidney cell cultures typically maintained intra-cellular Ca2 in the range of 0.08–0.12 μM. Cells exposed to Bik exhibited significantly reduced intra-cellular Ca2 concentration. Intra-cellular Ca2 decreased to 0.01 μM with increasing Bik concentrations. Cell lysates showed Bik was maintained on cell surfaces after washing.
10.3.5 Release of DPP-4 Due to Bik
We found kidney cell cultures did not release DPP-4 into the cell supernate (<10 ng/mL) unless cell cultures were exposed to Bik (see Table 10.2 and Fig. 10.1). This release increased with concentrations of Bik. Western blots showed released DPP-4 from membrane as the expected 110 kDa monomeric form along with bands 77, 50, and 45 kDa for fragments. Release of DPP-4 occurred within 4 h of Bik exposures and was reproducible in separate experiments.
Dipeptidyl Peptidase 4 (DPP-4) was detected more in cell membranes compared to cell supernate. In agreement with literature, DPP-4 was detected in kidney and carcinoma cells but not myocytes (see Table 10.1) (Mentlein 2004). The high concentration of DPP-4 in proximal tubular cells was expected as the peptidase is part of the brush border membrane and participates in protein absorption by hydrolysis of proline containing peptides (Mueller et al. 1990; Thompson et al. 1985). However the presence of DPP-4 was not previously reported for glomerular mesangial cells.
10.3.6 Proliferation
The high level of Trypsin and Trypsin inhibitor expression in the proximal tubular cells reflect their dynamic living status. Proximal tubular epithelial cells play a pivotal role in kidney disease. Most renal cell carcinoma and kidney cancer arises from this region. During inflammation, endothelial and epithelial cellular proliferation is signaled by trypsin-type serine proteases which generate wound healing. Trypsin and thrombin cleave Protease Activated Receptors (PAR) which increases phospholipase C (PLC), adenylcyclase (AC), and phosphatidylinositol 3-kinase (PIK3) activation of ERK 1/2 mitogen-activated protein kinase (MAPK/ERK). MAPK/ERK activation plays a key role in cell growth and differentiation through transcriptional activation. Active PAR also increases cytosolic phospholipase A2 (PLA2) synthesis of prostaglandins causing nuclear receptor signaling of transcriptions.
10.3.7 Activation of PI3K-Akt Pathway by Bik
Phosphorylated and non-phosphorylated forms of PI3K were measured by ELISA with cell cultures before and after exposure to Bik and Uri (see Fig. 10.2). Activated PI3K was increased in cells when exposed to Bik and Uri. Increased activity would reduce immobilization of calcium from storage organelles by inositol 1,4,5 triphosphate. Phosphorylation of PI3K increased more with the exposure to Uri. Protein kinase B (Akt) is an important target of increased PI3K phosphorylation. Phosphorylated and non-phosphorylated forms of Akt were measured at the same time points using ELISA. Cell exposed to Bik did not increase in Akt phosphorylation. Cells exposed to Uri showed Akt activation in a dose-dependent manner (see Fig. 10.2). The highest level of Akt phosphorylation occurred at 500 mg/L of Uri. A drop in PI3K activation was noted at 500 mg/L.
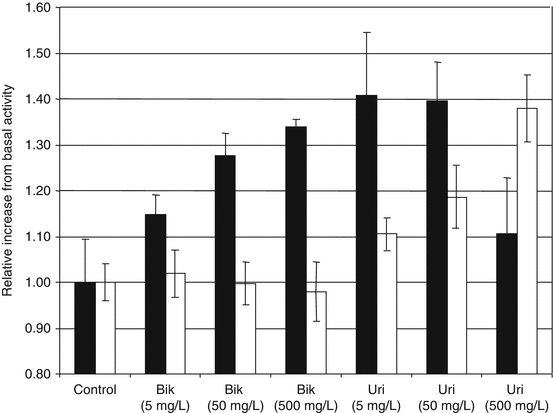

Fig. 10.2
Activation of PI3K/Akt with Bikunin and Uristatin. The relative increases in phosphoralyation of phosphatidylinosinol 3 kinase (PI3K) (solid bars) and Akt (open bars) are shown for epitheilal (Vero) cell cultures simulated with 0, 5, 50, and 500 mg/L of Bik or Uri. Measurements were performed using immunoassays for both phosphoralyation and non- phosphoralyation forms of PI3K and Akt. Exposures and analysis were repeated in three separate trials
10.3.8 Bik Active Site Study
The structure indicates the two Kunitz domains and two oligosaccharide chains. Colored peptides were labeled with letters in parentheses “(A) to (E)” (see Fig. 10.3).
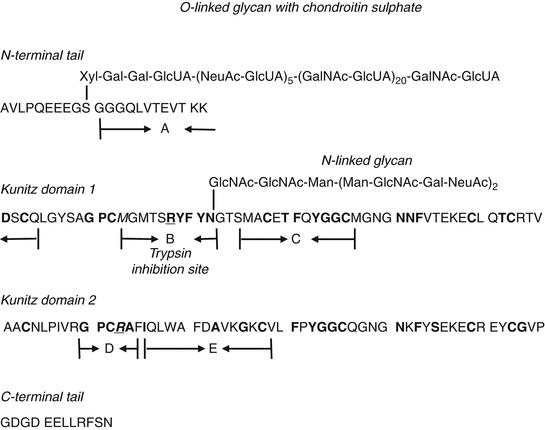

Fig. 10.3
Peptide analogs and aprotinin comparison to Bik predicted structure. The predicted full length Bikunin (Bik) peptide and carbohydrate sequence is compared to five synthetic peptides and aprotinin. Peptides in bold are a match to the aprotinin sequence. Underlined peptides are the predicted contact points between trypsin- aproptinin based on X-ray structure. This single Kunitz binding domain has matching peptides (darkened circles) to both inhibitor domains of Bik. The location of the predicted active site (Underlined circles), an arginine (R) or lysine (K) peptide which can be locked into the trypsin pocket is shown for Bik domain 1 and 2. The likely antibody binding site is the arginine peptide in the middle of peptide region B. The region B arginine is connected to N-linked glycan (RYFYN) and an example of a glycoconjugated protease inhibitor. For Bik domain II, the predicted trypsin binding site is an arginine (R) peptide. The other peptides of the domain II active site also match the preferred and strongest trypsin binding sequences of GPCR and are examples of a peptide-only protease inhibitor This active site was not mimicked by peptide D as the native sequence must be in a distorted conformation to cause trypsin inhibition
The mAb 3G5 responded well to Bikunin and Uristatin at ~1 ng/well and showed no cross-reactivity to aprotinin even at an excess of 10,000 ng/well. The mAb 3G5 also responded to peptide B at 362 ng/well, that supporting the epitope in this region. The affinity for purified Bikunin standard was compared to that for native Bikunin in diabetic urine specimens. The antibody affinity of ~2.9 × 10¹¹ was reduced for many diabetics when the urine was not diluted. Diluting urine (5 μL) in PBS (45 μL) eliminated the urine sample matrix affect. Undiluted urine inhibiting mAb binding in some patients supports additional associating molecules.
Trypsin inhibition was observed with Bik, Uri, and aprotinin (see Table 10.3). The loss of the O-linked glycan in Uri did not impact inhibitory strength. Synthetic peptides A–E were not inhibitory to trypsin. The results suggested that a secondary structure for the bikunin molecule is needed for trypsin inhibition. The mAb 421.3G5 was able to bind only fragment B, which is the region for N-linked polysaccharide. The affinity is much lower than for the purified Bik standard (362 ng/well vs. 1 ng/well), indicating that this mAb recognizes both the amino acids and N-linked sugars of fragment B. Inhibition of trypsin was prevented when Bikunin was bound to mAb 3G5 in peptide region B (see Table 10.3 an Fig. 10.3). This supports the explanation that mAb was binding the region B of Bik where is active sitde of inhibition.
Table 10.3
Bikunin active site study for trypsin inhibition and antibody binding
Inhibitora | % Trypsin inhibitionb | Antibody binding in ng/wellc | Restored of trypsin inhibitiond |
|---|---|---|---|
Average (standard deviation) | Average (standard deviation)
Stay updated, free articles. Join our Telegram channel
Full access? Get Clinical Tree
 Get Clinical Tree app for offline access

|

