A proposal to explain the divergent nature of a special subtype of breast cancer presenting with casting type calcifications and/or an asymmetric density with architectural distortion on the mammogram.
Introduction
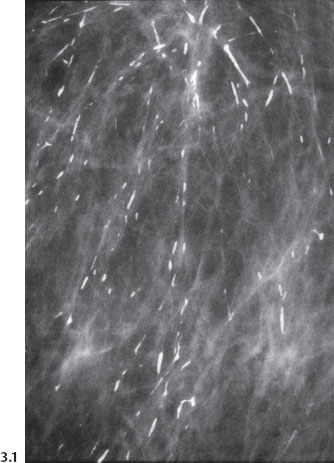
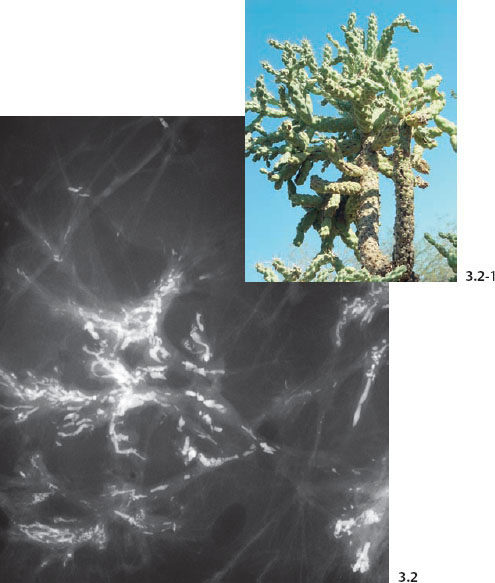
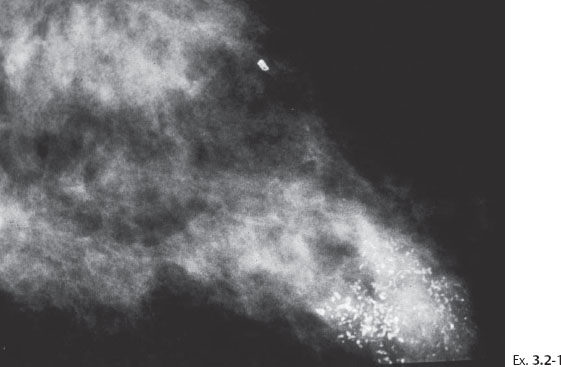
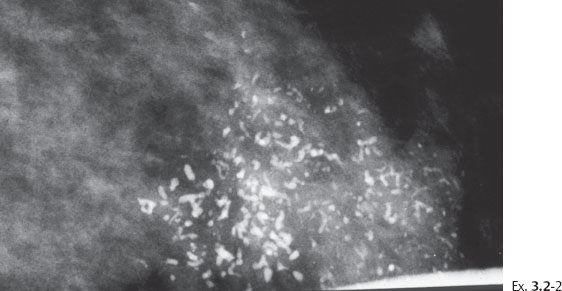
The branching, rodlike calcifications on the mammogram outline the ducts and their branches. If the calcifications were localized within the preexisting duct system (“in situ” in its literal meaning), they would point toward the nipple, resulting in a harmonious image, as the plasma-cell mastitis type calcifications do (Fig. 3.1). “Casting type calcifications,” on the other hand, point in random directions in a disorderly and haphazard manner (Fig. 3.2). The discrepancy on the mammogram between the petrified fluid within the preexisting ducts (“secretory disease type” calcifications, a benign process) and the casting type calcifications (a malignant entity) is so striking that the distinction can be made with a high degree of accuracy by analyzing the mammograms.
Comparison of Benign and Malignant Intraductal Calcifications
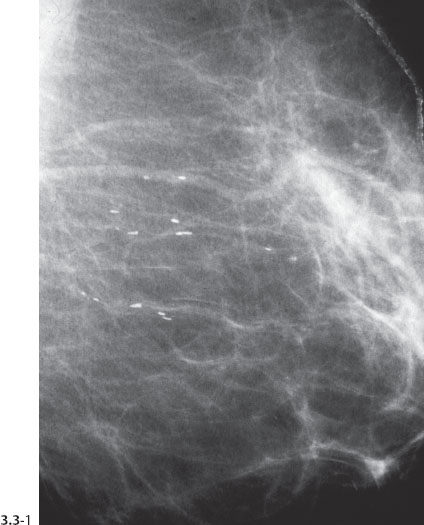
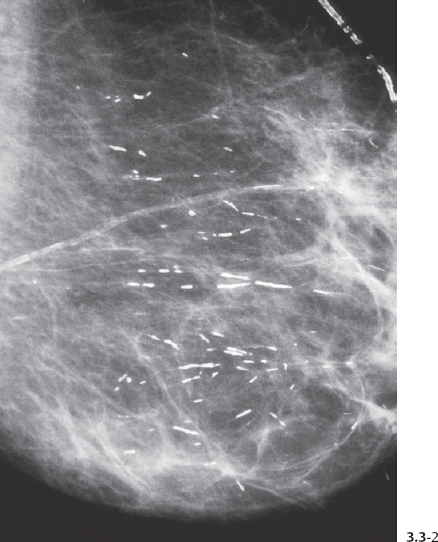
Fig. 3.3-2 The same case six years later. The orderly pattern of these benign intraductal calcifications is considerably different from the disorganized pattern seen in casting type (malignant) intraductal calcifications shown in Figs. 3.4 to 3.7.
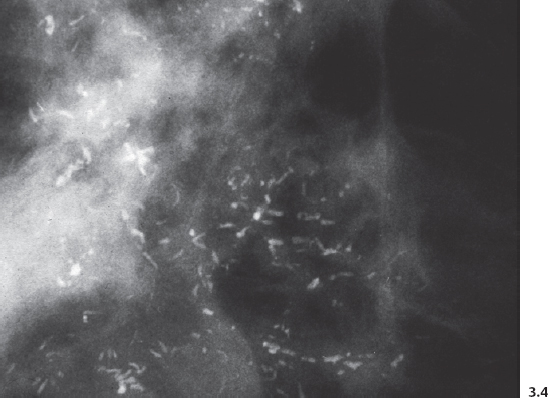
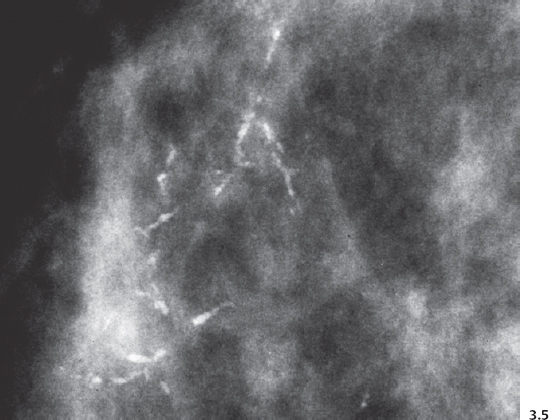
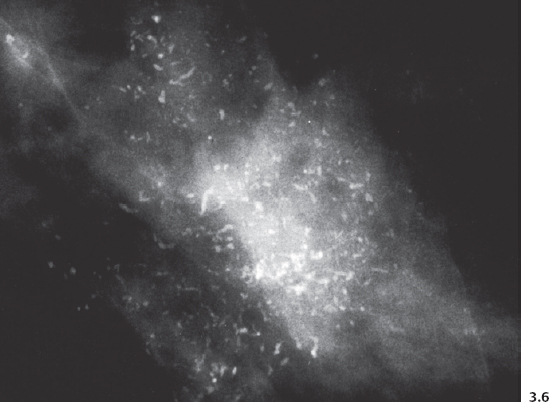
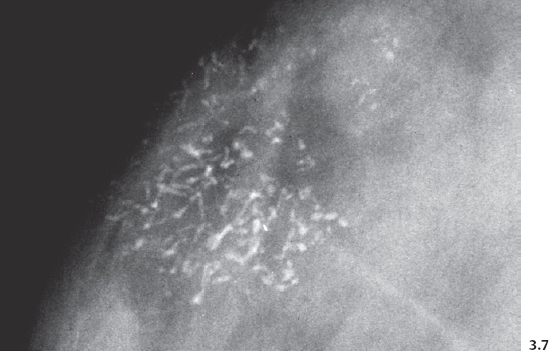
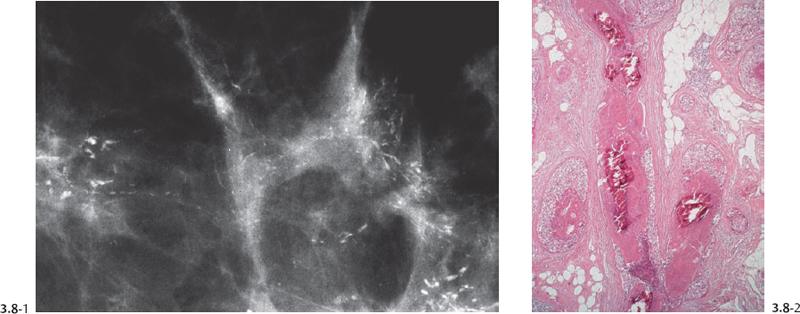
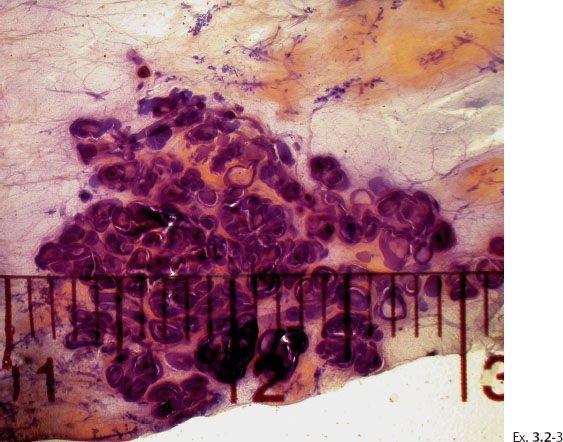
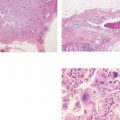
Fig. 3.8-1 & 2 Mammographic-conventional histological comparison of casting type calcifications in high-grade DCIS.
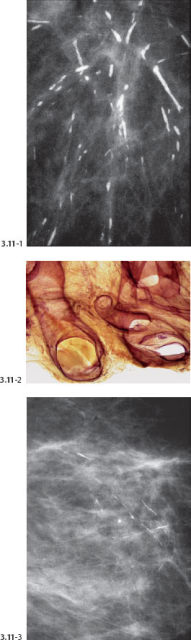
Fig. 3.11-1 to 3 Subgross histological image of the inspissated fluid within distended ducts (2). Calcification of this fluid leads to the formation of “plasma cell mastitis type calcifications” (1 & 3).
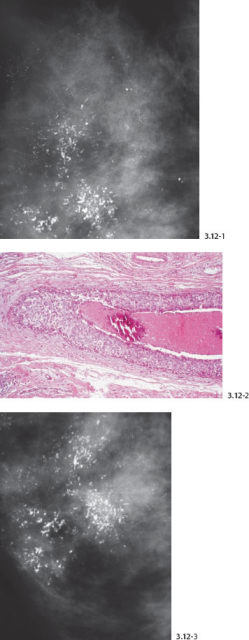
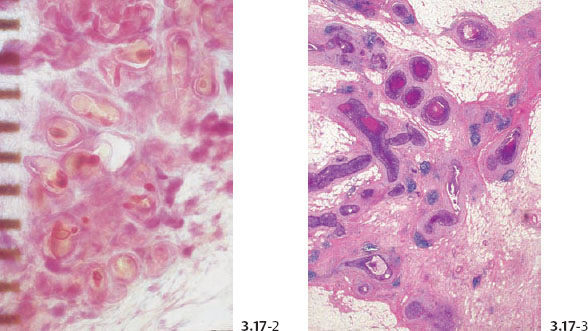
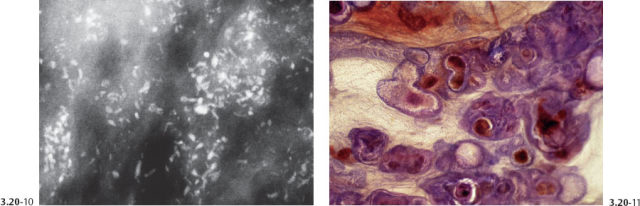
Fig. 3.12-1 to 3 Casting type calcifications (1 & 3) with histological comparison (2).
The Theory of Ductoneogenesis
Comparison of benign and malignant intraductal calcifications:
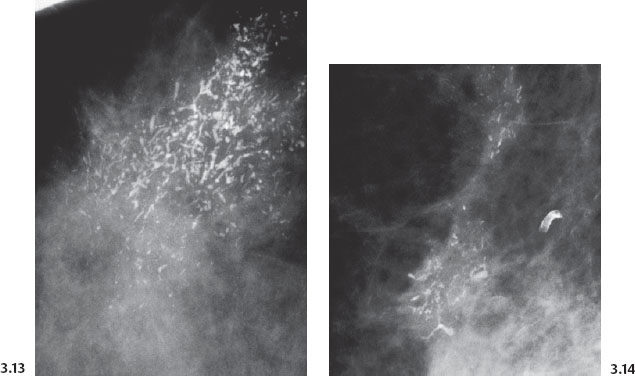
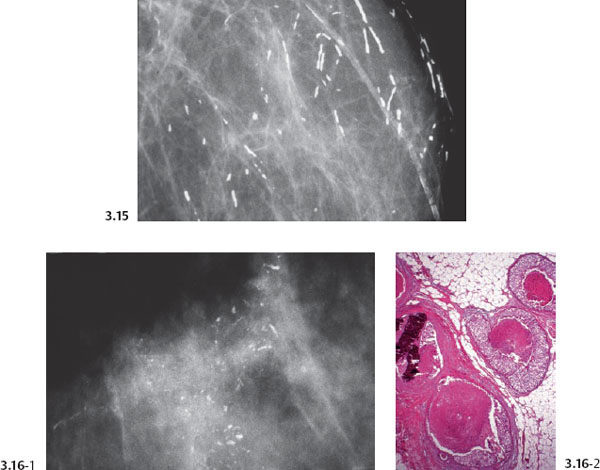
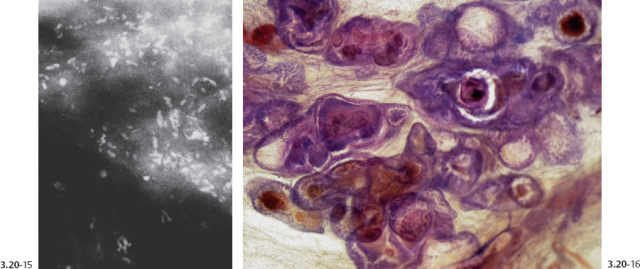
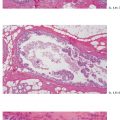
Fig. 3.13& 3.14 Additional cases of malignant, casting type calcifications (Figs. 3.13, 3.14, 3.16-1) compared to “secretory disease” type (benign) calcifications on Fig. 3.15.
Proposal of the Theory of Neoductgenesis
The failure of the casting type calcifications to follow the orderly ductal pattern can lead to the conclusion that many of them are localized within tubelike/ductlike structures that have been formed by the disease itself, although some of them may be localized within the preexisting duct system as well. In this breast cancer subtype the dominant feature appears to be the formation of new ducts or ductlike structures. We propose that this process be called “neoductgenesis.” This theory helps explain many features of this breast cancer subtype which might otherwise seem contradictory.
Morphological Demonstration of Neoductgenesis
 (A) Unnaturally High Concentration of Ductlike Structures within a Limited Area
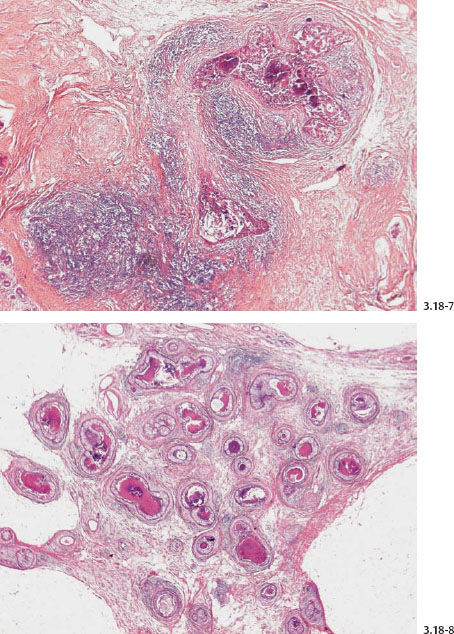
The prominent feature of neoductgenesis is an unnaturally high concentration of ductlike structures within a limited area. These are greatly distended by malignant cells, central necrosis, and occasional amorphous calcifications.
 (B) Desmoplastic Reaction and Extensive Lymphocytic Infiltration
Many of these densely packed, ductlike structures are surrounded by desmoplastic reaction and extensive lymphocytic infiltration.
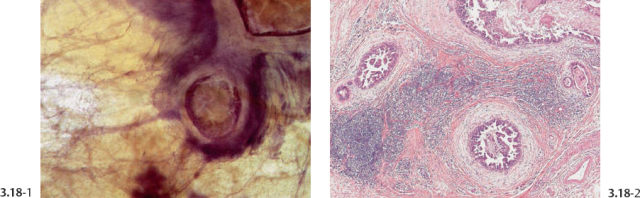
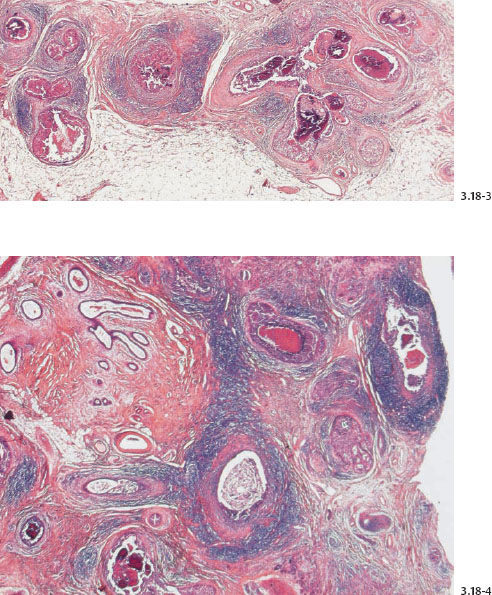
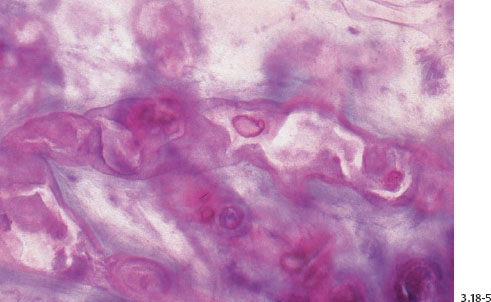
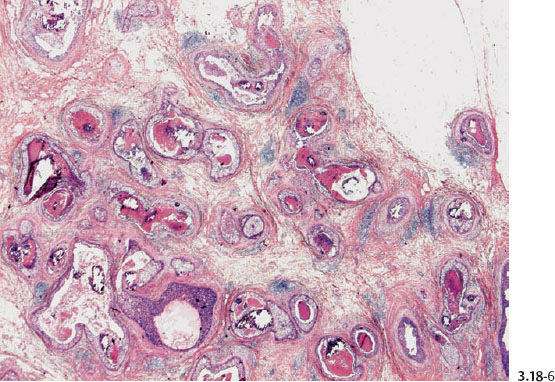
Fig. 3.18-6 & 8 The large number of tightly packed ductlike structures can be better appreciated on these lower-power images.
 (C) Disorganized Architecture
The architecture bears little resemblance to that of a normal duct system. While the normal ducts have a regular pattern of arborization terminating in TDLUs, the pathological ducts have a haphazard pattern with ducts pointing in random directions. There is also a remarkable lack of TDLUs on the newly formed ducts.
 (D) Pathologic Ducts: Contorted and Crowded Closely Together
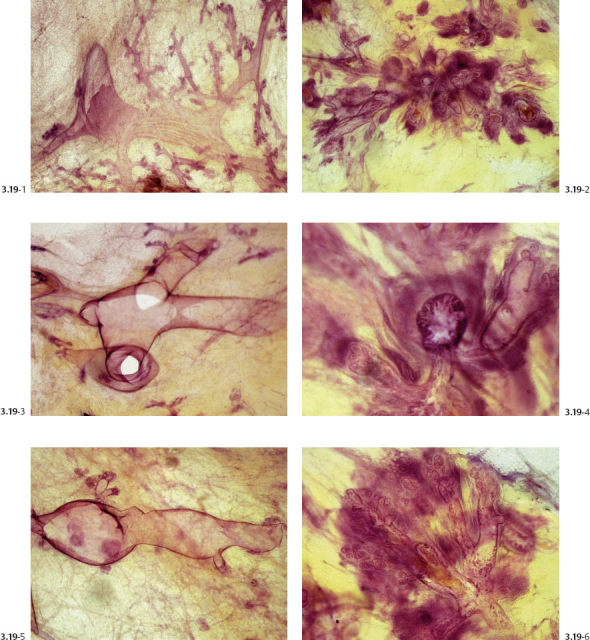
On subgross histology, these pathological ducts are contorted, are crowded closely together, and may have numerous small buds surrounded by a lymphocytic reaction. The subgross histological images strongly support the theory that new ducts are being formed. The term coated infiltration may appropriately convey that the newly formed duct retains the ability to produce a basement membrane while simultaneously penetrating the surrounding tissues. Neoductgenesis can also explain the lack of TDLUs attached to these long, contorted, abnormal “ducts,” since the process of neoductgenesis does not appear to have the ability to produce TDLUs.
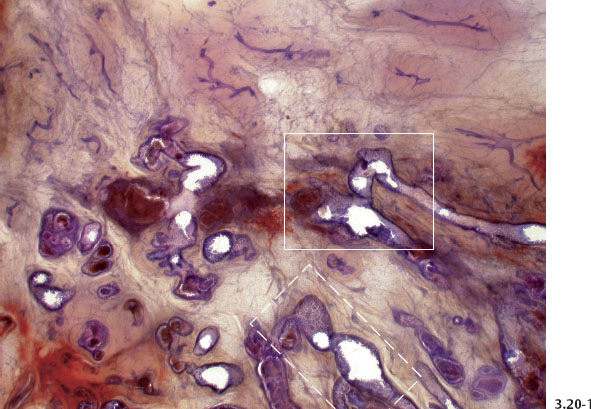
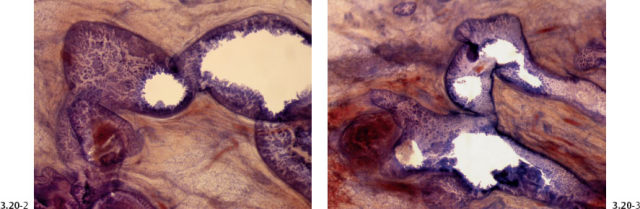
Fig. 3.20-2 & 3 Higher-power subgross histological images of the area outlined by the dashed and solid rectangles in Fig. 3.20-1.
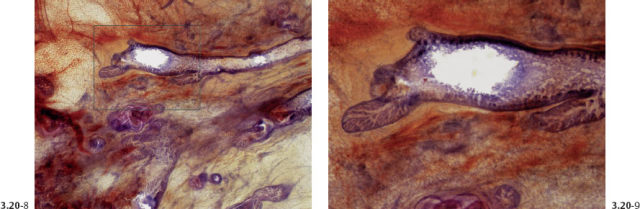
Histological Demonstration of Multiple Newly Formed Ducts
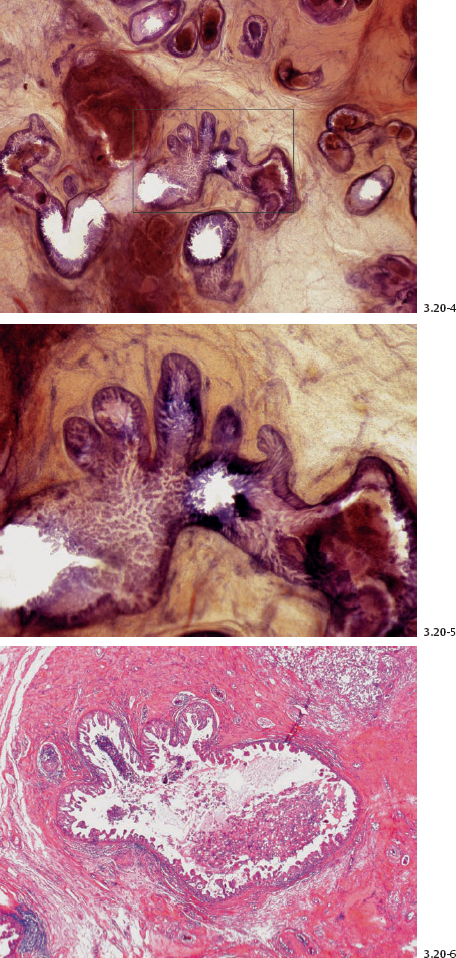
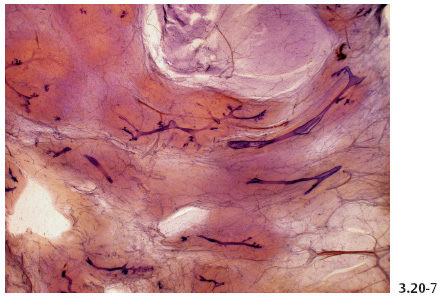
Fig. 3.20-7 Subgross image of normal breast tissue demonstrating the normal milk duct configuration and distribution. The ducts are narrow and widely spaced.
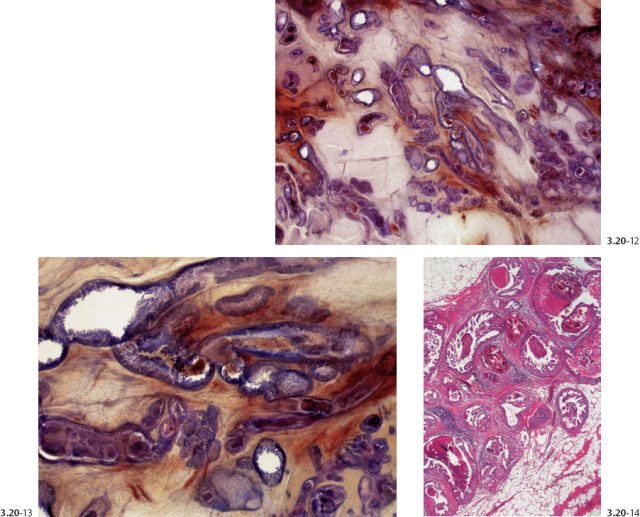
Figs. 3.20-12 to 14 Subgross (12 & 13) and conventional (14) histological images of the contorted ducts containing micropapillary in situ carcinoma.
The subgross, thick section (3D) histology images provide further insight into the configuration of these newly formed, abnormal ducts while enabling us to make a direct comparison with the surrounding normal breast structure.
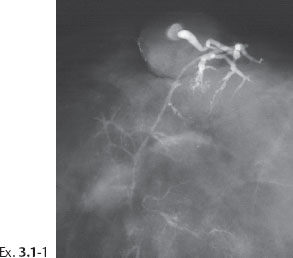
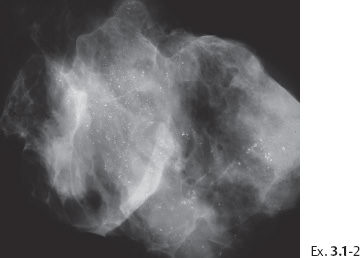
Example 3.1
A 36-year-old woman with bloody secretion from the right nipple.
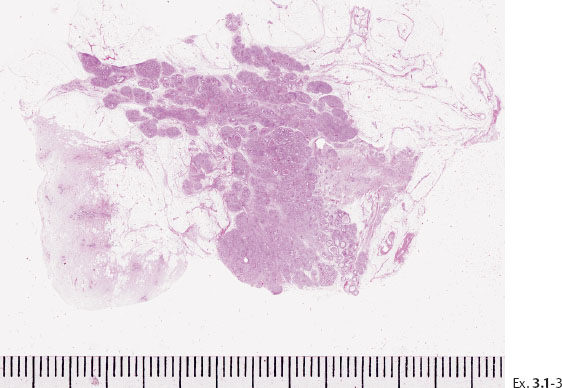
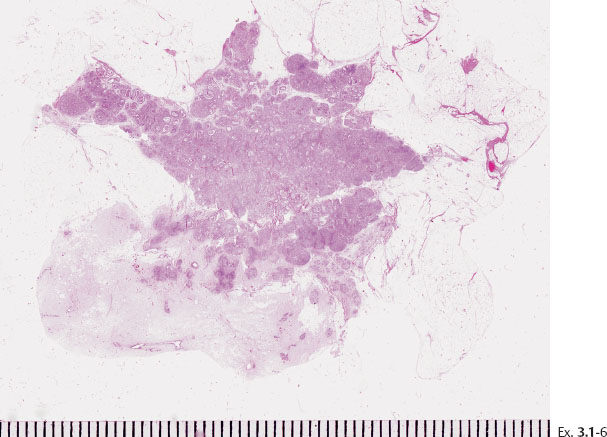
Ex. 3.1-3 Large-section histology: 45 mm × 32 mm area with Grade 3 DCIS. Involved margin.
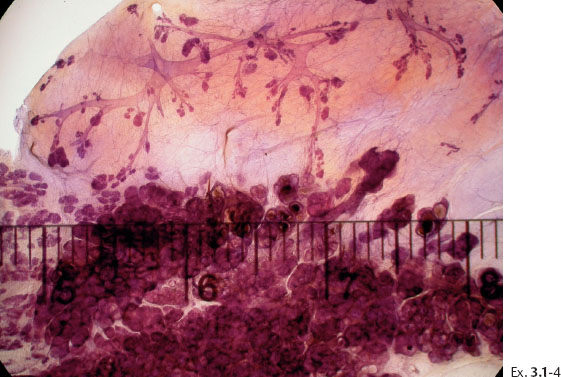
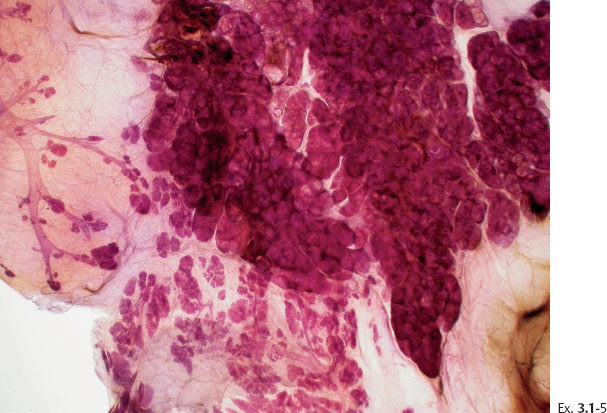
Ex. 3.1-5 The thick-section, subgross histology technique makes it possible to directly compare the distribution and architecture of normal ducts and TDLUs with the cancerous, ductlike structures. These do not resemble preexisting ducts in terms of orientation, size, shape, or architecture.
Ex. 3.1-7 to 12 Subgross, thick section and conventional histological images of the pathological ducts distended by cancer cells, necrotic debris, and amorphous calcifications.
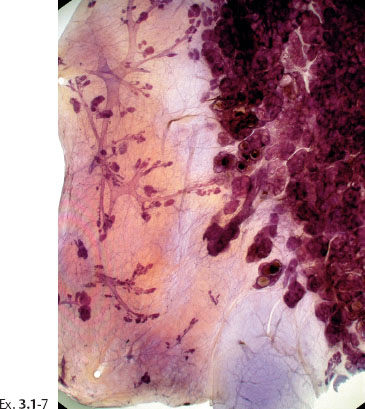
Ex. 3.1-7 Subgross histological image.
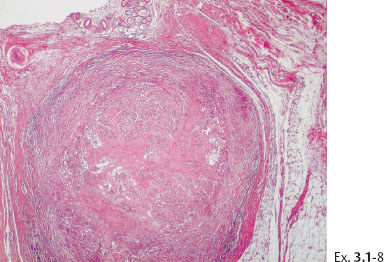
Ex. 3.1-8 A distended duct with solid cell proliferation and central necrosis.
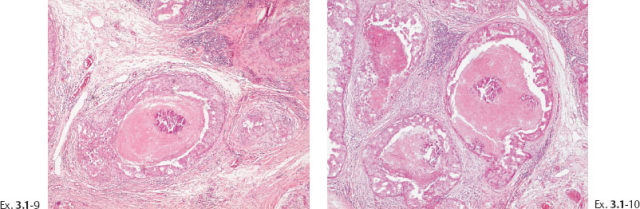
Ex. 3.1-9 & 10 The cancerous ducts contain amorphous calcifications within the central necrosis.
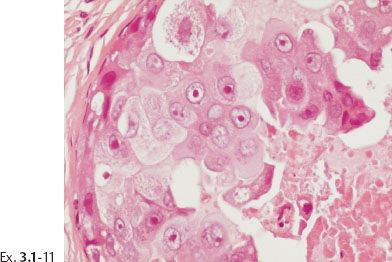
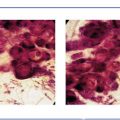
Ex. 3.1-11 Grade 3 cancer cells with necrosis.
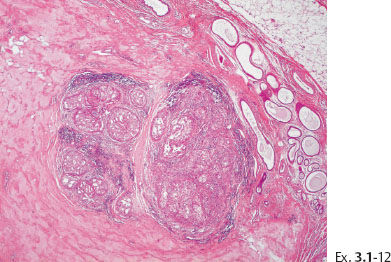
Ex. 3.1-12 Extensive periductal lymphocytic infiltration.
Treatment and follow-up: Mastectomy, no adjunctive treatment. The patient was recurrence-free at her most recent follow-up examination, seven years after her treatment.
A 59-year-old asymptomatic woman, screening examination. Her mother died from breast cancer.
< div class='tao-gold-member'>
Related posts:
 Recognition of the Unpredictable, Often Fatal Nature of the Breast Cancer Subtype Presenting with Casting Type Calcifications on the Mammogram
 Illustrative Cases with 3-Dimensional Stereoscopic Histological Images
 The Deviant Nature of the Breast Cancer Subtype with Castings
 The Evolution of Casting Type Calcifications
 Description of Calcifications Localized within the Ducts
 Colorectal and Anal Tumors


