Aging, a highly individualized process, is known to be related to changes in the physical, cognitive, emotional, social, and economic status of older adults. Increasing age is primarily associated with negative changes in these areas (e.g., increased comorbidity, decreased function, limited social support). These age-associated changes may occur singly or in combination, with broad variation among older adults. Moreover, they often result in considerable consequences not just for aging individuals themselves but simultaneously for health care systems, families, and caregivers.
A common late-life experience is a cancer diagnosis. According to the National Cancer Institute (NCI), aging is the most important risk factor for cancer, with most cancers occurring in persons aged 65 years and older. Over the last several decades, cancer trends have been changing contemporaneously with our knowledge of aging. Because of the increased heterogeneity of older populations, treating older cancer patients seldom means treating only the cancer. Furthermore, with improved screening and treatments, larger numbers of older cancer patients are experiencing longer-term survival. Unfortunately, even though older adults make up the largest segment of the cancer population, they are often undertreated and are seldom included in clinical trials. Few clinical trials are even designed to identify optimal treatments for them.
The combined effects of cancer and aging are of concern because of graying populations worldwide (a larger proportion aging in industrialized countries; greater numbers aging in developing countries). Although we cannot truly anticipate the changes that rapid population aging will bring, we can attempt to understand the epidemiological patterns of aging and cancer, where they intersect, and their potential implications. Such understanding will provide a frame of reference to address age-related disparities in research, education, and treatment in the older adult cancer population. Because of growing numbers alone, it is certain that management of cancer in older adults will continue to be a complex, resource-intensive, and increasingly common problem.
What follows herein is an overview of topics pertaining to the epidemiology of cancer and aging. Trends in cancer incidence and mortality are examined, and the specific characteristics and unique issues related to older cancer patients are described. Special attention is provided to the survivorship experience of older cancer patients, along with a summary of the challenges associated with studying them.
Incidence and Mortality: Then and Now
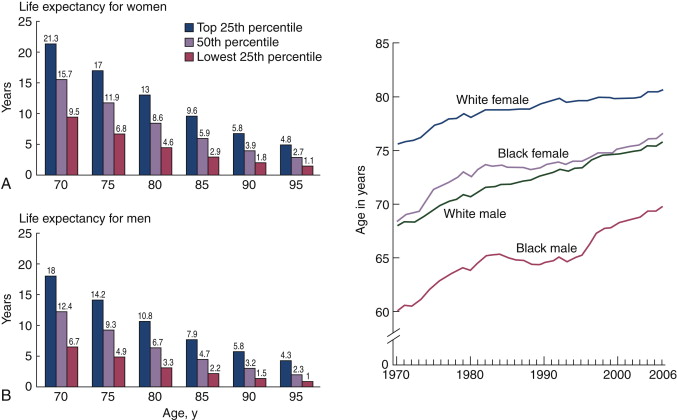
There have been remarkable changes in the United States population over the last century. One hallmark of these changes is the expansion of the older (65 years and older) population ( Figure 1-1 ). U.S. Census Bureau estimates show that the percentage of Americans 65 years and older has more than tripled (from 4.1% in 1900 to 12.8% in 2008). The older population itself is getting older; in 1940, 4.1% of the older population was 85 years or older (the “oldest old”), whereas in 2008, 14.7% was in this group. This trend toward greater longevity is reflected by tremendous growth in the centenarian population (approximately 120% from 1990 to 2008) and the current life expectancy estimates of older adults ( Figure 1-2 ). After the middle of the twentieth century, life expectancy at age 65 years increased moderately (5 years for men, 8 years for women) relative to life expectancy gains at birth. In recent years (1990 to 2005), the gap in life expectancy between older white and black people has been stable and narrower than at birth (difference at age 65 years approximately 2 years for men and 1 year for women).
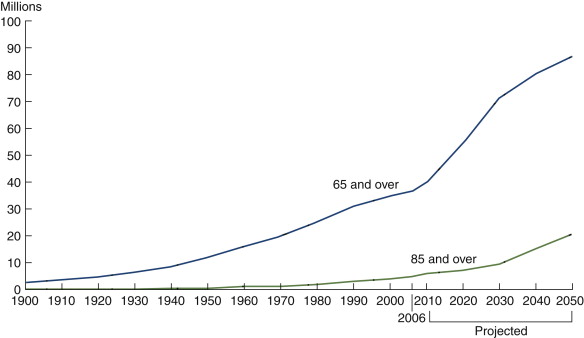
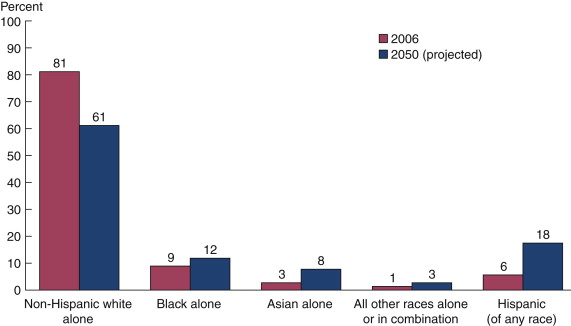
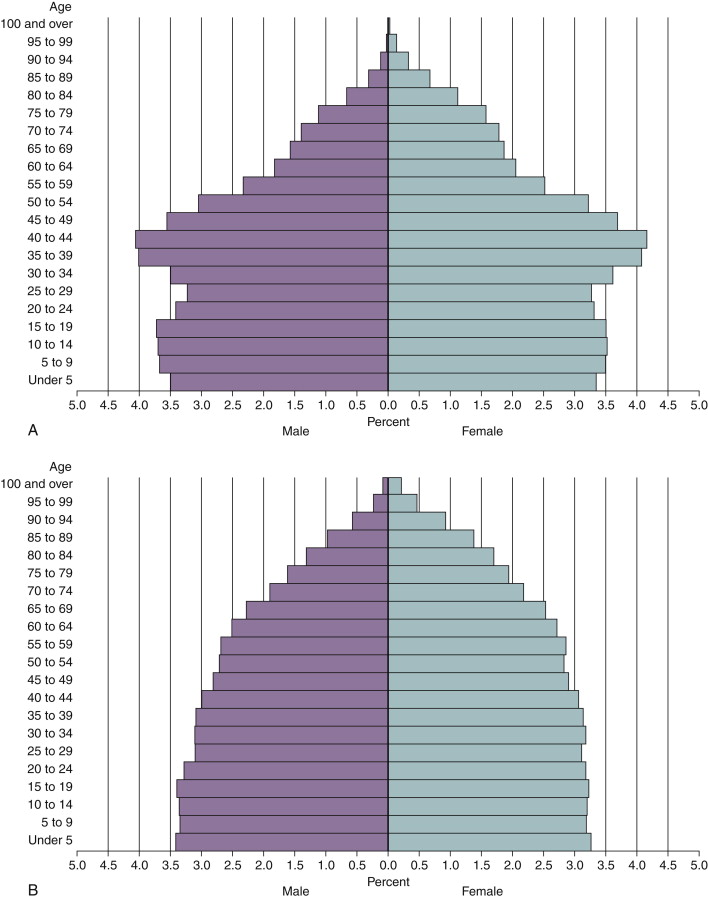
These aging trends will hasten with the senescence of the Baby Boom generation, but, on the basis of previous life expectancies, not necessarily uniformly across sex and race/ethnicity. The number of older Americans is expected to more than double by 2050 (increasing from 39 million in 2008 to 89 million) with substantial growth in older minority segments ( Figure 1-3 ) and increasingly in female “oldest-olds.” The U.S. Census Bureau also projects by 2050 a nearly 225% increase in persons aged 100 years and older (from 2008) and that, for the first time in United States history, the population older than 65 years will outnumber the population younger than 15 years. Figure 1-4 shows the overall projected age shift in the U.S. population pyramid from 2000 to 2050.
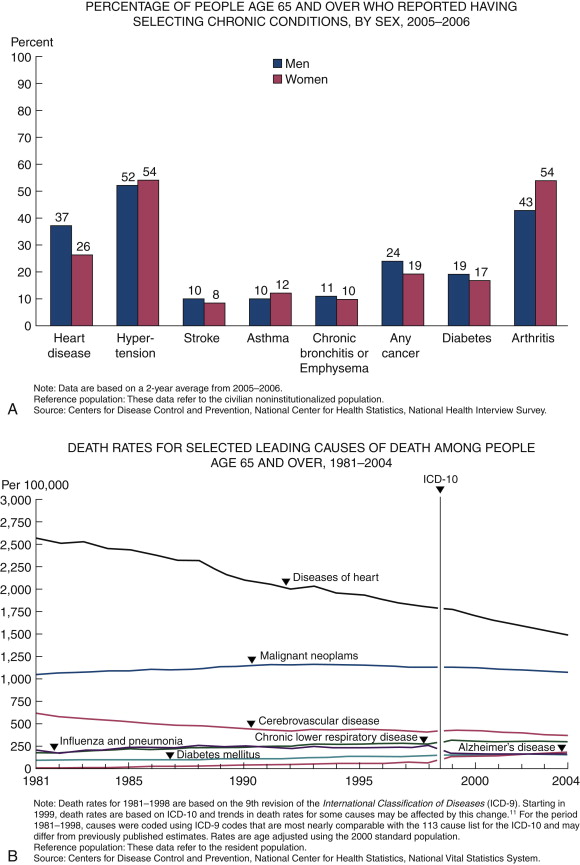
As older Americans live longer than ever before, the inevitable shift in the population age structure foreshadows many challenges. Importantly, whether or not years added later in life are healthy, enjoyable, and productive depends in large part on prevention and control of potentially debilitating and sometimes fatal chronic diseases such as cancer. Figure 1-5 shows that cancer is the fourth most common chronic disease and the second leading cause of death in older adults in the United States. Cancer is a disease that disproportionately affects older adults. Over the past decades, cancer incidence and mortality trends in the oldest population showed a greater burden than for those in the so-called young-old (65 to 74 years) and younger populations ( Figure 1-6 ).
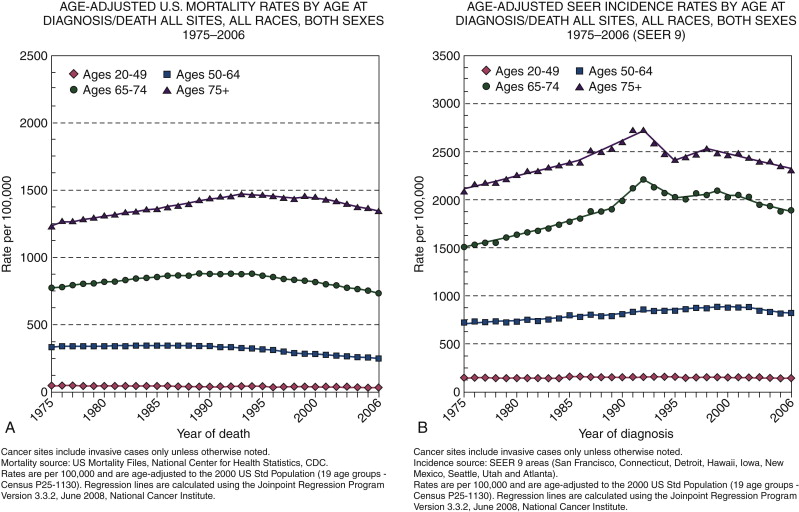
The increased risk of cancer in older adults is proposed to be related to two main age-linked processes. Because cancer is a multistep process, over the course of longer lives there is both increased opportunity for DNA damage and longer exposure to potential carcinogens. Older adults, therefore, may have greater potential for accrued molecular damage coexisting with age-related decreased cellular repair activity leading to malignancies. This is supported by the epidemiological evidence, which consistently shows at least twofold or higher all-cause cancer mortality and incidence rates in older adults since SEER reporting began in 1975. From 2002 to 2006, the median age at diagnosis for cancer of all sites was 66 years. However, looking at more finely stratified older age groups during the same period, approximately 24.9% of all cancers were diagnosed between 65 and 74 years, 22.2% between 75 and 84 years, and 7.6% at 85 years of age and older. These patterns hold across most primary cancer types. Within the older age groups, controversies exist over evidence pointing to a potential drop of cancer incidence and mortality in the oldest-old group. These data raise unresolved questions as to whether the effect is real and, if so, whether it is due to selective survival, an interaction with late-life biology, or both.
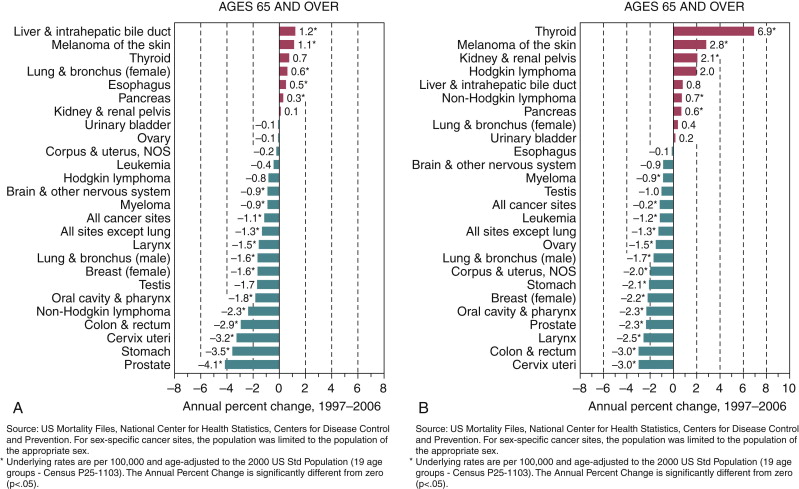
Trends in recent years in the older U.S. population show decreases in age-adjusted all-cause cancer mortality and incidence (−1.1 and −1.2 annual percent change 1997 to 2006, respectively). However, trends and risks vary considerably by primary cancer site and sex ( Figure 1-7 and Table 1-1 ). In people 65 years of age and older, lung cancer incidence and mortality increased for women and decreased for men. Nonetheless, it was the second leading cancer site and the most fatal cancer (approximately 30% of all cancer deaths) in both women and men. The second- and third-ranked fatal cancers were breast and colorectal cancers in women and colorectal and prostate cancers in men. All showed varied but decreased mortality and incidence over time. The risk of colorectal cancer rose precipitously with age, with 91% of cases diagnosed in individuals aged 50 years of age and older, with moderate decreases in mortality and incidence (−2.9 and −3.0 annual percent change 1997 to 2006, respectively).
| Cancer Site | Sex | Age Group | ||||
|---|---|---|---|---|---|---|
| Birth to 39 Years (Percentage) | 40 to 59 Years (Percentage) | 60 to 69 Years (Percentage) | 70 Years and Older (Percentage) | Birth to Death (Percentage) | ||
| All sites † | Male | 1.42 (1 in 70) | 8.44 (1 in 12) | 15.71 (1 in 6) | 37.74 (1 in 3) | 43.89 (1 in 2) |
| Female | 2.07 (1 in 48) | 8.97 (1 in 11) | 10.23 (1 in 10) | 26.17 (1 in 4) | 37.35 (1 in 3) | |
| Urinary bladder ‡ | Male | 0.02 (1 in 4448) | 0.41 (1 in 246) | 0.96 (1 in 104) | 3.57 (1 in 28) | 3.74 (1 in 27) |
| Female | 0.01 (1 in 10,185) | 0.12 (1 in 810) | 0.26 (1 in 378) | 1.01 (1 in 99) | 1.18 (1 in 84) | |
| Breast | Female | 0.48 (1 in 208) | 3.79 (1 in 26) | 3.41 (1 in 29) | 6.44 (1 in 16) | 12.03 (1 in 8) |
| Colon and rectum | Male | 0.08 (1 in 1296) | 0.92 (1 in 109) | 1.55 (1 in 65) | 4.63 (1 in 22) | 5.51 (1 in 18) |
| Female | 0.07 (1 in 1343) | 0.72 (1 in 138) | 1.10 (1 in 91) | 4.16 (1 in 24) | 5.10 (1 in 20) | |
| Leukemia | Male | 0.16 (1 in 611) | 0.22 (1 in 463) | 0.35 (1 in 289) | 1.17 (1 in 85) | 1.50 (1 in 67) |
| Female | 0.12 (1 in 835) | 0.14 (1 in 693) | 0.20 (1 in 496) | 0.77 (1 in 130) | 1.07 (1 in 94) | |
| Lung and bronchus | Male | 0.03 (1 in 3398) | 0.99 (1 in 101) | 2.43 (1 in 41) | 6.70 (1 in 18) | 7.78 (1 in 13) |
| Female | 0.03 (1 in 2997) | 0.81 (1 in 124) | 1.78 (1 in 56) | 4.70 (1 in 21) | 6.22 (1 in 16) | |
| Melanoma § | Male | 0.16 (1 in 645) | 0.64 (1 in 157) | 0.70 (1 in 143) | 1.67 (1 in 60) | 2.56 (1 in 39) |
| Female | 0.27 (1 in 370) | 0.53 (1 in 189) | 0.35 (1 in 282) | 0.76 (1 in 131) | 1.73 (1 in 58 | |
| Non-Hodgkin lymphoma | Male | 0.13 (1 in 763) | 0.45 (1 in 225) | 0.58 (1 in 171) | 1.66 (1 in 60) | 2.23 (1 in 45) |
| Female | 0.08 (1 in 1191) | 0.32 (1 in 316) | 0.45 (1 in 223) | 1.36 (1 in 73) | 1.90 (1 in 53 | |
| Prostate | Male | 0.01 (1 in 10,002) | 2.43 (1 in 41) | 6.42 (1 in 16) | 12.49 (1 in 8) | 15.78 (1 in 6) |
| Uterine cervix | Female | 0.15 (1 in 651) | 0.27 (1 in 368) | 0.13 (1 in 761) | 0.19 (1 in 530) | 0.69 (1 in 145) |
| Uterine corpus | Female | 0.07 (1 in 1499) | 0.72 (1 in 140) | 0.81 (1 in 123) | 1.22 (1 in 82) | 2.48 (1 in 40) |
∗ For people free of cancer at beginning of age interval.
† All sites exclude basal and squamous cell skin cancers and in situ cancers except urinary bladder.
‡ Includes invasive and in situ cancer cases.
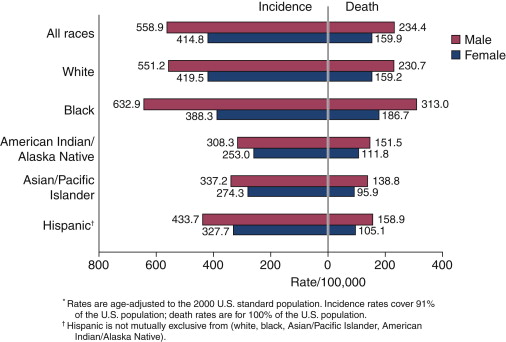
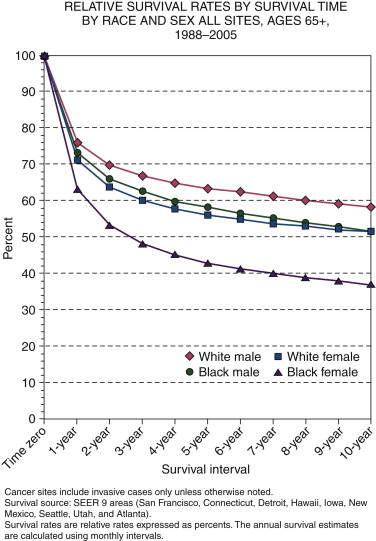
There are also considerable differences in cancer burden and survival across race and ethnic populations ( Figures 1-8 and 1-9 ). All-cause cancer incidence and mortality rates have been higher, and relative survival rates lower, for African-Americans in comparison to whites. Hispanic, Asian, Pacific Islander, American Indian, and Alaska Native persons generally have lower incidence rates than whites, except for several specific cancers (e.g., stomach, liver, cervix, kidney, and gallbladder). This general pattern of lower incidence among racial and ethnic minorities has been attributed to younger age structures. However, cancer disparities in incidence, mortality, and late-stage presentation also exist within these groups by geography, national origin, economic status, and other factors. By 2050 and beyond, these disparities are expected to transition into the older age groups as demographic changes (i.e., growth in older and minority populations) intersect to drive increases in cancer incidence.
Characteristics of Older Patients with Cancer
As has been noted, age is the single most important risk factor for the development of cancer; yet, many risk factors that affect the general population are also contributors to cancer risk in older adults. These same risk factors are often associated not only with cancer, but also with common diseases and disabilities of aging (e.g., chronic diseases such as heart disease or hypertension, limitations in physical function). In turn, these risk factors and associated conditions can greatly affect treatment decision making, responses to treatment, and outcomes. Some risk factors such as smoking, diet, and physical exercise are modifiable, whereas others such as family history and race are not (for example, genetic factors are estimated to account for up to 10% of prostate, breast, and colorectal cancers). The World Health Organization estimates that more than 30% of cancer deaths in the general population can be prevented by modifying risk factors ( Table 1-2 ). The effect of these factors may be magnified in older adults because of their association not just with cancer but with other common causes of morbidity and death as well. What follows is an examination of some common modifiable risk factors and their impact in relation to cancers and treatment-related issues in older adults. Genetic risk factors are not addressed because of their tendency to be less age-specific, nor are environmental risk factors addressed because of their overall variability in older adults.
| Total Deaths | PAF (%) and Number of Attributable Cancer Deaths (Thousands) for Individual Risk Factors | PAF Due to Joint Hazards of Risk Factors | |
|---|---|---|---|
| Worldwide | |||
| Mouth and oropharynx cancers | 311 633 | Alcohol use (16%; 51), smoking (42%; 131) | 52% |
| Esophageal cancer | 437 511 | Alcohol use (26%, 116), smoking (42%; 184), low fruit and vegetable intake (18%; 80) | 62% |
| Stomach cancer | 841 693 | Smoking (13%; 111), low fruit and vegetable intake (18%; 147) | 28% |
| Colon and rectum cancers | 613 740 | Overweight and obesity (11%; 69), physical inactivity (15%; 90), low fruit and vegetable intake (2%; 12) | 13% |
| Liver cancer | 606 441 | Smoking (14%; 85), alcohol use (25%; 150), contaminated injections in health-care settings (18%; 111) | 47% |
| Pancreatic cancer | 226 981 | Smoking (22%, 50) | 22% |
| Trachea, bronchus, and lung cancers | 1 226 574 | Smoking (70%; 856), low fruit and vegetable intake (11%; 135), indoor smoke from household use of solid fuels (1%; 16), urban air pollution (5%; 64) | 74% |
| Breast cancer | 472 424 | Alcohol use (5%; 26), overweight and obesity (9%; 43), physical inactivity (10%; 45) | 21% |
| Cervix uteri cancer | 234 728 | Smoking (2%; 6), unsafe sex (100%; 235) | 100% |
| Corpus uteri cancer | 70 881 | Overweight and obesity (40%; 28) | 40% |
| Bladder cancer | 175 318 | Smoking (28%; 48) | 28% |
| Leukemia | 263 169 | Smoking (9%; 23) | 9% |
| Selected other cancers | 145 802 | Alcohol use (6%; 8) | 6% |
| All other cancers | 1 391 507 | None of selected risk factors | 0% |
| All cancers | 7 018 402 | Alcohol use (5%; 351), smoking (21%; 1493), low fruit and vegetable intake (5%; 374), indoor smoke from household use of solid fuels (0·5%; 16), urban air pollution (1%; 64), overweight and obesity (2%; 139), physical inactivity (2%; 135), contaminated injections in health-care settings (2%; 111), unsafe sex (3%; 235) | 35% |
| High-Income Countries | |||
| Mouth and oropharynx cancers | 40 559 | Alcohol use (33%; 14), smoking (71%; 29) | 80% |
| Esophageal cancer | 57 752 | Alcohol use (41%; 24), smoking (71%; 41), low fruit and vegetable intake (12%; 7) | 85% |
| Stomach cancer | 146 267 | Smoking (25%; 36), low fruit and vegetable intake (12%; 17) | 34% |
| Colon and rectum cancers | 256 791 | Overweight and obesity (14%; 37), physical inactivity (14%; 36), low fruit and vegetable intake (1%; 3) | 15% |
| Liver cancer | 102 033 | Smoking (29%; 29), alcohol use (32%; 33), contaminated injections in health-care settings (3%; 3) | 52% |
| Pancreatic cancer | 110 154 | Smoking (30%; 33) | 30% |
| Trachea, bronchus, and lung cancers | 455 636 | Smoking (86%; 391), low fruit and vegetable intake (8%; 36), indoor smoke from household use of solid fuels (0%), urban air pollution (3%; 12) | 87% |
| Breast cancer | 155 230 | Alcohol use (9%; 14), overweight and obesity (13%; 20), physical inactivity (9%; 15) | 27% |
| Cervix uteri cancer | 16 663 | Smoking (11%; 2), unsafe sex (100%; 17) | 100% |
| Corpus uteri cancer | 26 955 | Overweight and obesity (43%; 12) | 43% |
| Bladder cancer | 58 636 | Smoking (41%; 24) | 41% |
| Leukemia | 73 110 | Smoking (17%; 12) | 17% |
| Selected other cancers | 57 095 | Alcohol use (8%; 5) | 8% |
| All other cancers | 509 507 | None of selected risk factors | 0% |
| All cancers | 2 066 388 | Alcohol use (4%; 88), smoking (29%; 596), low fruit and vegetable intake (3%; 64), indoor smoke from household use of solid fuels (0%; 0), urban air pollution (1%; 12), overweight and obesity (3%; 69), physical inactivity (2%; 51), contaminated injections in health-care settings (0·5%; 3), unsafe sex (1%; 17) | 37% |
Smoking is considered the leading cause of preventable death in the United States, accounting for nearly one of five deaths each year. Regardless of age, smoking is by far the most important risk factor for the development of lung cancer (about 90% of lung cancer deaths in men and 80% in women are due to smoking). The longer one smokes, and the greater amount smoked daily, the more lung cancer risk increases. Thus, older smokers are at particularly high risk, as evidenced by their having the highest probabilities of having lung cancer overall ( Table 1-1 ). According to the U.S. Surgeon General, smoking is also associated with an increased risk of at least 14 other types of cancer (nasopharynx, nasal cavity and paranasal sinuses, lip, oral cavity, pharynx, larynx, esophagus, pancreas, uterine cervix, kidney, bladder, stomach, and acute myeloid leukemia). Although the U.S. Surgeon General does not currently recognize smoking as a risk factor for colorectal cancer, there is evidence that it is. The increased colorectal cancer risk among smokers is hypothesized to be due to cancer-causing substances in tobacco and/or the relation between smoking and alcohol use (colorectal cancer has been linked to alcohol use). Smoking is also known to be a major cause of other chronic conditions commonly affecting older adults, such as heart disease, cerebrovascular disease, and chronic lower respiratory disease ( Figure 1-5 ), all of which can greatly complicate cancer treatment options and tolerance. Although older adults have the lowest current smoker rates (under 10%), older former smokers may represent considerable past exposures. With the actual number of older adults increasing and the higher smoking rates in minorities, interactions of smoking-related health problems in the older population will continue to be of serious concern.
Obesity is a growing epidemic in the United States and is not limited to younger populations. The Centers for Disease Control (CDC) estimates that nearly 30% of the 65-and-older population is obese, with even higher rates in minority populations. There are many negative health outcomes associated with obesity. It is associated with excess mortality, as well as with increased risk of heart disease, diabetes, osteoarthritis, cancer, and disability. In the case of cancer, studies have estimated that obesity may contribute to up to 6% of U.S. incident cancer cases. It has been linked to cancers of the colon, breast (postmenopausal), endometrium, kidney, esophagus, gallbladder, ovaries, and pancreas. Furthermore, obesity has been associated with a worse prognosis for certain cancers (e.g., breast, colon, lymphoma, and prostate) and a greater risk for disease recurrence. Unfavorable survival rates in obese cancer patients may be related to the higher likelihood of associated comorbid conditions or unfavorable tumor characteristics. Detection of breast tumors is more difficult in obese than in lean women and may explain findings that higher body mass is associated with advanced stage breast cancer and, in turn, poorer prognosis. In addition, studies demonstrating systematic underdosing of chemotherapy in overweight and obese breast cancer patients suggest another potential factor in poorer survival rates. The unique challenges and increased complications associated with older obese cancer patients directly influence planning, delivery, and tolerance of cancer treatments. Current demographics predict a rise in the risk of morbidity and death from obesity-related cancers common in older adults, resulting from the burgeoning numbers of older Americans (especially minorities), the increasing prevalence of obesity, and persistent racial differences in obesity.
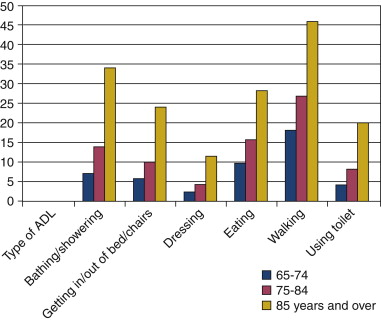
Diet and physical activity are two other important modifiable risk factors for common cancers in older adults. As with smoking and obesity, diet and physical activity are closely related to some cancers (e.g., prostate, colorectal, breast) and to other diseases and conditions of aging. For instance, eating well and exercising may reduce the risk not only of cancer but also of heart disease, stroke, type 2 diabetes, bone loss, and anemia. Diet and exercise are, obviously, also related to obesity and being overweight, as discussed previously. Importantly, this constellation of health-related factors may play a key role in cancer treatment decision making and tolerance. Unfortunately, physical activity may be less modifiable in older adults than in younger populations because a sedentary lifestyle in older adults may not actually be a choice but a consequence of coexisting functional limitations. Figure 1-10 shows how age is associated with a decreased ability to accomplish daily activities in community-dwelling older adults. Older minorities, especially African-Americans and Hispanics, have an even greater number of functional disabilities than their white counterparts. In general, older adults who are functionally dependent have a lower life expectancy and stress tolerance, including tolerance for the stress of cancer treatment. Difficulty shopping, preparing meals, or eating can greatly affect the diet of older adults, for whom nutrition is a health concern that directly affects cancer treatments and tolerance. Even though regular physical activity, maintenance of a healthy body weight, and a healthy diet are widely considered to reduce cancer risk, the lifestyle changes required to achieve them may not be feasible in older adults.

