Chapter Outline
ORGANIZATION OF THE MEMBRANE SKELETON
RED CELL MEMBRANE DEFORMABILITY AND STABILITY
MEMBRANE CHANGES ASSOCIATED WITH AGING AND SENESCENCE OF RED CELLS
Pleiotropic Effects of Red Cell Aging
Vesiculation and Microparticle Formation
CD47 “Don’t Eat Me versus Eat Me” Switch
The erythrocyte membrane is the most thoroughly studied biologic membrane. It is a small structure, less than 0.1% of the cell’s thickness and only about 1% of its weight, but its easy accessibility has enabled researchers to characterize both its primary structure and a number of its important functions. It was the original example of the fluid mosaic membrane model, a breakthrough concept proposed by Singer and Nicolson, more than 40 years ago. In this model the erythrocyte membrane is composed of mobile, asymmetrically distributed proteins and lipids that interact in a variety of ways. The model has been revised in the intervening four decades, because many membrane proteins are not freely mobile but are instead diffuse in complicated patterns or are confined to discrete domains. In this chapter I will discuss normal membrane structure, emphasizing aspects that are most involved in the genesis of membrane disease. Diseases of the red cell membrane are covered in Chapter 16 .
Membrane Lipids
Lipid Composition
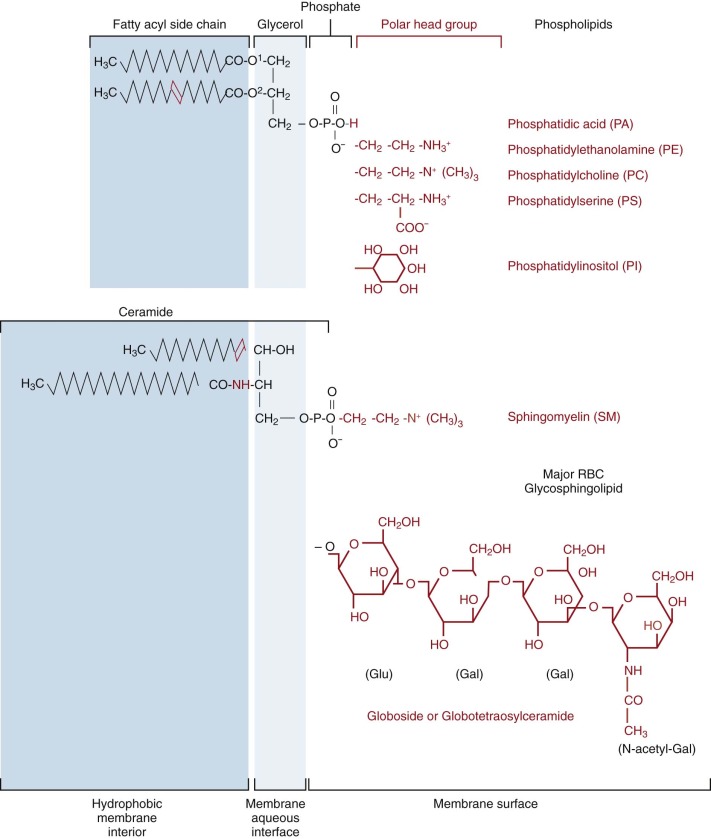
Lipids compose about 50% of the weight of the red cell membrane ( Table 15-1 ) or about 1.6% of the weight of the hemoglobin. Phospholipids and unesterified (free) cholesterol predominate and are present in nearly equal proportions (cholesterol/phospholipid molar ratio = 0.80). Small amounts of glycolipids, principally globoside (73% of the glycosphingolipids) ( Fig. 15-1 ) are also present. The average red cell contains about 250 million phospholipid molecules, 195 million cholesterol molecules, 10 million glycolipid molecules, and 6 million protein molecules in a membrane whose total surface area is about 140 µm 2 .
| Component | Wt% | Gm/Membrane (×10 13 ) | Approximate No. of Molecules/Membrane (×10 6 ) | % in Outer Half of Bilayer * | % in Inner Half of Bilayer * |
|---|---|---|---|---|---|
| Proteins and glycoproteins † | 55 | 5.7 ‡ | 6 | ||
| Lipids | 45 | 4.7 | 475 | ||
| Phospholipids § | 28 | 3.0 | 250 ‖ | ||
| Sphingomyelin (SM) | 6.8 | 0.73 | 60 | 85 | 15 |
| Phosphatidyl choline (PC) | 7.0 | 0.75 | 65 | 70 | 30 |
| Phosphatidyl ethanolamine (PE) | 7.4 | 0.79 | 65 | 20 | 80 |
| Phosphatidyl serine (PS) | 4.3 | 0.46 | 40 | 0 | 100 |
| Phosphatidyl inositols (PI) | 1.0 | 0.10 | 8 | 0 | 100 |
| PI | 0.34 | 0.036 | 3 | ||
| PI-4-P | 0.22 | 0.024 | 2 | ||
| PI-4.5-PP | 0.39 | 0.042 | 3 | ||
| Phosphatidic acid (PA) | 1.0 | 0.10 | 8 | 10 | 90 |
| Lysophosphatidyl choline (LPC) | 0.3 | 0.03 | 3 | Unknown | Unknown |
| Lysophosphatidyl ethanolamine (LPE) | 0.3 | 0.03 | 3 | Unknown | Unknown |
| Cholesterol § | 13 | 1.3 | 195 | ~50 | ~50 |
| Glycolipids ¶ | 3 | 0.3 | 10 | 100 | 0 |
| Free fatty acids ** | 1 | 0.1 | 20 | Unknown | Unknown |
| 100 | 10.4 | 481 |
† An average of three reported values in Fairbanks et al.
‡ Calculated from data in Table 15-2 .
§ Based on data in Ferrell and Huestis.
‖ Number of phospholipids per membrane based on an average molecular weight of 723 calculated from the average red cell phospholipid polar head group and fatty acid composition.
¶ Based on data in Sweeley and Dawson.
Phospholipids
Phosphatidylcholine (PC), phosphatidylethanolamine (PE), sphingomyelin (SM), and phosphatidylserine (PS) are the predominant phospholipids (see Table 15-1 ). Their structures are shown in Figure 15-1 . Small amounts of phosphatidic acid (PA), phosphatidylinositol (PI), and lysophosphatidylcholine (Lyso-PC) are also present.
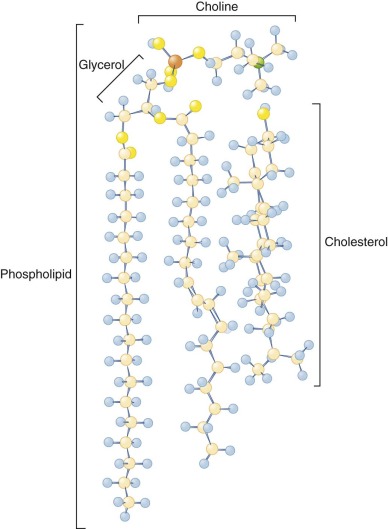
At physiologic pH, PS, PA, and PI have a net negative charge, whereas the other phospholipids are electrically neutral. The polar head groups of PC and SM tend to lie parallel to the membrane surface ( Fig. 15-2 ). The head groups of PE and PS are smaller and more cone shaped, which may help them fit in the inner bilayer.
With the exception of SM and Lyso-PC, the phospholipids have two fatty acids attached to a glycerol backbone. These are usually of similar length and attached through an ester linkage, although sometimes, particularly in PE, one of the fatty acids is a vinyl ether (plasmalogen). Typically, the fatty acid attached to glycerol farthest from the polar head group ( sn- 1 position) is saturated and the nearer ( sn- 2 position) one is unsaturated. PE and PS are more unsaturated than PC. In contrast, both acyl side chains are usually saturated in the SMs and the amide-linked chain (see Fig. 15-1 ) is often very long and interdigitates with the hydrocarbon chains of the opposite side of the bilayer. The SM amide linkage also makes its interface region more polar. The lysophospholipids have only one fatty acid and are named for the hemolysis induced because of their detergent-like properties.
Modern lipid analysis reveals hundreds of phospholipid molecular species in the red cell membrane. The majority of these are in a planar bilayer with their polar head groups exposed at each surface and their hydrophobic fatty acyl side chains buried in the bilayer core. The phospholipid head groups are probably organized in regular patterned arrays. The interactions that determine these patterns probably also influence the proportion of different phospholipids in the membrane.
Glycolipids and Cholesterol
Glycolipids and cholesterol are intercalated between the phospholipids in the bilayer with their long axes perpendicular to the bilayer plane (see Fig. 15-2 ). Red cell glycolipids are located entirely in the external half of the bilayer with their carbohydrate moieties extending into the aqueous phase. They carry many important red cell antigens, including A, B, H, Le a , Le b , and P.
Cholesterol is present on both sides of the bilayer and is nearly saturated in the red cell membrane, that is, its concentration is just below the concentration where major changes in its organization occur. Its distribution is not known, but it is probably slightly more prevalent in the outer half, owing to its high affinity for sphingomyelin, which is concentrated in the outer bilayer. Cholesterol can flip from one side of the bilayer to the other in a fraction of a second. This facilitates membrane bending, because the movement of cholesterol can offset the difference in surface pressure caused by bending and compressing one of the bilayers relative to the other. Cholesterol depletion promotes inward curvature of the membrane, whereas cholesterol enrichment favors outward deflection.
Cholesterol molecules are relatively buried, because the 3-OH group, the part of the molecule that is at the aqueous interface, lies approximately at the level of the carbonyl group of the phospholipid fatty acids (see Fig. 15-2 ). Cholesterol has important functions in buffering the fluidity of phospholipid side chains and in forming “lipid rafts,” as will be described.
Asymmetric Organization of Phospholipids in the Bilayer
Trans Asymmetry
Red cell membrane phospholipids, like membrane proteins (see later), are asymmetrically distributed across the bilayer plane. Choline phospholipids (PC and SM) are concentrated in the outer half of the bilayer and amino phospholipids (PE and PS) and PI are largely confined to the inner half (see Table 15-1 ).
The asymmetric distribution of phospholipids reflects a steady state involving a constant exchange (flip-flop) of phospholipids between the two bilayer hemileaflets. In the red cell membrane, spontaneous transmembrane diffusion is slow, lasting several hours to a day. In contrast, the enzymatic translocation of phospholipids, described in the following paragraphs, is much faster (minutes). At least three distinct activities are involved in regulating red cell membrane phospholipid asymmetry. They are discussed in several relatively recent reviews.
Flippase.
The magnesium adenosine triphosphate (Mg 2+ -ATP)-dependent aminophospholipid translocase, or “flippase,” is responsible for localization of PS in the inner leaflet by rapidly translocating it from the outer to inner leaflet. The half-time for translocation is about 5 minutes at 37°C. A similar activity exists in all mammalian red cells and probably in all cells. The flippase contains a critical cysteine, because it is inhibited by sulfhydryl-modifying reagents. It is also inhibited by the pseudosubstrates of P-type ATPases, such as vanadate, and by high concentrations of Ca 2+ .
Unfortunately, despite almost two decades of effort, the flippase has not been definitely identified. An assortment of phospholipid transporters have been characterized in cells and organelles from bacteria to humans, and some of these have been identified in red cell membranes, including ATP8A1. ATP8A1 is an Mg 2+ -ATPase first described in bovine chromaffin granules. It is a P4-type ATPase, has the size and characteristics of the red cell membrane flippase, and translocates fluorescent PS in reconstitution experiments. Yeasts lacking a homologous protein, Drs2, are defective in aminophospholipid transport. But, an accessory CDC50 family protein needed for proper expression of P4-type ATPases is not found in red cells. More definitive proof—such as a gene knockout—is needed to be sure ATP8A1 is the authentic red cell flippase in mature red cells.
Floppase.
The Mg 2+ -ATP–requiring phospholipid translocase, or “floppase,” is responsible for movement of phospholipids from the inner to outer leaflet of the bilayer and is less specific than the flippase. The outward lipid movement by the floppase is also much slower than the inward movement of PS by the flippase. Available evidence suggests the floppase is one of the family of ABC transporters, of which the multidrug resistance transporter (ABCB1 or MDR1 or P-glycoprotein) is the best known. The best candidate is ABCC1 (MRP1). Long-term (48-hour) inhibition of the activity in red cells leads to loss of PC and SM from the outer bilayer but no change in the distribution of PE or PS. Additionally, red cells from mice lacking the gene equivalent to ABCC1 can no longer translocate short-chain fluorescent phospholipid analogues of PC, SM, and PS from the inner to the outer bilayer. However, it is not yet certain that ABCC1 can transport full-length, native phospholipids, which is a required property of the physiologic floppase.
Scramblase.
The Mg 2+ -ATP–independent, Ca 2+ -dependent phospholipid “scramblase” causes a rapid, bidirectional movement of all phospholipids in the bilayer, resulting in the collapse of phospholipid asymmetry, which may occur in less than a minute under some circumstances. The exposure of PS on the cell surface causes red cells to adhere to each other and to endothelial cells and phagocytes and triggers clotting (see later).
After several frustrated attempts, it appears the scramblase has been cloned, or at least part of the scramblase. A protein called anoctamin 6 or TMEM16F (transmembrane protein 16F) is mutated and absent from patients with Scott syndrome, a very rare, autosomal recessive disorder characterized by decreased scramblase activity (see Chapter 30 ). As a consequence, activated platelets fail to expose sufficient PS on their surface to assemble prothrombinase and affected individuals have a bleeding tendency. Erythrocytes and other cells also lack scramblase, but without apparent consequence. However, although anoctamin 6 is responsible for Scott syndrome, it does not account for all scramblase activity. Knockout of anoctamin 6 in the mouse impairs but does not abolish scramblase activity, and other experiments show that there are at least two pathways of scramblase induction. In platelets, anoctamin 6 is not required for, but enhances, the scramblase pathway induced during apoptosis but is required by the pathway induced by thrombin and the rattlesnake venom convulxin. The latter pathway is the one that is defective in Scott syndrome. This may be explained by the fact that at least 5 of the 10 members of the anoctamin/TMEM16 family have lipid scramblase activity. More needs to be learned about which members are expressed in different cells and how they are triggered.
Loss of Phospholipid Asymmetry
When Ca 2+ concentrations rise due to injury, disease, or cell death, red cells lose phospholipid asymmetry owing to activation of the scramblase and inhibition of the flippase. Because normal red cells maintain intracellular Ca 2+ concentrations of less than a micromolar, their membranes preserve an asymmetric phospholipid distribution through their entire life span.
Phospholipid Asymmetry is Lost in Sickle and Thalassemic Red Cells.
Phospholipid flip-flop is increased and phospholipid asymmetry is lost in sickle cells, presumably owing to decreased phospholipid translocase activity and uncoupling of the lipid bilayer from the underlying skeleton in the sickle cell spicules. Consequently, subpopulation of circulating sickle red cells expose PS on their surface. There is large variability in the numbers of such cells among sickle cell patients (0.5% to >10%). A subpopulation of thalassemic red cells also expose PS on their surface, and phospholipid asymmetry is altered in diabetic red cells which, like sickle cells, tend to adhere to endothelial cells.
Externalized PS Triggers Clotting and Phagocytosis.
Cells sequester aminophospholipids on the cytoplasmic side of the plasma membrane because the exposed lipids, particularly PS, trigger the conversion of prothrombin to thrombin and promote intravascular clotting. Loss of phospholipid asymmetry also activates the alternate complement pathway.
In addition, PS is an “eat me” signal. Macrophages bind and ingest cells, or even liposomes, that have PS exposed on their outer surfaces. Exposure of PS is one of the earliest events in apoptosis, and the PS receptor seems to have evolved to scavenge dead or dying cells that have activated scramblase during apoptosis. Expelled erythroblast nuclei also display PS on their surface and are removed by this mechanism.
A protein called PSR was initially believed to be the PS receptor, however that proved incorrect. Three different PS receptors have been identified that appear to be real: Tim4, Bal1, and stabilin-2. Bal1 functions as the receptor for the ELMO/Dock/Rac pathway that directs the actin cytoskeleton to engulf apoptotic corpses. Stabilin-2 interacts with the intracellular adaptor GULP to activate Rac1 and coordinates with Bal1. Tim4 does not appear to signal but serves primarily as a tethering receptor. The interplay between these receptors and other parts of the phagocytic system is fascinating but complex, and its discussion is beyond the scope of this chapter.
Cis Asymmetry
Protein-Bound Lipids.
There is evidence that some transmembrane proteins interact with neighboring “boundary” lipids in a dynamic fashion whereas others bind lipids so tightly that they resist detergent extraction. Presumably the latter proteins bear high-affinity lipid-binding sites. In either case, but particularly when lipids are tightly bound, they must slow the next layer of lipids that they interact with and so on, so that integral proteins exert a kind of “crowd control” on the lipids in the vicinity.
The structure, and in some cases the function, of integral membrane proteins is dependent on the surrounding phospholipids. Membrane proteins can be parochial in their choice of lipid partners. For example, specific lipids are required for the enzymatic functions of the sodium and calcium pumps whereas glycophorin A (to be discussed), binds anionic (PS, PI) but not choline (PC, SM) phospholipids, and those lipids are relatively tightly bound. Positively charged amino acids are concentrated on the cytoplasmic side of the bilayer-spanning domains of membrane proteins, in part because their position determines the orientation of the protein. Although it is not well documented, anionic phospholipids probably cluster near these regions of positive charge. Surface-bound membrane proteins such as spectrin and protein 4.1R, which bind preferentially to anionic phospholipids, may also contribute to the nonrandom topography of inner membrane phospholipids. And, conversely, the lipids appear to contribute to the stability of the membrane skeleton.
Membrane Lipid Rafts.
Lipid rafts are domains within the lipid bilayer that were initially defined by being insoluble in cold, nonionic detergents but have since been defined by multiple other techniques. They are present in all cells and have been implicated in a variety of sorting and signaling processes. They are rich in cholesterol, sphingomyelin, and glycosylphosphatidylinositol (GPI)-anchored proteins; have more ordered acyl side chains; and are thicker than nonraft bilayer domains. Cholesterol prefers the straighter and stiffer acyl chains of sphingomyelin to more disordered phospholipid side chains and is enriched in the rafts. The extra length of glycosphingolipid side chains increases the thickness of the rafts and promotes further segregation. Various measurements indicate that lipid rafts are dynamic, nanoscale (10 to 20 nm) structures that assemble reversibly into larger structures, often for functional reasons. Red cells lipid rafts are 100 to 300 nm and have an irregular shape.
Red cell lipid rafts contain a complex mixture of membrane proteins, including stomatin, flotillin-1 and flotillin-2, the Duffy protein receptor (DARC), heterotrimeric Gα s GPI-anchored proteins such as CD55, CD58, and CD59, and at least some band 3 molecules. Proteins with myristate or palmitate side chains also tend to partition into the rafts, whereas proteins with prenyl side chains are excluded.
Because the glycolipid anchor of GPI-linked proteins is only embedded in the outer leaflet of the bilayer, GPI-linked proteins are much more laterally mobile than transmembrane proteins that interact with the membrane skeleton (discussed later). This high mobility may be important in recruiting complement regulatory proteins to sites of complement activation. Defective biosynthesis of the GPI anchor precludes attachment of GPI-linked proteins to the membrane, causing increased susceptibility to hemolysis by complement, as clinically manifest by paroxysmal nocturnal hemoglobinuria (see Chapter 14 ).
Depletion of cholesterol from the red cell membrane blocks raft formation and the ability of raft-associated proteins to form membrane microdomains. It appears there are different kinds of lipid rafts in the membrane, with different protein components and different fates, but this is not well defined. Although the function of the rafts in normal red cell physiology remains to be determined, they seem to be critical for the invasion of red cells by malarial parasites.
Bilayer Couple Effect
The shape of the lipid bilayer is responsive to very slight variations (<0.4%) in the surface area of its inner and outer halves. This is termed the bilayer couple effect. It reflects the tight packing of membrane lipids, the independent motion of lipids in each half of the bilayer, and the extreme thinness of the membrane (<0.1% of the diameter of the cell). Processes that expand the outer bilayer (or contract the inner) will produce uniform membrane spiculation, called echinocytosis ( Fig. 15-3 ). Conversely, relative expansion of the inner bilayer will lead to membrane invagination and cup-shaped red cells (i.e., stomatocytosis ). Strongly charged amphipathic compounds, such as phospholipids, cause echinocytosis. They are trapped in the outer bilayer by their fixed charge. Permeable amphipaths (e.g., weak acids and bases that can cross the membrane in their uncharged form) will cause the membrane to extend toward the side of greater accumulation. In general, cationic compounds will accumulate in the negatively charged inner bilayer and anionic compounds will partition to the neutral outer bilayer. Even subtle effects, such as differences in the cross-sectional area of lipid head groups or fatty acyl tails, can lead to changes in membrane curvature.
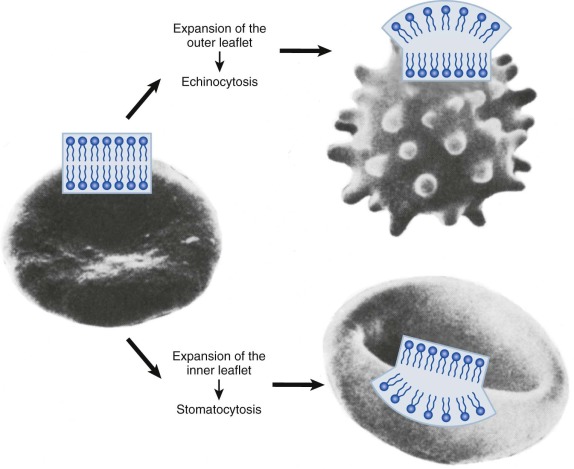
The bilayer couple effect predicts that shape changes resulting from expansion of one lipid leaflet can be reversed by a commensurate alteration in the other. For example, the intensely spiculated red cells of patients with abetalipoproteinemia can be almost completely converted to biconcave disks by the addition of small amounts (0.1 mM) of chlorpromazine, a cationic amphipath. Unfortunately, this simple test has not been applied to other pathologic red cells, so it is difficult to estimate how often bilayer couple effects dictate cell shape in vivo. But shape is not totally explained by the bilayer couple hypothesis, because protein scaffolds, insertion of proteins into the lipid bilayer, the intrinsic shape of proteins that attach to the bilayer, and crowding of proteins on the membrane surface can all cause membranes to curve. The contribution of these factors to red cell shape is not well studied, but it seems likely that the spectrin-actin protein scaffold and the many integral membrane proteins must be important.
Membrane Phosphoinositides
The polar head group of this interesting class of phospholipids contains phosphatidylinositol (PI), or its phosphorylated forms, PI 4-monophosphate and PI 4,5-bisphosphate (PIP and PIP 2 ), respectively. In mature erythrocytes, phosphoinositides represent 2% to 5% of the total phospholipids. They reside at the inner membrane surface and undergo rapid phosphorylation and dephosphorylation. In nucleated cells, phosphoinositides are precursors of important intracellular second messengers such as inositol-1,4,5-triphosphate and diacylglycerol. In red cells they help regulate Ca 2+ transport, interact with membrane proteins such as glycophorin C, spectrin, and protein 4.1R (see later), and may influence discocyte-echinocyte shape transformation.
Lipid Mobility
Acyl Side Chains
Purified Lipids Exist in Gel or Liquid Crystalline States.
Purified phospholipids exhibit discrete, liquid crystalline to gel phase transitions that are dependent on the length and degree of unsaturation of their acyl side chains. The presence of a double bond in the acyl chain increases the disorder and flexibility all along the hydrocarbon chain, especially toward the terminal methyl end. Below the temperature of the liquid crystalline to gel transition, acyl chains of purified lipids are extended in stiff, parallel, hexagonally packed arrays that are more nearly solid than liquid.
Cholesterol Creates an Intermediate State between Gel and Liquid Lipids.
Cholesterol buffers the extremes of the gel and liquid crystalline states. At temperatures above the gel-liquid phase transition, cholesterol partially immobilizes the acyl chains of phospholipids, particularly the proximal eight to ten carbons that are adjacent to the bulky steroid nucleus. Below this transition, cholesterol disrupts the ordering of the acyl chains, in effect preserving membrane fluidity. The net result is that cholesterol tends to abolish the gel to liquid crystalline transition and create a condition of intermediate fluidity in which the proximal ends of the hydrocarbon chains are extended and relatively rigid and the distal ends are disordered and fluid.
The red cell membrane contains relatively large amounts of cholesterol (cholesterol/phospholipid = 0.8 mol/mol) and is relatively less fluid than other plasma membranes. The inner bilayer is somewhat more fluid than the outer, probably because it contains more unsaturated fatty acids.
Lateral Diffusion
Phospholipids move about rapidly within each plane of model lipid bilayers. From the measured lateral diffusion constants (2 to 5 × 10 −8 cm 2 /s), one can calculate that phospholipids exchange places with their neighbors about 10 7 times per second. This rate is somewhat damped in the red cell membrane (estimated diffusion constant of 1.4 × 10 −8 cm 2 /s), but the difference is about what would be expected, considering the effects of cholesterol on the lateral mobility of phospholipids.
Lipid Renewal Pathways
Mature Erythrocytes Cannot Synthesize Lipids.
Mature erythrocytes are unable to synthesize fatty acids, phospholipids, or cholesterol de novo and depend on lipid exchange and fatty acid acylation as mechanisms for phospholipid repair and renewal ( Fig. 15-4 ). Damaged chains are removed by phospholipase A 2 , producing a lysophospholipid. Plasma-derived fatty acids are esterified to acyl-CoA by acyl-CoA synthetases, especially ACSL6, and transferred to the lysophospholipids by acyl-CoA: lysophospholipid acyltransferases. In theory this enzyme should facilitate the renewal of lost or damaged fatty acid side chains and should prevent the accumulation of deleterious lysophosphatides within the membrane; however, it is not certain that the phospholipases necessary to remove damaged fatty acids operate in the red cell.
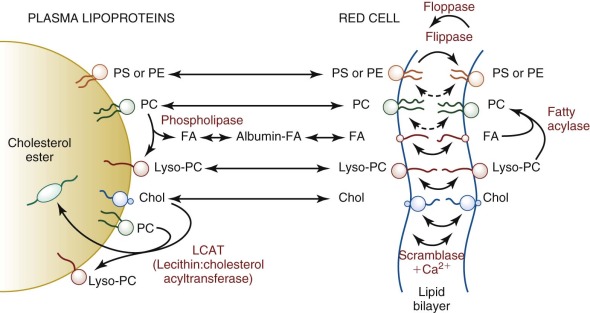
This renewal pathway, although limited, permits a slow replacement of membrane lipid components. Approximately 30 days are required before erythrocyte lipids reach equilibrium after a change in dietary fatty acids. Theoretically this could be pathologically significant in persons on unusual diets (e.g., infants receiving a high intake of medium-chain triglycerides); however, to date, no pathologic consequences have been reported.
Esterification Depletes Red Cell Cholesterol.
Red cell membrane cholesterol (unesterified) exchanges readily with the unesterified cholesterol in plasma lipoproteins (t 1/2 = 7 hr), where it is partially converted to esterified cholesterol by the action of lecithin:cholesterol acyltransferase (LCAT). Because the newly formed cholesteryl ester cannot return to the red cell membrane, LCAT catalyzes a unidirectional pathway (see Fig. 15-4 ) that depletes the membrane of cholesterol and decreases its surface area. Conversely, if LCAT is absent or inhibited, excess membrane cholesterol accumulates, expanding the membrane surface area and resulting in target cells.
Membrane Proteins
Composition
The red cell membrane (or “ghost”) contains nearly 20 major proteins and more than 300 minor ones ( Table 15-2 ). Even defining what is a red cell membrane protein is difficult because plasma and cytoplasmic proteins bind to membrane constituents to varying degrees under different conditions. The major proteins of the red cell membrane ( Fig. 15-5 ; see Table 15-2 ) and their disorders have been intensively studied, and, in most cases, their genes have been cloned.
| Protein | Blood Group Name(s) | Human Gene Name | Mr on SDS Gel (kD) | Actual Mr (kD) * | No. of Amino Acids * | Monomer Molecules/Cell † × 10 3 | Oligomeric State | Peripheral or Integral ‡ | Chromosome Location | OMIM No. § | NCBI Reference Protein Sequence Accession No. ‖ | Associated Red Cell Conditions |
|---|---|---|---|---|---|---|---|---|---|---|---|---|
| ABCB6 | Lan | ABCB6 | 80 | 93.9 | 842 | I | 2q35 | 605452 | NP_005680.1 | FP | ||
| Acetylcholinesterase | Yt | ACHE | 70 | 64.6 | 583 | 3-10 | I (G) | 7q22.1 | 100740 | NP_000656.1 | ||
| β Actin | ACTB | 43 | 41.6 | 374 | 500 | Oligomer (~14) | P | 7p22.1 | 102630 | NP_001092.1 | ||
| α Adducin | ADD1 | 103 | 81.0 | 737 | 30 | Heterodimer/tetramer | P | 4p16.3 | 102680 | NP_001110.2 | HS (mouse) | |
| β Adducin | ADD2 | 97 | 80.7 | 725 | 30 | P | 2p13.3 | 102681 | NP_001171983.1 | HS (mouse) | ||
| ADP-ribosyltransferase (CD297) | Dombrock | ART4 | 47-58 | 27.8 | 239 | I (G) | 12p12.3 | 110600 | NP_066549.2 | |||
| Aldolase A | ALDOA | 39.4 | 364 | 20 | Tetramer | P | 16p11.2 | 103850 | NP_001121089.1 | |||
| Ankyrin ¶ | ANK1 | 210 | 206.0 | 1880 | 124 ± 11 ¶ | Monomer | P | 8p11.21 | 612641 | NP_065209.2 | HS | |
| Aquaporin 1 | Colton | AQP1 | 28 | 28.4 | 268 | 120-160 | Tetramer | I | 7p14.3 | 107776 | NP_932766.1 | |
| Aquaporin 3 | GIL | AQP3 | 25, 45 | 31.5 | 292 | ?Tetramer, ?Dimer | I | 9p13 | 600170 | NP_004916.1 | ||
| Band 3 (AE1, CD233) | Diego, Wright, Ii, numerous minor antigens | SLC4A1 | 90-100 | 101.8 | 911 | 1200 | Dimer or tetramer | I | 17q21.31 | 109270 | NP_000333.1 | HS, SAO, HAc, OHSt. HC |
| Basigin (EMMPRIN, CD147) | OK | BSG | 45-75 | 27.2 | 248 | I | 19p13.3 | 109480 | NP_940991.1 | Malaria resistance | ||
| Ca 2+ -ATPase 1 | ATP2B1 | 134.7 | 1220 | 2-3 | I | 12q21.3 | 108731 | NP_001673.2 | ||||
| Ca 2+ -ATPase 4 | ATP2B4 | 133.9 | 1205 | I | 1q32.1 | 108732 | NP_001675.3 | |||||
| Carbonic anhydrase II | CA2 | 29 | 29.1 | 259 | 100 | P | 8q21.2 | 611492 | NP_000058.1 | |||
| Carbonic anhydrase IV | CA4 | 35 | 33.1 | 293 | I (G) | 17q23.1 | 114760 | NP_000708.1 | ||||
| CD44 | Indian | CD44 | 80 | 37.1 | 311 | 6-10 | I | 11p13 | 107269 | NP_001001391.1 | ||
| CD47 (IAP) | CD47 | 50 | 33.3 | 304 | 17 | Monomer | I | 3q13.12 | 601028 | NP_001768.1 | ||
| CD55 (DAF) | Cromer | CD55 | 70 | 37.8 | 347 | 10-20 | I (G) | 1q32.2 | 125240 | NP_000565.1 | ||
| CD58 (LFA3) | CD58 | 55-70 | 28.1 | 250 | 3-8 | I | 1p13.1 | 153420 | NP_001770.1 | |||
| CD59 (Protectin, MIRL) | CD59 | 18-20 | 9.0 | 77 | 20-40 | I (G) | 11p13 | 107271 | NP_000602.1 | PNH | ||
| CD99 | Xg | CD99 | 25, 30 | 16.7 | 163 | 1 | I | Xp22.33 | 313470 | NP_002405.1 | ||
| CR1 (CD35) | Knops | CR1 | 190, 220 | 219.7 | 1998 | 0.02-1.5 | I | 1q32.2 | 120620 | NP_000564.2 | Malaria resistance | |
| Dematin (band 4.9) | EPB49 | 48 & 52 | 43.1 & 45.5 | 383, 405 | 130 | Monomer | P | 8p21.3 | 125305 | NP_001107610.1 | Mild HS (mouse) | |
| Duffy (DARC, CD234) | Duffy (Fy) | DARC | 35-45 | 35.6 | 336 | 6-13 | I | 1q23.2 | 613665 | NP_001116423.1 | Malaria resistance | |
| ERMAP | Scianna/Radin | ERMAP | 60-68 | 49.6 | 446 | I | 1p34.2 | 609017 | NP_001017922.1 | |||
| Flotillin 1 | FLOT1 | 47 | 47.4 | 427 | P | 6p21.33 | 606998 | NP_005794.1 | ||||
| Flotillin 2 | FLOT2 | 42 | 47.1 | 428 | P | 17q11.2 | 131560 | NP_004466.2 | ||||
| G3PD | GAPDH | 35 | 35.9 | 334 | 500 | Tetramer | P | 12p13.31 | 138400 | NP_002037.2 | ||
| Gárdos channel (SK4) | KCNN4 | 45 | 47.7 | 427 | 0.12 | I | 19q13.31 | 602754 | NP_002241.1 | |||
| Glucose transporter 1 (Glut1) | SLC2A1 | 45-65 | 54.1 | 492 | 200-700 | Dimer & tetramer | I | 1p34.2 | 138140 | NP_006507.2 | HC | |
| Glucose transporter 4 (Glut4) | SLC2A4 | 54.8 | 509 | I | 17p13.1 | 138190 | NP_001033.1 | |||||
| Glycophorin A (CD235a) | MNSsU | GYPA | 36 | 14.3 | 131 | 1000 | Dimer | I | 4q31.21 | 111300 | NP_002090.4 | Malaria resistance |
| Glycophorin B (CD235b) | MNSsU | GYPB | 20 | 7.7 | 72 | 170-250 | Dimer? | I | 4q31.21 | 111740 | NP_002091.3 | |
| Glycophorin C (CD236) | Gerbich | GYPC | 32 | 13.8 | 128 | 143 | Dimer? | I | 2q14.3 | 110750 | NP_002092.1 | HE, Malaria resistance |
| Glycophorin D (CD236) | Gerbich | GYPD | 23 | 11.5 | 107 | 82 | Dimer? | I | 2q14.3 | 110750 | NP_001243513.1 | HE |
| Glycophorin E ** | GYPE | 6.5 | 59 | I | 4q31.21 | 138590 | NP_941391.2 | |||||
| K + -Cl − -cotransporter 1 (KCC1) | SLC12A4 | 120.7 | 1085 | I | 16q22.1 | 604119 | NP_005063.1 | |||||
| K + -Cl − -cotransporter 3 (KCC3) | SLC12A6 | 127.6 | 1150 | I | 15q14 | 604878 | NP_598408.1 | |||||
| K + -Cl − -cotransporter 4 (KCC4) | SLC12A7 | 119.1 | 1083 | I | 5p15.33 | 604879 | NP_006589.2 | |||||
| Kell (CD238) | Kell | KEL | 93 | 82.8 | 732 | 3-18 | Heterodimer with KX | I | 7q34 | 613883 | NP_000411.1 | |
| Kx | Xk | XK | 37 | 50.9 | 444 | Hetrodimer with Kell | I | Xp21.1 | 314850 | NP_066569.1 | McLeod syndrome | |
| Lutheran (BCAM, CD239) | Lutheran, Auberger | BCAM | 85 & 78 | 64.3 | 597 | 1.5-8 | I | 19q13.32 | 612773 | NP_005572.2 | ||
| LW glycoprotein (CD242) | Landsteiner-Wiener | ICAM4 | 37-43 | 27.0 | 249 | 3-5 | I | 19p13.2 | 614088 | NP_001535.1 | ||
| Monocarboxylate transporter 1 (MCT1) | SLC16A1 | 54 | 53.9 | 500 | I | 1p13.2 | 600682 | NP_003042.3 | ||||
| Na + -H + exchanger 1 (NHE1) | SLC9A1 | 90.8 | 815 | I | 1p36.1-p35 | 107310 | NP_003038.2 | |||||
| Na + -H + exchanger 8 (NHE8) | SLC9A8 | 65.4 | 581 | I | 20q13.13 | 612730 | NP_056081.1 | |||||
| Na + -H + exchanger 9 (NHE9) | SLC9A9 | 72.6 | 645 | I | 3q24 | 608396 | NP_775924.1 | |||||
| Na + ,K + -ATPase, α chain | ATP1A1 | 112 | 112.4 | 1018 | 0.23-0.47 | Heterotrimer | I | 1p13.1 | 182310 | NP_001153705.1 | ||
| Na + ,K + -ATPase, β chain | ATP1B1 | 35 | 35.1 | 303 | I | 1q24.2 | 182330 | NP_001668.1 | ||||
| Na + ,K + -ATPase, γ chain | FXYD2 | 7 | 7.3 | 66 | I | 11q23.2 | 601814 | NP_001671.2 | ||||
| Na + -K + -Cl − cotransporter 2 (NKCC1) | SLC12A2 | 131.4 | 1212 | I | 5q23.3 | 600840 | NP_001037.1 | |||||
| Nucleoside transporter | SLC29A1 | 55 | 50.1 | 455 | 10 | I | 6p21.1 | 602193 | NP_001071645.1 | |||
| p55 | MPP1 | 55 | 52.3 | 466 | 80 | Dimer? | I (P) | Xq28 | 305360 | NP_002427.1 | ||
| Peroxiredoxin 1 | PRDX1 | 23 | 22.0 | 198 | Dimer | P | 1p34.1 | 176763 | NP_002565.1 | OH (mouse) | ||
| Peroxiredoxin 2 | PRDX2 | 23 | 21.8 | 197 | 200 | Dimer or decamer | P | 19p13.2 | 600538 | NP_005800.3 | OH (mouse) | |
| Phosphofructokinase—liver | PFKL | 85.0 | 780 | 6 | Heterotetramer | P | 21q22.3 | 171860 | NP_002617.3 | |||
| Phosphofructokinase—muscle | PFKM | 85.2 | 780 | P | 12q13.11 | 610681 | NP_001160160.1 | |||||
| Piezo 1 | FAM38A | 275 | 286.8 | 2521 | ?Tetramer | I | 16q24.3 | 611184 | NP_001136336.2 | HX, FP | ||
| Protein 4.1R | EPB41 | 80 & 78 | 66.4 | 588 | ~240 | Monomer | P | 1p35.3 | 130500 | NP_004428.1 | HE | |
| Protein 4.2 | EPB42 | 72 | 79.8/76.9 †† | 721/691 ‡ | ~280 | Unknown | P | 15q15.2 | 177070 | NP_000110.2 | HS | |
| RhAG (CD241) | RHAG | 45 & 50 | 44.2 | 409 | 100-200 | I | 6p12.3 | 180297 | NP_000315.2 | Rh null | ||
| RhCE polypeptide (CD240CE) | CcEe | RHCE | 30-32 | 45.4 | 416 | 100-200 | Heterotrimer with RhAG, RhD, & RhCE? | I | 1p36.11 | 111700 | NP_065231.3 | Rh null |
| RhD polypeptide (CD240D) | D | RHD | 30-32 | 45.1 | 416 | 100-200 | I | 1p36.11 | 111680 | NP_057208.2 | ||
| SMIM1 | Vel | SMIM1 | 18 | 8.7 | 78 | Dimer (S-S linked) | I | 1p36 | 615242 | NP_001157196.1 | ||
| α Spectrin | SPTA1 | 240 | 280.0 | 2419 | 242 | Heterodimer/tetramer/oligomer | P | 1q23.1 | 182860 | NP_003117.2 | HE, HS | |
| β Spectrin | SPTB | 220 | 246.4 | 2137 | 242 | P | 14q23.3 | 182870 | NP_000338.3 | HS, HE | ||
| Stomatin (band 7.2) | STOM | 29 | 31.7 | 288 | 200-400? | Oligomer (9-12) | I | 9q33.2 | 133090 | NP_004090.4 | ||
| Tropomodulin 1 | TMOD1 | 43 | 40.6 | 359 | 60 | Monomer | P | 9q22.33 | 190930 | NP_003266.1 | Mild HE (mouse) | |
| Tropomyosin 1 (hTm5b) ‡‡ | TPM1 | 27+29 | 32.9 | 284 | 140 ‡‡ | Homodimer | P | 15q22.2 | 191010 | NP_001018020.1 ‡‡ | ||
| Tropomyosin 3 (hTm5) ‡‡ | TPM3 | 32.9 | 285 | P | 1q21.3 | 191030 | NP_689476.2 | |||||
| Urea transporter | Kidd (Jk) | SLC14A1 | 36 | 42.5 | 389 | 10-14 | I | 18q12.3 | 613868 | NP_056949.4 | ||
| XG glycoprotein | Xg | XG | 22-29 | 17.3 | 159 | 0.1-9 | I | Xp22.33 | 314700 | NP_780778.1 |
* Size of the mature protein chain without any signal peptide, propeptides, or cleaved initiator methionine, but not including glycosylation, phosphorylation, fatty acid acylation, and other posttranslational modifications.
† Copies of proteins 4.1 and 4.2 and G3PD were based on an estimate of 5.7 × 10 −13 g protein/ghost 8 and on the approximate proportion of each protein, estimated from densitometry of SDS gels. Numbers of spectrins and ankyrins were measured directly by radioimmunoassay. The copy number of other proteins were taken or calculated from data in the following references: AChE, β actin, α and β adducin, aquaporin band 3, carbonic anhydrase 2, Ca 2+ -ATPase, CD44, CD47, CD55, CD58, CD59, CD99, CR1, dematin, Duffy, Gárdos channel, glucose transporter 1 (Glut1), glycophorins A and B, glycophorins C and D, Kell, Lu, LW, Na + ,K + -ATPase, nucleoside transporter, p55, RhAG, Rh polypeptide, tropomodulin, tropomyosin, urea transporter, and Xg glycoprotein.
‡ Glycosylphosphatidylinositol (G)-linked proteins and heavily palmitoylated (P) proteins such as p55 are classified as integral proteins.
§ OMIM: http://www-ncbi-nlm-nih-gov.easyaccess2.lib.cuhk.edu.hk/omim .
‖ NCBI Protein database: http://www-ncbi-nlm-nih-gov.easyaccess2.lib.cuhk.edu.hk/protein .
¶ Data shown are for full-length ankyrin (band 2.1), the major isoform, except for the number of copies/cell, which includes the smaller isoforms: band 2.2 = 195 kD, band 2.3 = 175 kD, and band 2.6 = 145 kD.
** Glycophorin E mRNA has been identified, but it is not certain that the mRNA is translated.
†† The full-length form of protein 4.2 is 721 amino acids (isoform 1, 79,797 daltons). Features of the protein, such as the band 3–binding site or the palmitoylation site, are numbered using this sequence. However, the common isoform is only 691 amino acids long (isoform 2, 76,878 daltons, NP_001107606.1). It lacks amino acids G4 to D33.
‡‡ The number of tropomyosins includes the contribution of both the TPM1 and TPM3 genes. Tropomyosin has many isoforms. Red cell tropomyosin is composed of the hTm5b isoform of TPM1 (also called TM5b) and the hTM5 isoform of TPM3 (also called Tm5NM1). The larger band on SDS gels of red cell membranes is the hTM5 isoform. The author was unable to link the sequence of the hTM5b isoform to any of the reference sequences in the NCBI Protein Database. The sequence listed is the generic 284-amino acid sequence.
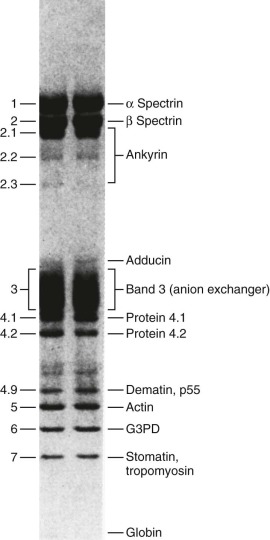
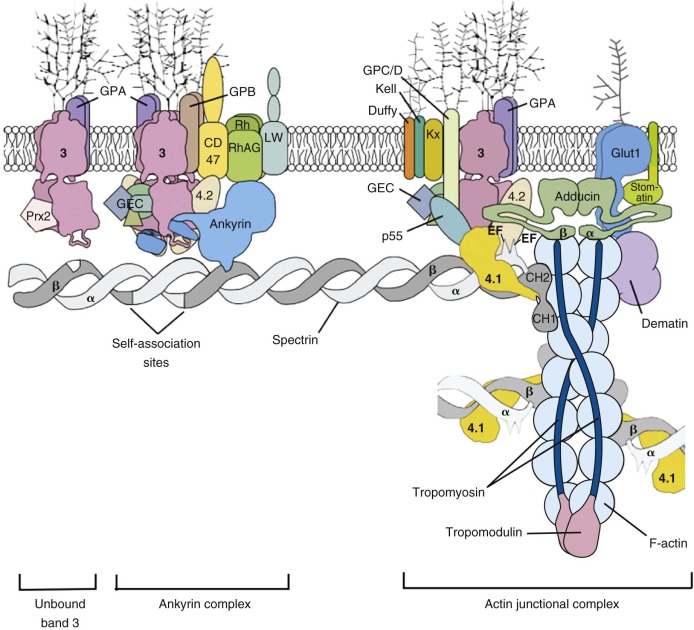
The protein constituents of the red cell membrane are usually defined by hypotonic hemolysis of red cells followed by polyacrylamide gel electrophoresis (PAGE) in sodium dodecyl sulfate (SDS). In general, membrane proteins are classified as either integral or peripheral. Integral membrane proteins penetrate or traverse the lipid bilayer and interact with the hydrophobic lipid core. They include band 3, the anion exchange channel, and the glycophorins, which generate a negative charge at the cell surface, and other proteins that function as channels or receptors and display surface antigens ( Fig. 15-6 ). Integral membrane proteins form the randomly distributed 8- to 10-nm intramembranous particles seen on freeze-cleave electron microscopy of red cell membranes. Peripheral proteins interact with integral proteins or lipids at the membrane surface but do not penetrate into the lipid bilayer core. In the red cell, the major peripheral membrane proteins are located on the cytoplasmic membrane face and include enzymes such as glyceraldehyde-3-phosphate dehydrogenase (G3PD) and the structural proteins of the membrane skeleton. The red cell membrane skeleton is operationally defined as the insoluble proteinaceous residue that remains after extraction of red cells or their ghosts with the nonionic detergent Triton X-100. The membrane skeleton contains roughly half of the membrane protein mass and includes such proteins as spectrin, actin, protein 4.1R, p55, adducin, dematin, tropomyosin, tropomodulin, ankyrin, and part of band 3 and protein 4.2 (see Fig. 15-6 ).
Integral Membrane Proteins
Band 3 (SLC4A1, AE1)
Band 3 is the major integral membrane protein of the red blood cell, comprising 25% to 30% of cell membrane protein (~1.2 million copies per cell). It is also called anion exchange protein 1 (AE1), but its official appellation is solute carrier family 4 (anion exchanger), member 1 or SLC4A1. It is expressed early in erythropoiesis and peaks at the orthochromic erythroblast stage. It encodes a 911-amino acid polypeptide of 102 kD. Band 3 migrates as a diffuse band on SDS gels (see Fig. 15-5 ) owing to heterogeneous N -glycosylation. It is divided into a cytoplasmic domain that is a key attachment site for the membrane skeleton, glycolytic enzymes, and hemoglobin and a membrane domain anion exchange channel that aids carbon dioxide (CO 2 ) transport.
Cytoplasmic Protein Binding Domain
The 43-kD amino-terminal (N-terminal) domain of band 3 (amino acids 1 to 359) resides in the cytoplasm and is released when red cell membranes are treated with chymotrypsin or trypsin. The first 45 amino acids are highly acidic and stretch into the cytoplasm ( Fig. 15-7 ). The remainder of the domain is folded but flexible, expanding at high pH and contracting at low pH.
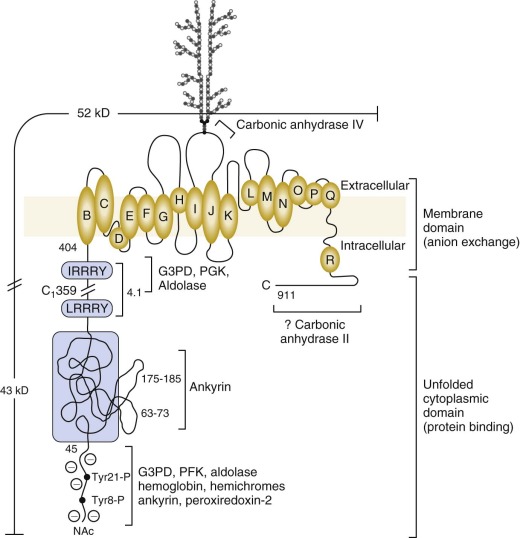
The N-Terminal Sequence Binds Glycolytic Enzymes, Peroxiredoxin-2, and Deoxyhemoglobin and is an Oxygen-Regulated Membrane Metabolon.
The first 23 amino acids of band 3 contain two tandem repeats terminating in the sequences DDY 8 ED and EEY 21 ED. G3PD, phosphofructokinase (PFK), aldolase and deoxyhemoglobin all bind in this region. So does peroxiredoxin-2. Aldolase requires both sites to bind, G3PD binds separately to each, and PFK and deoxyhemoglobin bind to the more distal site. In confirmation, the red cells from a child with a mutant band 3 that lacks the first 11 amino acids (Bd3 Neapolis) contain no membrane bound aldolase.
The glycolytic enzyme complex also binds to a site near the junction of the cytoplasmic and membrane domains of band 3 (amino acids 356 to 384), which lies close to the N-terminus in the folded protein. Enzymes in the glycolytic complex can be crosslinked to proteins in both the ankyrin complex and the actin junctional complex, which suggests the glycolytic enzymes attach to band 3 dimers in both complexes (see Fig. 15-6 ).
There are more than enough band 3 molecules to bind all the peroxiredoxin-2 (~200,000 copies), G3PD (~500,000 copies), aldolase (~20,000 copies), and PFK (~6,000 copies). About 65% of G3PD, 40% of aldolase, and 50% of PFK are membrane bound in the intact red cell. PGK may also attach to band 3, but the numbers of bound molecules are small (~230 copies).
Deoxyhemoglobin binding is well documented. Its affinity is weak (kD (deoxy Hb) = 0.3 mM), but because the concentration of hemoglobin is so high in red cells, roughly half of the band 3 molecules are bound to deoxyhemoglobin under physiologic conditions. Hemichromes, a partially denatured form of hemoglobin, bind more avidly than hemoglobin and cause band 3 to cluster, which is believed to target the cell for phagocytosis (see later section, “ Membrane Changes Associated with Aging and Senescence of Red Cells ”).
G3PD, PFK, and aldolase are inhibited when attached to the membrane. In addition, lactic dehydrogenase (LDH) and pyruvate kinase (PK) also localize to the membrane, even though they do not bind to band 3. All five enzymes are displaced into the cytoplasm by an antibody to the N-terminus of band 3, by deoxyhemoglobin, or by p72 syk phosphorylation of tyrosines 8 and 21, which lie in the middle of the two binding sites. Similarly in mice, even though the acidic N-terminal domain of band 3 is not well conserved, glycolytic enzymes bind to the red cell membrane in a band 3–dependent manner and redistribute to the cytoplasm when hemoglobin is deoxygenated and bound to band 3 or band 3 is deleted.
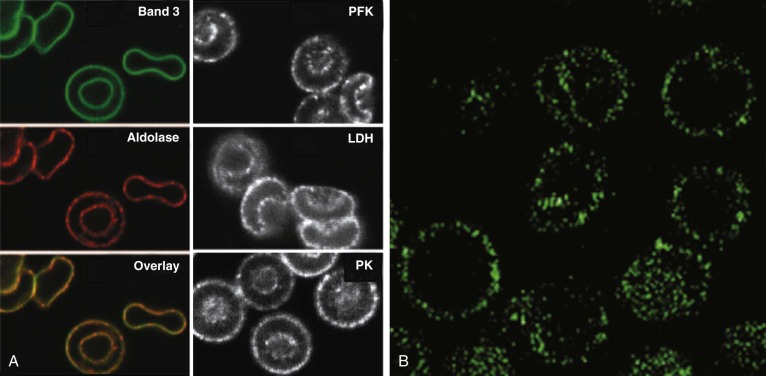
The data suggest that many of the enzymes in the glycolytic pathway form a complex—or more accurately a series of complexes because the wide variation in numbers of enzyme molecules means they cannot form a single stoichiometric complex. The complexes (or “metabolons”) are bound to band 3, and their interaction can be regulated by tyrosine phosphorylation and the state of hemoglobin oxygenation, and perhaps by substrates and cofactors of the enzymes ( Fig. 15-8 ). The enzymes are in discrete clumps along the membrane, which also supports the idea of a metabolon (see Fig. 15-8, A ). In addition, when metabolic fluxes are measured in intact normal red cells, activating glycolysis by displacing the glycolytic enzymes from band 3 increases glycolytic fluxes by 45% and decreases utilization of the pentose phosphate pathway by 66%.
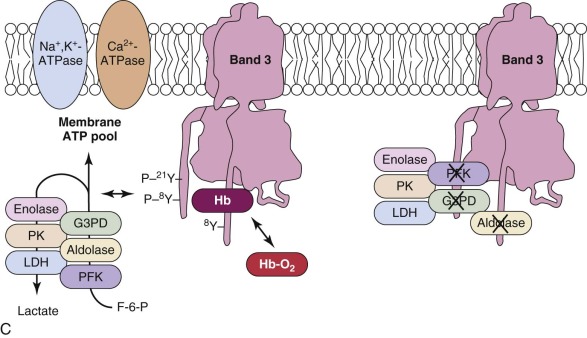
The obvious reason for a complex of glycolytic enzymes would be to increase the efficiency of glycolysis by channeling glycolytic intermediates from one enzyme to the next (see Fig. 15-8, C ). The complex is conveniently located near band 3, which transports the phosphate needed to make ATP. Band 3 also transports phosphoenolpyruvate, pyruvate, and lactate, all substrates or products of the putative complex. The immediate modification of substrates on the inner membrane surface also prevents back-flux through transport channels, increasing the efficiency of transport.
There is strong evidence that human red cell membranes compartmentalize ATP (see Fig. 15-8, B ). The membrane ATP pool is in contact with β spectrin, ankyrin, band 3, and G3PD, and it fuels the Ca 2+ -ATPase and Na + ,K + -ATPase pumps and presumably the phospholipid flippase.
Interestingly, the existence of a membrane bound complex of glycolytic enzymes was postulated more than 45 years ago and was indirectly observed more than 35 years ago, but the interpretation was not generally accepted. The membrane ATP pool is another discredited old idea that has been revived.
The Cytoplasmic Domain Is Where the Membrane Skeleton Attaches.
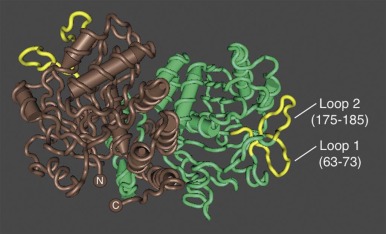
Ankyrin links the major membrane skeletal protein spectrin to the plasma membrane of the red cell by binding to a pair of adjacent beta hairpin loops in the cytoplasmic domain of band 3 formed by amino acids 63-73 and 175-185 ( Fig. 15-9 ; see also Fig. 15-7 ). There is considerable evidence that ankyrin also interacts with the acidic N-terminal domain of band 3. First, blocking the N-terminus with an antibody inhibits ankyrin binding. Second, association of ankyrin with band 3 is blocked by phosphorylation of tyrosines 8 and 21, and, vice-versa, ankyrin binding prevents phosphorylation of these tyrosines. As mentioned earlier, deoxyhemoglobin also binds to the N-terminus. In doing so it displaces ankyrin and weakens the membrane. Stefanovic and colleagues postulate that this could improve blood flow during brief periods of deoxygenation but might promote unwanted membrane vesiculation during prolonged deoxygenation, as in sickle cell disease.
Ankyrin preferentially binds to band 3 “tetramers.” Whether band 3 spontaneously forms tetramers and then attracts ankyrin, stabilizing the tetramers, or whether ankyrin, which has two binding sites for band 3, independently binds two band 3 dimers (i.e., a “dimer of dimers”) is unresolved. The fact that a stable subpopulation of band 3 tetramers can be isolated from nonionic detergent extracts of ghosts argues for the former. The fact that at least one structure of the band 3/ankyrin complex precludes a tetramer argues for the latter. It is estimated that 40% of band 3 is bound to ankyrin as tetramers (120,000 tetramers) whereas 60% exists as dimers (360,000 dimers).
Protein 4.1R, which links the spectrin-actin–based skeleton to the plasma membrane in part via interactions with glycophorin C, binds to the cytoplasmic domain of band 3 at specific (I/L)RRRY sequences near the inner membrane surface (see Fig. 15-7 ). The interaction is important because zebrafish with a severe hemolytic anemia due to lack of band 3 can only be rescued by band 3 that contains IRRRY sites. Rescue is markedly reduced if mouse band 3 containing a mutation in either the LRRRY or IRRRY site is used and is nearly abolished if both sites are mutated. Because protein 4.1R and ankyrin compete for binding to band 3 and ankyrin binds exclusively to band 3 tetramers, it seems likely that protein 4.1R binds preferentially to dimeric band 3 (see Fig. 15-6 ).
Protein 4.2, a 77-kD peripheral membrane protein of the red cell, also interacts with the cytoplasmic domain of band 3. The binding site is not well defined. Red cells from patients with the cytoplasmic band 3 mutations Glu40→Lys, Gly130→Arg, and Pro327→Arg show some deficiency of protein 4.2, and the mutant band 3 molecules bind protein 4.2 poorly in vitro. Pro327 and Gly130 are not too close to each other in the crystal structure of band 3 so either there is more than one binding site or one of the mutations induces more global effects on band 3 structure. It is not clear whether protein 4.2 preferentially binds to the ankyrin-linked band 3 tetramers or to band 3 dimers, but, as discussed later in the section on protein 4.2, it probably binds to both. Because protein 4.2 binds to the carboxy-terminus (C-terminus) of α spectrin, near the spectrin-actin junction, it appears that band 3 may attach the skeleton to the lipid bilayer at both the head end of spectrin, where ankyrin binds, and at the tail end, where actin, proteins 4.1R and 4.2, and adducin bind (see Fig. 15-6 ). Whatever the arrangements, protein 4.2 depends on band 3 to be expressed in the membrane. Membranes from band 3 knockout mice completely lack 4.2, and membranes from 4.2 knockout mice are partially deficient in band 3.
Adducin, is an actin-binding protein that caps actin filaments and enhances the binding of spectrin to actin. It is discussed later in the chapter. Adducin binds to the cytoplasmic domain of band 3 via its extended, flexible tail domain (see Fig. 15-6 ). The tails of both α and β adducin bind band 3, but the free β-adducin tail domain disrupts red cell membrane morphology and stability more than the α-adducin tail, suggesting it is the more important interaction physiologically. Mice lacking all adducins have a mild spherocytic hemolytic anemia but have normal amounts of band 3 and spectrin.
Band 3 Tyrosine Phosphorylation Weakens Ankyrin Binding.
Band 3 is phosphorylated on tyrosine residues 8, 21, 359, and 904 by p72Syk kinase and to a less extent by Lyn kinase. This displaces the glycolytic enzyme complex, as noted earlier, but it also greatly weakens band 3/ankyrin binding, which in turn promotes band 3 diffusion within the lipid bilayer and red cell spiculation and vesiculation. The effect on the interactions of band 3 with its other binding partners is unknown. In the basal state, band 3 tyrosines are unphosphorylated, owing to the action of phosphatases, but they become phosphorylated after malaria invasion and by oxidative damage, such as occurs in hemoglobinopathies and glucose-6-phosphate dehydrogenase (G6PD) deficiency.
Flexible Link between the Cytoplasmic and Membrane Domains.
Kurtz and his colleagues have analyzed hundreds of high-resolution electron micrographs of single band 3 dimers and find that cytoplasmic and membrane domains orient differently in different molecules, strongly suggesting that the connecting region is flexible. The fact that loss of a portion of this linker in Southeast Asian ovalocytosis (see Chapter 16 ) results in very rigid red cell membranes suggests that the link may be important in regulating red cell elasticity.
Kidney Band 3.
Band 3 is also expressed in the basolateral membrane of the type A intercalated cells in the kidney collecting ducts where it collaborates in the excretion of H + and reclamation of HCO 3 − . The kidney isoform lacks the first 65 amino acids and does not bind ankyrin.
Membrane Domain
The 52-kD Membrane Domain (Amino Acids 360 to 911) Contains an Anion Exchange Channel.
The anatomy of the membrane domain of band 3 has been an active area of interest, with the goal of research efforts focused on understanding how the membrane domain’s topology enables the 1.2 million channels in each red cell to exchange 10 to 30 billion HCO 3 − or Cl − anions per second. The 6 nm long × 11 nm wide × 7 nm deep membrane domain contains numerous transmembrane and intramembrane helices, some of which are tilted in a V shape like they are in the bacterial ClC chloride channel. Multiple topology models of the membrane domain have been derived over the years using different techniques to see which amino acids are accessible from the exterior and interior of the cell. The latest and most plausible one is based on homology between band 3 and the ClC channel (see Fig. 15-7 ).
Despite considerable effort, we still do not know which transmembrane segments form the anion channel or exactly how the channel functions. Residues in helices D, F, H, I, N, and R are predicted to contribute to the transport process. The clustering of mutations responsible for various disorders of red cell membrane permeability between helices K and N suggests that region is also involved (see Fig. 16-35 ).
Carbonic anhydrase IV (CAIV), a GPI-linked protein, binds to the outside of the membrane domain, probably just beyond the glycosylation site (Asn642) in the protein loop that connects helices I and J (see Fig. 15-7 ).
Carbonic anhydrase II (CAII) may or may not bind to band 3, on the C-terminal extension at the inside surface of the channel (see Fig. 15-7 ). Assuming it does, there is evidence that it increases HCO 3 − /Cl − exchange and helps create an acidic microdomain around band 3 during HCO 3 − transport. The two carbonic anhydrases potentially form a CO 2 /HCO 3 − transport metabolon with band 3.
The Transport Channel Exchanges Chloride and Bicarbonate Rapidly (~20,000 to 50,000 Times per Second per Channel), Facilitating CO 2 Transport from the Tissues to the Lungs.
In the peripheral tissues, CO 2 is either rapidly converted to HCO 3 − at the surface of band 3 by CAIV and enters the red cell via band 3 or it diffuses across the red cell membrane and is then converted to HCO 3 − by CAII. The H + by-product of the carbonic anhydrase reaction binds to hemoglobin and facilitates O2 release to the tissues (i.e., the Bohr effect). The whole process is reversed in the lungs ( Fig. 15-10 ). As the red cell circulates, intracellular HCO 3 − is exchanged for extracellular chloride. As a result, HCO 3 − is transported in the plasma as well as within the red cell, which increases CO 2 transport from the tissues to the lungs by approximately 60%. The HCO 3 − /Cl − exchange is believed to occur by a “ping-pong” mechanism, whereby an intracellular anion enters the transport channel and is translocated outward and released, with the channel remaining in the outward configuration until an extracellular anion enters and activates the reverse cycle.
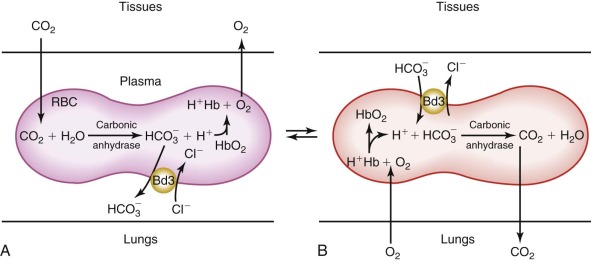
Although HCO 3 − and Cl − are the predominant physiologically relevant anions exchanged by band 3, the specificity of the channel is actually quite broad and larger anions such as sulfate, phosphate, pyruvate, and superoxide are also transported, albeit at much slower rates. Several potent and experimentally useful inhibitors of band 3 anion transport are also known, with the most commonly employed being stilbene disulfonates, such as 4,4′-diisothiocyanostilbene-2,2′-disulfonate (DIDS).
The Extracellular Surface of the Band 3 Membrane Domain is the Site of Specific Blood Group Antigens.
Asn642, located in the extracellular loop between helices I and J, is derivatized with a complex lactosaminoglycan that is variable in length and contains the I/i blood group antigens (see Fig. 15-7 ). In fetal cells, the carbohydrate chain is unbranched and has i specificity, whereas in adults there is a branched structure that yields I reactivity. Extracellular domains of band 3 also contain the antigens of the Diego and at least 13 other blood groups.
The Integral Membrane Protein Glycophorin A (GPA) and the Membrane Domain of Band 3 are Functionally Associated.
The Wright (Wr) blood group antigen is formed by the association of GPA and band 3. Glu658 in band 3 is required for normal expression of this blood group antigen, and an Ala65→Pro mutation in GPA causes aberrant Wright antigen expression. Furthermore, a monoclonal antibody directed against the Wr b antigen immunoprecipitates both proteins, and anti-GPA antibodies immobilize both GPA and band 3 in the membrane.
GPA also has a chaperone-like role in bringing band 3 to the plasma membrane. The coexpression of GPA and band 3 facilitates the expression of band 3, red cells lacking band 3 also lack GPA, and mutant band 3 molecules that are stuck in the endoplasmic reticulum can be rescued by coexpression of the mutant band 3 with GPA. GPA also enhances band 3 transport. SO 4 2− transport is diminished 60% in the absence of GPA.
Organization of Band 3 in the Membrane
A variety of evidence supports the concept that band 3 exists in three populations: one tethered to spectrin via ankyrin, one attached to the spectrin/actin junctional complexes via adducin and protein 4.1R, and a freely diffusing population.
Band 3 Mutations
Mutations in band 3 are known to cause hereditary spherocytosis, hereditary stomatocytosis, hereditary cryohydrocytosis, Southeast Asian ovalocytosis, hereditary distal renal tubular acidosis and, in one case, hereditary acanthocytosis. These are discussed in the various sections of Chapter 16 and illustrated in Figures 16-10 and 16-35 . Incomplete processing of the band 3 N-linked lactosaminoglycan moiety occurs in congenital dyserythropoietic anemia type II (CDA II or hereditary erythroblastic multinuclearity with positive acidified serum lysis test [HEMPAS]), which is discussed in Chapter 7 .
Band 3 and Malaria
Plasmodium falciparum parasites are believed to invade red cells via two distinct pathways, one that is dependent on the sialic acids of GPA or glycophorin C (GPC), and a second, a sialic-acid independent, pathway that is linked to band 3. Expression of a parasite protein called PfRh4 correlates with switching to the sialic acid–independent pathway. Liposomes containing purified band 3 inhibit invasion, as does a monoclonal antibody against extracellular epitopes of band 3. Peptides corresponding to the two of the surface loops of band 3 also partially block invasion, suggesting that these regions serve as receptors. MSP1 ( P. falciparum merozoite surface protein 1) furnishes the ligand.
Glycophorins
The glycophorins are a family of integral membrane glycoproteins that account for about 90% of the surface charge of the red cell. The extracellular domains of glycophorins contain abundant negatively charged sialic acid molecules that keep red cells from adhering to each other and to vessel walls. Surface epitopes of the glycophorins generate the blood group antigens in the MNSs system. Glycophorins also serve as receptors for infective agents, such as P. falciparum, and function as chaperones, facilitating the targeting of specific integral membrane proteins to the plasma membrane. The glycophorins belong to the broad family of integral membrane proteins that pass through the lipid bilayer as a single α helix.
Glycophorin A
The glycophorin A (GPA) gene (GYPA) is located on the long arm of chromosome 4 (4q31) and is increasingly expressed throughout erythroid development. It encodes a 36-kD protein that is the major sialoglycoprotein of the red cell (~10 6 copies per cell). It was the first membrane protein to have its complete amino acid sequence determined. Amino acids 1 to 61 form the extracellular N-terminal domain, which contains a complex oligosaccharide attached to Asn26 and 15 serine or threonine O-linked tetrasaccharides with sialic acid moieties ( Fig. 15-11, A ). The carbohydrate component of GPA accounts for 60% of its molecular mass. Experimentally, the glycophorins run anomalously on SDS gels because the abundant carbohydrate interferes with detergent binding. In addition, the carbohydrate interferes with Coomassie Blue staining, such that special stains (e.g., periodic acid–Schiff) are required to visualize the glycophorins. The N-terminus of GPA contains the site of the MN blood group antigens. Amino acids 1 and 5 along with the sialic acid residues on adjacent O-linked tetrasaccharides dictate the antigenicity. Amino acids 1 and 5 are serine and glycine in MM red cells; leucine and glutamic acid in the corresponding positions characterize NN cells. Amino acids 72 to 95 form the transmembrane domain of GPA, which traverses the lipid bilayer as a single α helix. The membrane domain interacts with negatively charged lipids, such as PS and PI at the internal end ( Fig. 15-11, A ). The α-helical transmembrane domains self-associate to form a dimer : Ile76, Val80, and Val84 on the α helix of one monomer interface with Leu75, Gly79, Gly83, and Thr87 on the second monomer. The extracellular domain also contributes to this dimeric interaction, which is strong enough to resist dissociation by detergents.
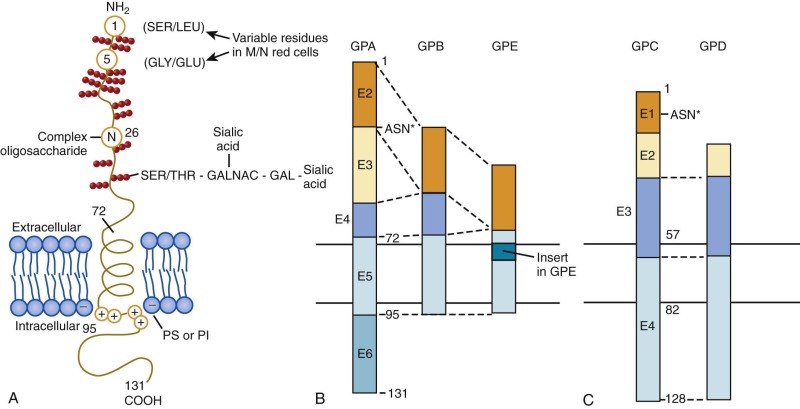
As noted in the earlier section on band 3, the cytoplasmic domain of GPA (amino acids 96 to 131) enhances the trafficking of band 3 to the membrane and increases band 3 anion transport. Conversely, GPA is dependent on band 3 for trafficking or for stable incorporation in the red cell membrane, because mice that lack band 3 also lack GPA.
Interestingly, treatment of red cells with antibodies (or monovalent Fab fragments) to GPA causes GPA to bind to the membrane skeleton and makes the cells rigid. These changes depend on the cytoplasmic domain of GPA, suggesting that it binds to the membrane skeleton in response to a transmembrane signal initiated by antibody treatment. Hypothetically, cellular rigidity induced by adherence of pathogens to glycophorins might enhance reticuloendothelial clearance of infected cells or impede invasion by parasites, but whether it does so is untested.
GPA is a specific marker for the erythroid lineage and is detectable from the proerythroblast stage.
Glycophorin B
The glycophorin B (GPB) gene (GYPB) lies just downstream of GPA on chromosome 4. The first 26 amino acids of the extracellular N-terminal domain are almost identical to the N blood group form of GPA except that GPB lacks the N-linked complex oligosaccharide (see Fig. 15-11, B ). In addition to N–blood group reactivity, GPB carries the S, s, and U blood group antigens, with the S and s antigens differing by substitutions at residue 29 (S = Met, s = Thr). Distally, GPB is missing a portion of the extracellular domain corresponding to exon 3 of GPA and lacks almost all of the cytoplasmic domain. Whether GPB exists as homodimers, as heterodimers with GPA, or as both is not known.
GPB may interact with the RhAG protein in the Rh complex (to be discussed) because RhAG is hyperglycosylated in GPB-null individuals and because GPB expression is decreased in Rh null patients.
Glycophorins C and D
Glycophorins C and D (GPC, GPD) have a general domain structure similar to GPA and GPB (see Fig. 15-11, C ) but are encoded by a distinct gene (GYPC) located on chromosome 2 (2q14-2q21). The gene is maximally expressed in mid-erythropoiesis. GPD is generated from the same mRNA as GPC by means of an alternate initiation codon. GPC is a 32-kD protein bearing one N-linked oligosaccharide and approximately 12 O-linked oligosaccharides in the N-terminal, extracellular domain. Amino acids 41 to 50 of the extracellular domain contain the Gerbich blood group antigens. Like GPA and GPB, the transmembrane domain passes through the lipid bilayer as a single α helix. The cytoplasmic domain of GPC forms a ternary complex with protein 4.1R and p55 and helps attach the spectrin-actin–based skeleton to the plasma membrane (see Fig. 15-6 ). The 30-kD membrane-binding domain of protein 4.1R interacts with amino acids 82 to 98 of GPC and the corresponding residues 61 to 77 of GPD. p55 is a member of the membrane-associated guanylate kinase (MAGUK) family of proteins and contains a single PDZ domain that binds to GPC at residues 112 to 128 and to GPD at the corresponding amino acids 91 to 107. The ternary complex of GPC/GPD, protein 4.1R, and p55 aids in maintaining red cell membrane deformability and mechanical stability. Unlike GPA and GPB, GPC and GPD are expressed in a variety of tissues, although at lower levels than in erythroid cells and with different glycosylation patterns. They may have analogous functions in the membrane mechanics of nonerythroid cells.
Glycophorin E
The glycophorin E (GPE) gene (GYPE) lies just downstream of GPB on chromosome 4 and encodes a putative 78-amino acid protein with structural similarities to GPB (see Fig. 15-11, B ). The extracellular domain of GPE corresponds to exon 2 of GPB, but the amino acid sequence specifies blood group M rather than N. The transmembrane domain contains an 8-amino acid insertion. Like GPB, GPE has a markedly truncated cytoplasmic domain. GPE is believed to have arisen by gene duplication of GPB, which in turn derived from ancestral duplication of GPA. Thus GPA, GPB, and GPE define an erythroid-specific family of integral membrane sialoglycoproteins. The level of expression of GPE and its function, if any, are unknown and it may only be a pseudogene.
Glycophorin Mutations
Defects in GPA, GPB, and GPE Give Rise to Nearly 40 Variant Phenotypes of the MNS Blood Group System.
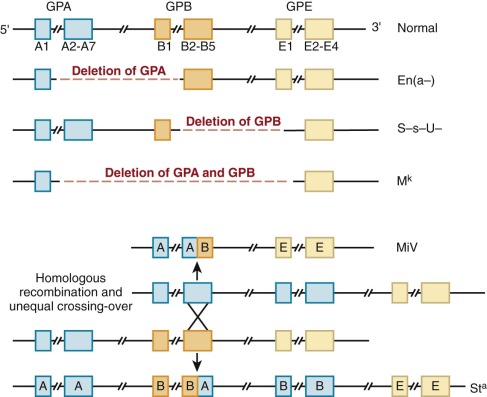
Complete loss of GPA, GPB, or both, often by gene deletion from unequal recombination of the neighboring loci, gives rise to En(a−), (S−s−), and M k M k red cells, respectively ( Fig. 15-12 ). En(a−) red cells, for example, are completely deficient in GPA and have weak MN blood group antigens. The affected red cells compensate for a potential 60% loss of surface charge by increasing the glycosylation of band 3, such that the overall surface charge is only reduced by approximately 20%. Given the proximity and homology of GPA, GPB, and GPE genes, hybrid glycophorin molecules may be generated by recombination events during meiosis. In the MiV variant, for example, Lepore-like recombination yields a fusion gene containing the N-terminus of GPA and C-terminus of GPB. In the St a variant, anti-Lepore recombination produces the reverse hybrid (N-terminal GPB with C-terminal GPA), which is inserted between the normal GPA and GPB genes, neither of which is lost. Interestingly, none of the GPA and GPB variants produces detectable changes in erythropoiesis or in the shape, function, or life span of the affected red cells. Rare individuals with complete absence of GPA and GPB apparently exhibit no erythrocyte abnormalities. Similarly, GPA knockout mice have a normal phenotype except that they have 60% less O-linked oligosaccharides than normal red cells. Thus either GPA, GPB, and GPE do not serve any critical basal functions in red cells or such functions are subsumed by other protein(s), such as GPC or band 3, when GPA, GPB, and GPE are deficient. If GPA really has no nonredundant function, it is surprising that deletions and other mutations are not more common, because GPA is a major receptor for P. falciparum malaria (see later) and must be under intense evolutionary pressure.
Variations in GPC and GPD Affect the Gerbich Antigen System.
Mutations in the extracellular domain of GPC and GPD alter the antigenicity of red cells (Gerbich antigen system) but do not affect cellular mechanical properties. In contrast, in the Leach phenotype there is complete loss of GPC and GPD secondary to deletion of exons 3 and 4 or a frameshift mutation. Affected individuals do not have significant hemolysis, but their red cells are slightly elliptocytic and exhibit decreased membrane deformability and mechanical stability, probably because GPC-deficient cells are partially deficient in protein 4.1R and p55. Individuals with homozygous protein 4.1R deficiency have a more profound deficiency of GPC (~70%) in their elliptocytic red cells, underscoring that the cellular content of each component of the ternary complex depends on the expression level of the others.
Glycophorins as Receptors for Malarial Invasion
Invasion of red blood cells by P. falciparum malaria occurs by multiple different pathways, depending on the species, and involves all of the different glycophorins. GPA serves as the receptor for the parasite ligand EBA-175. A membrane fraction containing GPA or antibodies to GPA inhibits malarial invasion, and erythrocytes lacking GPA resist invasion. The binding specificity of EBL-175 is determined by the Neu5Ac-(α2,3)-Gal moiety on the O-linked tetrasaccharides of GPA and on the amino acid sequence, which places the sugars in the proper configuration.
GPB-dependent invasion is also sialic acid dependent but is believed to utilize another parasite ligand.
GPC appears to be the receptor for a third sialic acid–dependent pathway for P. falciparum malaria. GPC/GPD-deficient red cells (Leach blood group phenotype) and protein 4.1R–deficient red cells (which partially lack GPC) resist malarial invasion in vitro, and up to 50% of the Melanesian population in the malarious coastal areas of Papua New Guinea have red blood cells that are Gerbich blood group negative, owing to a deletion in the third exon of the GPC gene. GPC binds the P. falciparum ligand EBA-140, which is also called BAEBL.
In addition, there are P. falciparum strains that invade neuraminidase-treated red cells (i.e., cells lacking sialic acid), so a sialic acid/glycophorin-independent mechanism(s) for malarial invasion also exists. One such mechanism may involve merozoite adhesion to band 3.
The existence of so many ways for P. falciparum to invade erythrocytes and the ability to switch between invasion pathways obviously complicates efforts to create a malarial vaccine.
Other Integral Membrane Proteins
Although band 3 and the glycophorins are the major integral membrane constituents of the red cell membrane, a large number of other integral membrane proteins with specific functions have also been identified and characterized.
Basigin
Basigin, or CD147, is a glycosylated integral membrane protein belonging to the immunoglobulin superfamily. The common 269-amino acid isoform basigin-2 has two external immunoglobulin domains and a single transmembrane domain. It binds to and regulates the expression of monocarboxylic acid transporters (MCTs). A complex between basigin, MCTs, and CD44 occurs in breast cancer cells and probably in erythroid cells. Basigin has many functions in cancer, infection, inflammation, and development, but in the red cell its known functions are that it carries the common OK blood group antigen and serves as the receptor for the P. falciparum protein PfRh5. Unlike the glycophorins and band 3, which are required for the adhesion of some parasites but not others, it appears that basigin and PfRh5 are required for all P. falciparum strains. PfRh5 cannot be deleted from the pathogen, and antibodies to PfRh5 block invasion of all strains, as do antibodies to basigin or knockdown of the protein in red cells. This makes the PfRh5/basigin complex a prime target for a malarial vaccine.
Rh Proteins (RHD, RHCE, and RhAG)
The Rh blood group system comprises at least 40 independent antigens carried by two nonglycosylated, palmitoylated proteins encoded by two homologous genes, RHD and RHCE, located on chromosome 1. RHCE encodes the CcEe set of antigens, and RHD encodes the D antigen. Rh antigen expression at the red cell surface requires the presence of the Rh-associated glycoprotein (RhAG), which exhibits 36% sequence identity with Rh proteins and is encoded by a gene located on chromosome 6. There are 100,000 to 200,000 copies of RhD, RhCE, and RhAG per cell, and they probably form a heterotrimer based on the structure of the kidney isoform of RhAG. They are each predicted to have 12 membrane-spanning domains. In addition to the interaction between the three Rh subunits, the Rh core complex also contains several other proteins —LW glycoprotein (ICAM-4), integrin-associated protein (IAP, CD47), GPB, and protein 4.2. The core complex is part of the ankyrin complex (see Fig. 15-6 ).
The RhAG protein functions as an NH 4 + -NH 3 transporter in mouse and human red cells and can complement defects in ammonium transport in yeast. It may also be partly responsible (along with aquaporin-1) for the exceptionally high permeability of CO 2 in the erythrocyte. And some researchers speculate that it may serve as a channel for nitric oxide. The importance of the Rh complex in regulating red cell membrane structure is revealed by the altered phenotype of Rh null red cells, which exhibit stomatocytic morphology with loss of membrane surface area, cell dehydration, cation permeability abnormalities, and shortened red cell survival, leading to a mild compensated hemolytic anemia. The Rh null syndrome is discussed in Chapters 16 and 36 .
Defects in RhAG that block the ammonium channel and make it highly permeable to Na + ions are responsible for overhydrated hereditary stomatocytosis (see Chapter 16 ).
Kidd Glycoprotein
The Kidd glycoprotein (Jk antigen, SLC14A1) is the urea transporter in the red cell membrane and the kidney. The human Kidd glycoprotein gene is located on chromosome 18q12.3 and encodes a 389-amino acid polypeptide with 10 membrane-spanning domains. There are roughly 10,000 copies of Kidd glycoprotein per cell, and the protein carries the antigens of the Kidd blood group system. The Kidd glycoprotein forms the urea transporter in red cells, which functions by rapidly transporting urea into and out of red cells as they pass through the high urea concentration in the renal medulla. Urea transport across Kidd null red cell membranes is approximately a thousand times slower than across normal membranes. However, no changes in red cell shape or survival have been noted in persons who lack the Kidd glycoprotein.
Kell Glycoprotein
Kell glycoprotein is a 93-kD (732 amino acids) single-pass type II membrane protein encoded by a gene on chromosome 7q34. It is a zinc endopeptidase that functions as an endothelin-3–converting enzyme on the erythrocyte surface. It can also cleave the precursors of endothelin-1 and endothelin-2, but much less effectively. Because endothelins are potent vasoactive peptides, it is believed the Kell glycoprotein may be involved in regulation of vascular tone. There is evidence that endothelin-3 may also activate Ca 2+ -ATPase in the red cell. The Kell glycoprotein carries the antigens in the Kell blood group system. Isolated Kell glycoprotein deficiency does not alter red cell life span or morphology.
Kx Protein
The Kx protein is a 37-kD protein (444 amino acids) with 10 membrane-spanning domains that is encoded by a gene (XK) on the short arm of the X chromosome, The Kx protein carries the Kx blood group antigen. In the red cell membrane the Kx protein is covalently linked to the Kell glycoprotein by a disulfide bond. The Kx/Kell complex is part of a larger complex of proteins that are located at the spectrin/actin/protein 4.1R junctions (see Fig. 15-6 ). The Kx protein has structural but not sequence similarity with a family of proteins involved in transport of neurotransmitters; however, its transport substrate(s) have not been defined. Experiments on red cells from Kell, Kx, and Kell/Kx knockout mice suggest that Kell and Kx affect Ca 2+ and Mg 2+ homeostasis and red cell volume. Whether this is a direct or indirect effect is not known. Unlike isolated Kell deficiency, which has no evident phenotype, lack of the Kx protein in McLeod syndrome results in acanthocytic red cells, compensated hemolytic anemia, and, in later life, muscle wasting and choreiform movements. McLeod syndrome is discussed in Chapter 36 .
Duffy Antigen/Chemokine Receptor
The Duffy blood group, atypical chemokine receptor (DARC or Fy antigen), is a promiscuous chemokine receptor that binds a variety of proinflammatory cytokines of both the C-X-C class (acute inflammation) and the C-C class (chronic inflammation), including interleukin-8, MGSA (melanoma growth stimulatory activity), MCP-1 (monocyte chemotactic protein 1), and RANTES (regulated on activation, normal T-cell expressed and secreted). The DARC gene is located on chromosome 1q23.2 and encodes a 338-amino acid polypeptide with seven membrane-spanning domains. There are 6,000 to 13,000 copies of DARC per cell and the protein carries the antigens of the Duffy (Fy) blood group system. DARC is the receptor for the human malarial parasites Plasmodium vivax and Plasmodium knowlesi. Duffy-deficient red cells, Fy(a−b−), which are common in individuals from Central and West Africa, are refractory to invasion by most, but not all, strains of P. vivax. The Duffy phenotype Fy(a+b−) also provides considerable protection. On the other hand, DARC is necessary for platelet killing of P. falciparum malaria. Platelet factor 4, a cytokine released from activated platelets, binds to the DARC and kills the parasite. The function of DARC in normal red cell physiology remains to be defined.
Lutheran Glycoprotein/Basal Cell Adhesion Molecule
The Lutheran blood group (Lu) resides on the basal cell adhesion molecule (BCAM), which belongs to the immunoglobulin superfamily and is the receptor on erythroid cells for the extracellular matrix protein laminin. The Lu/BCAM glycoprotein consists of five disulfide-bonded extracellular immunoglobulin superfamily domains, a single hydrophobic transmembrane domain, and a short cytoplasmic tail. Two isoforms of this membrane protein (85-kD and 78-kD isoforms) are expressed by alternative splicing of a single gene located on human chromosome 19q13.32 and are distinguished by differences in their cytoplasmic domains—the 78-kD isoform has a truncated cytoplasmic tail. Both isoforms bind laminin. Binding is stimulated by epinephrine and is dependent on phosphorylation of Lu/BCAM by protein kinase A. There are 1500 to 8000 copies of Lu glycoprotein on the mature red cell. Lu/BCAM directly interacts with the fourth spectrin repeat of α spectrin. Disruption of this linkage enhances red cell adhesion to laminin and is observed in hereditary spherocytes. Increased laminin binding by red cell Lu/BCAM also seems to be important in the adhesion of sickle red cells. The interaction between the α4β1 integrin on sickle cells and the Lu/BCAM protein on endothelial cells may also be important. Hydroxyurea decreases the phosphorylation of Lu/BCAM and decreases the laminin adhesion of sickle cells. Constitutive Lu/BCAM phosphorylation mediates the increased adhesion of red cells to laminin in polycythemia vera and may contribute to the enhanced risk for thrombosis in that disease. The Lu/BCAM-spectrin interaction is also involved in actin cytoskeleton dynamics in nonerythroid cells and is required for actin stress fiber formation.
About 1 person in 5000 inherits the In(Lu) genotype, which partially suppresses expression of Lu a and Lu b and is the most common cause of the null Lutheran phenotype, Lu(a−b−). In(Lu) is not a dominantly acting inhibitor as originally believed but is caused by inactivating mutations in one of the two KLF1 genes or rarely GATA-1. KLF1 encodes EKLF, a transcription factor that controls many erythroid genes and is critical in erythroid development. Patients with the Lu(a−b−) phenotype due to In(Lu) have abnormally shaped red cells but no hemolysis. The morphology varies from normal or mild poikilocytosis to acanthocytosis.
LW Glycoprotein
The LW glycoprotein (also termed ICAM-4) also belongs to the immunoglobulin superfamily. The glycoprotein carries the Landsteiner-Weiner (LW) blood group and consists of two extracellular immunoglobulinlike domains that show very strong sequence homology with the protein superfamily known as intracellular adhesion molecules (ICAMs). The 37- to 43-kD LW glycoprotein is encoded by a gene on chromosome 19p13.2. There are approximately 4000 copies of LW glycoprotein on the mature red cell. Preliminary evidence suggests that extracellular domains of LW glycoprotein can interact with integrins LFA1 (CD11/CD18) and α4β1 and αV integrins. Like Lu/BCAM, LW glycoprotein is activated by epinephrine and may also play a role in adhesion of sickle cells by directly increasing the binding of sickle cells to endothelium and by indirectly activating lymphocytes and monocytes and increasing their attachment to vessel walls.
CD47
CD 47, or integrin-associated protein (IAP), is a ubiquitously expressed, highly glycosylated five-span transmembrane protein with a single extracellular immunoglobulin domain and a small intracellular domain. It is widely distributed and is involved in a range of cellular functions, including apoptosis, proliferation, phagocytosis, adhesion, angiogenesis, inflammation, and cell migration.
There are about 17,000 CD47 molecules per erythrocyte. Part of the CD47 is attached to the membrane skeleton and part is mobile and able to cluster. Human CD47 interacts with the Rh protein complex and with protein 4.2. Reduction of protein 4.2 or band 3 leads to marked reduction in CD47 (see later section on protein 4.2 ). The human RhCE protein is also crucial for CD47 expression because red cells that lack Cc and Ee antigens have a 75% reduction in CD47.
In the mature red cell, CD47 may function as a marker of “self.” It interacts with the inhibitory receptor SIRPα (signal regulatory protein α, CD172a) on macrophages and inhibits phagocytosis. Mouse red cells that lack CD47 are rapidly cleared from the blood by splenic macrophages. The CD47-SIRPα interaction blocks phagocytic signaling from complement receptors, Fcγ receptors, and low-density lipoprotein (LDL) receptor–related protein-1. It does not inhibit scavenger receptors. Enhancing the interaction offers therapeutic promise in autoimmune hemolytic anemias and thrombocytopenias but so far has not been achieved. Interestingly, attaching peptides that contain the CD47 “self” signal to nanoparticles prolongs their life in the circulation, enhancing their utility in drug delivery or imaging.
Aquaporins
Aquaporin-1 (AQP1), a 28-kD channel-forming protein, is the major water channel in red cells. The human aquaporin-1 gene (AQP1) is located on chromosome 7p14 and encodes a 269-amino acid polypeptide with six membrane-spanning domains. Besides red cells, AQP1 is also expressed in the kidney and in the endothelial cells in lung. There are 120,000 to 160,000 copies of AQP1 per cell, and the protein carries the antigens of the Colton blood group. It exists as a tetramer in the red cell membrane, and the crystal structure of the protein is known. AQP1 can be cross-linked to stomatin in red cell membranes, which suggests at least some of it resides in lipid rafts. Human red cells lacking AQP1 exhibit markedly reduced osmotic water permeability. Humans with complete deficiency of AQP1 have defective urinary concentrating ability as well as decreased pulmonary vascular permeability. AQP1 knockout mice appear normal but become severely dehydrated and lethargic compared with control mice after water deprivation for 36 hours. Interestingly, implanted tumors grow very poorly in AQP1(−/−) mice because of reduced vascularity and very poor cell migration. These studies show that AQP1 also has an unexpected role in cell migration and thus in angiogenesis and wound healing. There is evidence that AQP1 also facilitates CO 2 and perhaps NH 3 transport across the red cell membrane.
Aquaporin-3 (AQP3) is the glycerol permeability channel in human red cells and carries the high-frequency blood group antigen GIL. Humans lacking the channel are asymptomatic. In mice, AQP3 is not expressed in red cells and aquaporin-9 (AQP9) is the glycerol channel. AQP9-deficient mice survive longer during the initial phase of mouse malaria, perhaps because plasma glycerol is an important substrate for lipid biosynthesis in malarial parasites.
Stomatin
Stomatin or band 7.2b (gene name EPB72 ), is a 31.5-kD integral membrane protein (approximately 28-kD on SDS gels). It is a positively charged, homooligomeric (estimated 9 to 12 subunits), phosphorylated (cyclic adenosine monophosphate [cAMP]–dependent kinase), palmitoylated integral membrane protein with a single transmembrane helix, a small external segment, and a relatively large cytoplasmic domain. It is present in all tissues and is found throughout evolution. As noted earlier, it is located, at least in part, in membrane lipid rafts. Stomatin is a member of a protein superfamily—the PID superfamily, which stands for proliferation ion and death. Red cells contain other members of this family, such as SLP-2 and STORP, but nothing is known about their functions or interactions.
Stomatin normally binds to the major glucose transporter, Glut1 (or SLC2A1), which also resides in lipid rafts, and to band 3 and AQP1. The site of binding on band 3 is unknown. In human red cells it switches Glut1 to an l -dehydroascorbic acid transporter (see following section). It may also interact with peroxiredoxin-2 (see later section), which itself attaches to band 3 (see Fig. 15-6 ). Stomatin is interesting because it is diminished by 95% to 98% in the classic type of hereditary stomatocytosis, a severe hemolytic anemia characterized by red cell membranes that are extremely leaky to Na + and K + ions. The protein and its relationship to the disease are discussed in “Overhydrated Hereditary Stomatocytosis” in Chapter 16 .
Glucose Transporter 1
Glucose transporter 1 (Glut1, SLC2A1) is a 492-amino acid integral membrane glycoprotein that runs as a diffuse 45- to 65-kD band on SDS gels owing to heterogeneous glycosylation. It is one of the most abundant proteins in the red cell membrane, with more than 200,000 copies per cell arrayed as homodimers and homotetramers. The protein has a typical transport channel structure with 12 membrane spanning domains and a large hydrophilic cytoplasmic loop in the center. In humans, Glut1 transports dehydroascorbic acid (DHA, the oxidized form of vitamin C) as well as glucose. Remarkably, Glut1 is only expressed in the mature red cells of a small subset of mammals that have lost the ability to synthesize ascorbic acid from glucose, including humans, some of the other higher primates, guinea pigs, and fruit bats. In other mammals, Glut1 is expressed in fetal red cells but is lost soon after birth. In mice, Glut4 synthesis is upregulated as Glut1 disappears and presumably takes over the job of supplying the glucose needed to fuel the red cell. The change from transport of glucose to transport of DHA in humans is tied to the binding of stomatin to Glut1. Under physiologic conditions adequate glucose is transported because the concentration of glucose in the plasma (~5 mM) greatly exceeds the concentration of DHA (<2 µM). This may not be so in the leakiest hereditary stomatocytes where the cells need prodigious amounts of ATP to pump out a torrent of Na + and water and survive (see Chapter 16 ).
Glut1 also interacts with dematin and adducin (see Fig. 15-6 ) and perhaps band 3 (unpublished comment ). These interactions contribute to connecting the membrane skeleton to the lipid bilayer. It will be interesting to see whether they also regulate the function of Glut1.
Membrane Skeleton Proteins
Spectrin
Erythroid spectrin is the major constituent of the red cell skeleton, accounting for 50% to 75% of the skeletal mass. Its discovery by Marchesi and Steers in 1968 launched the modern era of investigation of the plasma membrane. The spectrin-based skeleton is anchored to the plasma membrane by an ankyrin-mediated linkage to band 3 and its associated proteins at one end of spectrin and by a protein 4.1R–mediated attachment to band 3 and glycophorin C and other proteins in another multiprotein complex at the opposite end of spectrin (see Fig. 15-6 ). Spectrin is composed of two large polypeptide chains: a 280-kD α chain and the 246-kD β chain that are structurally similar but functionally distinct ( Fig. 15-13, A ). The two chains associate side by side in an opposing (antiparallel) orientation and are twisted about each other in a right-handed double helix.
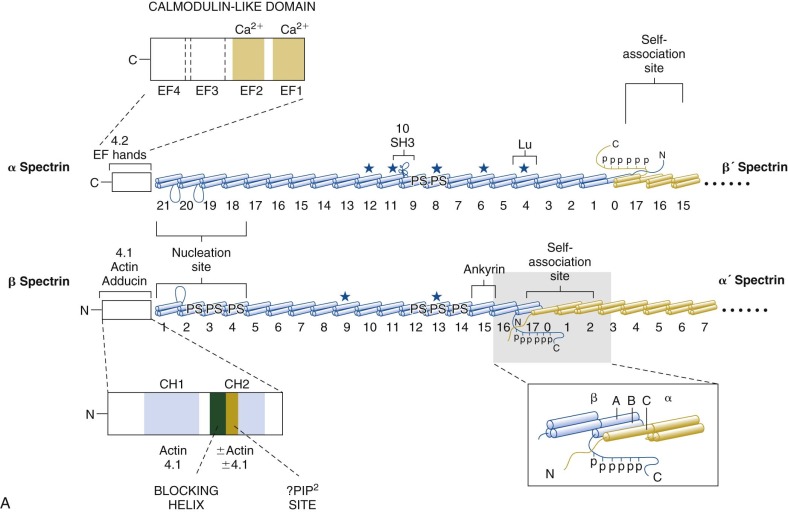
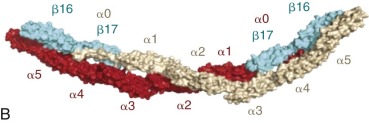
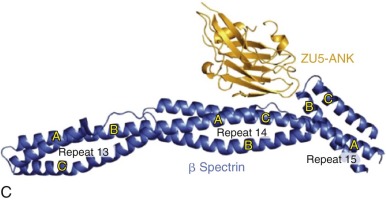
The Spectrin Family in Humans is Encoded by at Least Seven Distinct Genes.
Two genes encoding for α spectrin and five genes encoding for β spectrin have been characterized. The αI-spectrin gene (SPTA) is located on chromosome 1q22-q23 adjacent to the Duffy blood group and encodes the erythroid-spectrin α chain. The αII-spectrin (also called α-fodrin) gene (SPTAN1) encodes an α-spectrin homologue found in nearly all cells except mature red cells. The βI-spectrin gene (SPTB) is located on chromosome 14q23-q24.2 and encodes the β subunit of erythroid spectrin, designated βI, isoform 1 (or βIΣ1). The βI gene promoter region contains specific GATA1 and CACCC-related protein binding sites that account for specific, high-level expression in erythroid cells. Differential 3′-processing of the βI-spectrin pre-mRNA generates an alternative, longer βI-spectrin subunit (βI, isoform 2 or βIΣ2) that is found in brain and muscle. The βII-spectrin (also called β-fodrin) gene (SPTBN1) encodes the generally expressed β subunit of spectrin, which shares 60% amino acid identity with βI spectrin. Thus erythrocyte spectrin is composed of αI and βI (isoform 1) chains and the widely expressed spectrin (called fodrin, tissue spectrin or brain spectrin) contains αII and βII subunits. Muscle spectrin is believed to contain predominantly αII and βI (isoform 2) subunits.
βIII and βIV spectrins are predominantly expressed in the central nervous system. Gene mutations cause neurologic diseases. A truncated isoform of βIV spectrin is associated with a subnuclear structure (promyelocytic leukemia bodies) and may be part of a nuclear scaffold. βV spectrin is mostly in retinal rods and cones and in gastric epithelial cells. Other spectrin-related proteins—dystrophin, utrophin, actinins, plakins, and dystonin among others—are not relevant to red blood cells.
Spectrin Repeats
Spectrins Consist Mostly of Tandem 106-Amino Acid Repeats.
Each spectrin chain is composed of a series of approximately 106-amino acid repeats. Each repeat is formed by three α-helices that are folded into a triple helical bundle. The α and β spectrins contain 20 and 16 full repeats, respectively. An SH3 domain within the α chain is conventionally called repeat α10, although it is not a true spectrin repeat (see Fig. 15-13, A ). As will be discussed, the α0 and β17 repeats are complementary partial repeats that join to form a full repeat and link spectrins together. The primary sequence of each repeat exhibits extensive heptad (seven-residue) symmetry, with conserved hydrophobic residues situated in the first and fourth positions of each heptad motif (designated as positions a and d in Fig. 15-14, A ). Each triple helical spectrin repeat is approximately 5 nm long and 2 nm wide (see Fig. 15-14, B ) and is rotated 60 degrees (right-handed) relative to the neighboring repeats. Details of the structure are presented in Figure 15-14 and in catalogs of spectrin repeat structures.

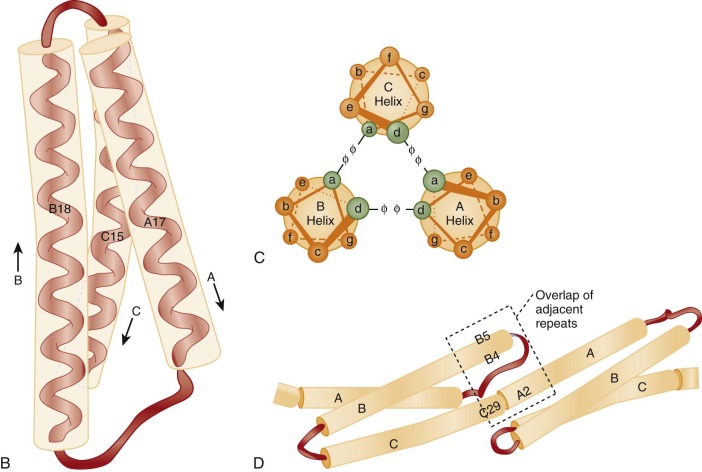
Although spectrin is often depicted as a highly flexible molecule, the repeats themselves appear rigid and the crystal structures of multiple repeats do not show significant flexibility at the junction between repeats (see Fig. 15-14, D ). However, the stability of individual repeats varies and some are unstable at physiologic temperatures, which would introduce flexibility. Two of the less stably folded repeats, α13-α14 and β8-β9, are adjacent to each other in the spectrin molecule (see Fig. 15-13, A ) and may form a hinge. Measurements of the force required to unfold a spectrin repeat show that the repeats function as elastic springs. When intact red cells deform, certain spectrin repeats partially unfold, which presumably contributes to the elasticity.
Spectrin Heterodimerization
Side-to-Side Interactions Between α and β Chains Results in Zipperlike Dimerization.
Nucleation sites located at repeats 18 to 21 of the α chain and 1 to 4 of the β chain are implicated in triggering the zipping up of α and β chains (see Fig. 15-13, A ). The key interactions are between the A and B helices of β spectrin repeat 1 and the C and A helices of α spectrin repeat 21 and between the C and A helices of β2 and the A and B helices of α20. These helices form complementary charged surfaces that draw the two chains together. After the initial tight association of these nucleation sites, a conformational change is propagated, causing the remainder of the α and β chains to pair together. The two chains twist around each other with a periodicity of a complete turn approximately every four to eight repeats. The side-to-side interactions beyond the nucleation site are relatively weak, which may be important in allowing the α and β chains to slide past each other when the spectrin molecule flexes in the plane of the membrane. A common polymorphism of the α-spectrin allele, α LELY , encodes α chains that lack one of the nucleation sites and therefore do not form stable heterodimers. This clinically relevant allele is discussed in under “Hereditary Elliptocytosis” in Chapter 16 .
Spectrin Self-Association
Spectrin Tetramerization Occurs in Head-to-Head Fashion by Association of the Partial Repeats at the Ends of α- and β Spectrin and Side-to-Side Association of the First Three α-Spectrin Repeats.
The “self-association” sequences required for tetramerization are located at the N-terminus of the α-spectrin chain and the C-terminus of the β-spectrin chain. This is called the “head” end of spectrin and is opposite the “tail” end where binding to actin occurs and where the nucleation site is found (see Fig. 15-13, A ). The specific structure of the spectrin self-association site has been extensively analyzed. The free C helix at the N-terminus of α spectrin (α0) associates with the free A and B helices at the C-terminus of β spectrin (β17) to form a stable triple helical bundle repeat (α0/β17). In this manner, spectrin heterodimers associate to form tetramers and higher-order oligomers in head-to-head fashion (see Fig. 15-13, A ).
In isolated spectrin heterodimers the partial repeats at the ends of the α and β chains are bound to each other. The longer α chain folds back on itself so that the noncovalent α0/β17 repeat lines up and interacts with repeat α4 and so that repeats α3 and α1 interact with each other. In the heterotetramers, there are three such side-to-side interactions between repeats in the two α-spectrins (α and α′): α1-α′3, α2-α′2, and α3-α′1 (see Fig. 15-13, B ). These additional lateral interactions, although weak, contribute to self-association. For dimers to associate into tetramers or vice versa, the bonds involved in self-association must first open. This is the rate-limiting step in dimer-to-tetramer interconversion.
The formation of spectrin tetramers and higher-order oligomers is critical to maintaining the mechanical strength of the membrane skeleton. Mutations in α or β spectrin that interfere with self-association weaken the membrane skeleton. Such defects are by far the most common cause of hereditary elliptocytosis and hereditary pyropoikilocytosis (see Chapter 16 ).
Spectrin Exists Predominantly as Tetramers in Vivo.
Physiologic ionic strength and lower temperatures (25°C) favor tetramer formation; low ionic strength and physiologic temperatures favor dissociation to dimers. The self-association of spectrin can be studied in purified spectrin and by manipulating red cell ghosts to alter the degree of spectrin oligomerization. In red cell ghosts, driving the equilibrium toward dimerization produces exceedingly fragile structures, underscoring the importance of spectrin tetramerization in membrane skeletal stability. At 4°C, the dimer-tetramer equilibrium is nearly kinetically frozen owing to its high activation energy. Thus spectrin eluted from ghosts at that temperature retains the degree of oligomerization that existed in vivo. In such eluates, approximately 5% of the spectrin is heterodimers, approximately 50% exists as heterotetramers, and the remainder are divided among higher-order spectrin oligomers and high-molecular-weight complexes of spectrin, actin, protein 4.1R, and dematin.
Spectrin Structure In Situ
Spectrin Molecules are Condensed in Vivo.
Electron micrographs of purified spectrin tetramers or spectrin filaments in fully stretched skeletons show the molecule has an end-to-end length of 200 nm. But, as discussed later, simple calculations show that spectrin tetramers can only have a length of 62 to 72 nm in vivo. This correlates with the observed length of spectrin filaments in unstretched and partially stretched skeletons. It is not known exactly how spectrin is folded in this physiologic filament. The best morphologic evidence is that the α and β subunits form a double helix and are twisted about each other along a relatively straight common axis ( Fig. 15-15 ). Spectrin molecules extend and contract along this axis by varying the pitch and diameter of the double strand. This springlike behavior serves as a “molecular shock absorber” and is presumably critical to the elastic behavior of the membrane. Native spectrin tetramer has approximately 10 turns with a pitch of 7 nm and a diameter of 5.9 nm. This corresponds to 1 turn every four spectrin repeats. Structural analyses of the spectrin self-association site also show that the chains coil around each other, but with a periodicity of about 1 turn per eight repeats (see Fig. 15-13, B ). Other structural models suggest there is some bending between spectrin repeats or that helices within some repeats may “melt” and rearrange, shortening the repeat. Whatever the mechanism, it is clear that the ends of a spectrin molecule are normally only about one-third as far apart as they appear in stretched skeletons.
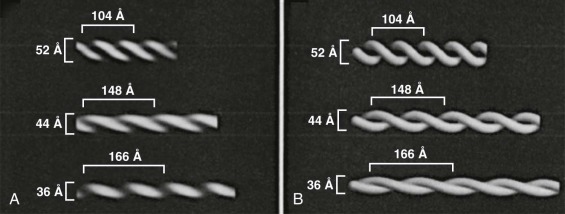
Spectrin Interactions
Spectrin Contains Important Functional Domains Involved in Protein-Protein Interactions.
In addition to the critical sequences involved in spectrin nucleation and self-association, the α and β chains interface with other proteins, including ankyrin, proteins 4.1R and 4.2, actin, adducin, and dematin, via defined structural domains (see Fig. 15-13, A ).
Ankyrin-Binding Site.
Repeats 14 and 15 of β spectrin are crucial for ankyrin binding, especially the C helix of repeat β14 and the loop between helices B and C of repeat β15. Repeat β15 forms an unusual angle with repeat β14, and the spectrin-binding region of ankyrin (called ZU5A or ZU5-ANK, discussed under “Ankyrin”) nestles into the corner formed by the two repeats (see Fig. 15-13, C ). The attachment of β spectrin to ankyrin and ankyrin to band 3 and some of its associated proteins (see Fig. 15-6 ) creates spectrin’s strongest link to the overlying lipid bilayer. In nonerythroid cells, ankyrin homologues mediate the linkage of spectrin to many other proteins of the plasma membrane, including Na + ,K + -ATPase and voltage-dependent sodium channels.
Binding Sites for F-Actin, Protein 4.1R, Adducin, and Dematin.
The N-terminal 301 amino acid of β spectrin binds protein 4.1R and actin and shares sequence homology with several actin-binding proteins, including calponin, α actinin, dystrophin, filamin, ABP 120, adducin, and fimbrin. There are two of these “calponin homology domains” (CH1 and CH2) in tandem in β spectrin. It appears that protein 4.1R and actin bind to each of these domains. Binding to CH2, the more C-terminal CH domain, is normally inhibited by an α helix at its N-terminus, which may serve a regulatory role (see Fig. 15-13, A ). PIP 2 increases attachment of protein 4.1R to the CH domains.
Adducin binds to the N-terminal actin-binding domain and the first two repeats of β spectrin. Because mutations within the last few repeats of α spectrin markedly reduce membrane adducin content, the C-terminus of α spectrin probably also contributes to adducin binding.
Dematin, but not phosphorylated dematin, binds somewhere in the tail region of spectrin and facilitates binding of spectrin to F-actin. The exact binding site is unknown.
The tail ends of spectrin tetramers and oligomers bind to short, double-helical protofilaments of F-actin. The interaction is greatly enhanced by protein 4.1R. Approximately six spectrins can be accommodated on each actin protofilament, leading to the characteristic quasi-hexagonal organization of the membrane skeleton ( Fig. 15-16 ). The spectrin/actin/protein 4.1R junctional complexes contain other proteins, including adducin, dematin, tropomyosin, tropomodulin, and p55. These are discussed in the sections that follow.
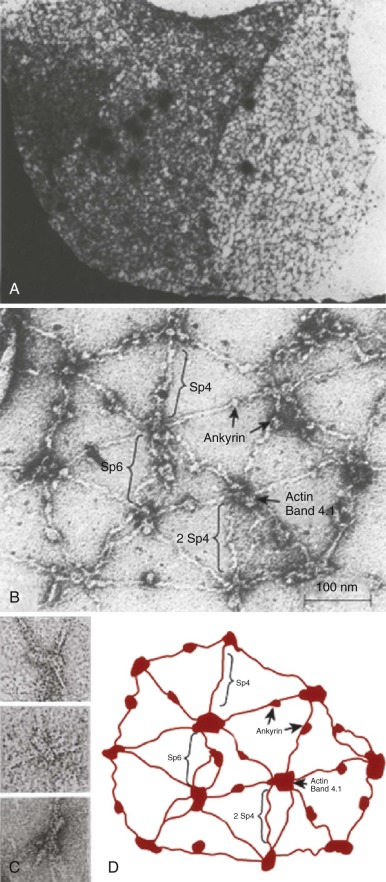
EF Hands: Ca 2+ – and Protein 4.2–Binding Sites and Role in Spectrin-Actin Binding.
The C-terminus of α spectrin, like α actinin, contains two pairs of EF hands (see Fig. 15-13 ), which are structures that bind and mediate the regulatory effects of calcium. The N-terminal EF hands (EF 1,2 ) are structurally similar to calmodulin and bind Ca 2+ with low affinity. Ca 2+ binding to EF 1 triggers a conformational change that allows EF 2 to bind Ca 2+ . The C-terminal EF hands (EF 3,4 ) are Ca 2+ insensitive and similar to those in α actinin.
The EF hand domain binds protein 4.2 with high affinity (kD = 3 ×10 −7 M). The binding capacity is augmented by micromolar concentrations of Ca 2+ , and the Ca 2+ effect is blocked by calmodulin, which also binds to the domain. Because protein 4.2 binds to band 3, this adds to the evidence that a portion of band 3 is located near the spectrin-actin junctions and serves as a secondary site for attaching the membrane skeleton to the lipid bilayer. It is not known whether protein 4.2 actually binds to the EF hands in vivo and, if so, what fraction of the protein is located there and what fraction is located in the ankyrin complex (see Fig. 15-6 ).
The relationships of the EF hand domain, the calponin homology domain, and F-actin are not known in spectrin but are likely to resemble those in α actinin ( Fig. 15-17 ). That is, the EF hands probably abut the actin/protein 4.1R–binding CH domains and may help regulate actin binding. Previously the EF hands were believed to be impotent in erythroid spectrin, although they were known to bind Ca 2+ and affect the function of αIIβII spectrin (fodrin). However, deletion of just the C-terminal 13 amino acids in the EF domain of the sph 1J mouse leads to a severe, spherocytic hemolytic anemia and failure of the mutant spectrin to assemble into the membrane skeleton. Also, PfEMP3, a protein from P. falciparum that appears on the red cell membrane late in the parasite life cycle, binds to α spectrin in the EF hand domain region and disrupts the spectrin/actin/protein 4.1R complex, perhaps as a precursor to release of new parasites into the circulation. These observations show that the EF hand domain is functionally important, and direct evidence supports this conclusion. A minispectrin composed of the actin binding and EF hand domains and the four adjacent spectrin repeats in each chain that form the nucleation site binds to F-actin with the aid of protein 4.1R, as expected, but this binding is blocked if the EF hands are missing, or even if just the last 13 amino acids of α spectrin are deleted, as in the sph 1J mouse.
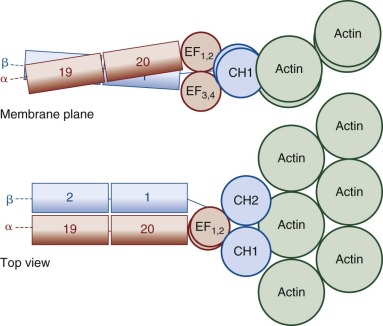
SH3 Domain.
The tenth “repeat” of α spectrin encodes an src homology (SH3) domain. SH3 domains generally function as sites of protein-protein attachment at cell membranes. The function of the erythroid α-spectrin SH3 domain and the protein(s) that bind to it in the red cell are not known. One candidate belongs to a family of tyrosine kinase–binding proteins. Interestingly, plasmepsin II, the aspartic protease of P. falciparum, cleaves spectrin mainly within the SH3 domain of α spectrin, suggesting that specific targeting of the SH3 domain by P. falciparum may be part of the strategy to dismantle the membrane skeleton.
PH Domain.
All β spectrins except the major erythroid isoform (βI, isoform 1) have a C-terminal extension that contains a pleckstrin homology (PH) domain. The specialized 100-residue PH domain is believed to mediate membrane targeting of proteins. The muscle isoform of erythroid spectrin (βI, isoform 2) contains a PH domain, and mature red cells contain a small amount of this isoform, which is clumped in submicron-size patches within the membrane skeleton. The erythroid spectrin PH domain binds with equal affinity to PIP 2 and phosphatidylinositol-3,4,5-trisphosphate (PIP 3 ). The function of the PH domain in red cells is untested. Perhaps it contributes to the attachment of spectrin to the membrane.
Phospholipid Binding.
In addition to the PH domain, which binds phosphatidylinositols (PI), other parts of spectrin also bind phospholipids. Several spectrin repeats in each chain bind phosphatidylserine (PS) ( Fig. 15-13, A ). The PS binding sites on β spectrin are located near the site where ankyrin and the junctional complex bind, leading to speculation that PS influences these interactions. Whatever the mechanism, the PS-spectrin interaction increases membrane stability and protects spectrin from glycation.
The β14-β15 spectrin repeats, which form the ankyrin binding site, also bind phosphatidylcholine (PC) and phosphatidylethanolamine (PE). Spectrin-PE/PC binding is inhibited by ankyrin. The importance of this is unclear, though it may partly explain how a normal membrane skeleton can form in red cells lacking ankyrin 498b or band 3. The topic of spectrin-lipid binding was recently reviewed.
Phosphorylation Sites.
Instead of a PH domain, the C-terminal region of erythrocyte (βI, isoform 1) spectrin contains a 52-amino acid extension just beyond the site of self-association that is phosphorylated by a membrane-associated casein kinase-I (see Fig. 15-13 ). There are five serines and one threonine that are phosphorylated in a sequential fashion. In vitro phosphorylation of β spectrin has no effect on spectrin self-association. However, by some unknown mechanism, increased phosphorylation of β spectrin in vivo decreases membrane mechanical stability whereas decreased phosphorylation strengthens the membrane.
Ubiquitination Sites.
α-Spectrin is ubiquitinated at several sites in the C-terminal region. The consequences are uncertain. There is evidence from one group that spectrin contains ubiquitin-conjugating (E2) and ligase (E3) activities, that ankyrin is also ubiqitinatinated, and that ubiquitination favors loss of spectrin from the actin junctional compex, but these observations have not yet been confirmed. The fraction of spectrin molecules that is ubiquitinated in vivo is not clear, and the effect of ubiquitination on the mechanical properties of the intact red cell is not known.
Tryptic Domains.
The tryptic domains of spectrin have important historical, structural, and clinical significance. Gentle proteolysis of spectrin with trypsin generates nine structural domains, each composed of several 106-amino acid repeats. Five tryptic fragments represent most of the α chain and include the αI (80-kD), αII (46-kD), αIII (52-kD), αIV (52-kD), and αV (41-kD) domains; the β chain is digested into four domains, including βI (17-kD), βII (65-kD), βIII (33-kD), and βIV (74-kD). Many of the molecular defects in hereditary elliptocytosis were initially identified as abnormalities in spectrin domain maps after proteolytic digestion (see “Hereditary Elliptocytosis” in Chapter 16 ), and many older articles refer to these domains.
Mutations in Erythroid Spectrin Affect the Integrity of the Red Cell and Lead to Clinical Disease
Defects that impair spectrin self-association are the major cause of hereditary elliptocytosis, and spectrin deficiency is an important cause of hereditary spherocytosis (see “Hereditary Elliptocytosis” and “Hereditary Spherocytosis” in Chapter 16 ).
Actin
The red cell contains β actin, which is the actin subtype found in a wide variety of nonmuscle cells. Whereas red cell actin shares structural and functional similarities with the β actin found in nonerythroid cells, in the membrane skeleton actin is assembled into 30,000 to 40,000 regular protofilaments or short, 33- to 37-nm, double-helical F-actin filaments, each containing about 14 monomers. In contrast to nonerythroid cells, where actin filaments have variable lengths and turnover rapidly, red cell actin protofilaments are a constant size and are extraordinarily stable, persisting for the life of the red cell. They are stabilized by (1) interactions with spectrin, protein 4.1R, and tropomyosin; (2) capping of the pointed or slow-growing end by tropomodulin ; and (3) capping of the barbed or fast-growing end by adducin. This is another unique feature of the actin filaments in red cells because capZ is the ubiquitous barbed-end capping protein in nonerythroid cells. Interestingly, this occurs despite the fact that red cells contain capZ. When α or β adducin is deleted in red cells, capZ expression is greatly upregulated, presumably as a compensatory mechanism.
The actin protofilaments function as junctional centers connected by spectrin in a more or less hexagonal array (see Fig. 15-16 ). The protofilaments lie parallel to the lipid bilayer within 20 degrees of the membrane plane. Spectrin dimers bind to the side of actin filaments at a site near the tail of the spectrin molecule (see Figs. 15-13 and 15-17 ). The contact sites of spectrin on the actin protofilaments are not known, although one can make inferences from the way other spectrin-related proteins bind F-actin (see Fig. 15-17 ). Spectrin tetramers are bivalent and therefore cross-link actin filaments, although binding is weak (kD ~ 10 −3 M) and ineffectual in the absence of protein 4.1R. Spectrin-actin interactions are specifically enhanced by protein 4.1R, adducin, and dematin (see “Protein 4.1R,” “Adducin,” and “Dematin”).
Defects in Actin Assembly.
Not much is known about how the unique actin protofilaments of red cells are assembled, but some hints are emerging from defects in actin assembly. Red cells contain multiple members of the Rho family of guanosine triphosphatases (GTPases), including Rac1, Rac2, Cdc42, and RhoA, RhoG, and RhoH. Rac GTPases are activated by extracellular signals via guanine nucleotide exchange factors, which replace guanosine diphosphate (GDP) with GTP on Rac. GTP-activated Rac then interacts with P21-activated kinase, a diaphanous homologue (DIAPH3), and an assembly of proteins known as the Wiskott-Aldrich syndrome verprolin-homologous protein (WAVE) complex, stimulating ARP2/3 to initiate actin polymerization in many cell types. Erythrocytes probably also utilize this pathway because they contain Rac, RhoA, and all the members of the WAVE complex.
Mice that lack both Rac1 and Rac2 develop a microcytic hemolytic anemia with marked anisocytosis and poikilocytosis. Membrane skeletal junctions are aggregated, and there is pronounced irregularity of the spectrin meshwork. These changes are accompanied by decreased cellular deformability, an increase in the actin-to-spectrin ratio, and increased phosphorylation (Ser724) of adducin, an F-actin capping protein. Actin and phosphorylated adducin are more easily extracted by Triton X-100 from Rac1(−/−)/Rac2(−/−) red cells, indicating weaker association to the cytoskeleton.
Hematopoietic protein-1 (Hem-1) is a hematopoietic cell specific member of the WAVE complex. Mice lacking Hem-1 resemble the Rac1/Rac2 double knockout mice, with a moderate microcytic, hemolytic anemia, marked spherocytosis and poikilocytosis, clumped F-actin filaments, and decreased amounts of all membrane skeletal proteins. They also show increased expression of Ser724 on adducin.
Osteopontin phosphorylates or activates multiple proteins in human erythroblasts, including Rac-1 GTPase and adducin. Osteopontin knockout mice are anemic and also show defects in F-actin filaments.
The results indicate that Rac GTPases regulate the organization of the red cell membrane skeleton. It is unclear whether this occurs dynamically in the mature red cell or just during erythropoiesis.
Malaria.
P. falciparum generates a host-derived actin cytoskeleton within the red cell that appears to be an extension of the normal membrane skeleton. It functions in the transport of vesicles between the parasite and the red cell membrane. This cytoskeleton is abnormal in erythrocytes containing hemoglobins S or C, two hemoglobins that protect against malaria. One possible mechanism is that hemoglobin oxidation products, which are enriched in hemoglobin S and C red cells, inhibit actin polymerization in vitro.
Protein 4.1R
Red cell protein 4.1 (technically the 4.1R paralogue, gene name EPB41 ) is a major component of the erythrocyte membrane skeleton, with roughly 200,000 copies present in each red cell (see Table 15-2 ). Protein 4.1R confers both stability and flexibility to circulating red cells by potentiating the interaction of spectrin tetramers with F-actin and by linking this membrane skeletal scaffold to the plasma membrane through vertical interactions with GPC, band 3, p55, protein 4.2, and perhaps other proteins (see Fig. 15-6 ). In the mature red cell, protein 4.1R exists as a 588-amino acid protein that has a molecular weight of 66 kD, although it runs as an 80-kD protein on SDS gels. Two forms of the protein are resolved on high-resolution SDS gels, an apparently 80-kD protein designated 4.1Ra and an apparently 78-kD protein designated 4.1Rb. Protein 4.1Ra derives from 4.1Rb by progressive deamidation of Asn502 during the life span of the red cell; thus protein 4.1Ra is more prominent in senescent red cells. Proteolysis of protein 4.1R generates four structural domains: the N-terminal 30-kD membrane binding domain (MBD; also called the FERM domain ), a 16-kD linker domain, the 10-kD spectrin-actin–binding domain, and the 22- to 24-kD C-terminal domain ( Fig. 15-18 ).

