Modern radiologic imaging is an aid to treatment planning for localized renal cancer, enabling characterization of mass lesions. For patients who present with advanced renal cancer, new imaging techniques enable a functional assessment of treatment response not possible using anatomic measurements alone. Multidetector CT urography permits simultaneous assessment of the kidneys and urinary tract for patients with unexplained hematuria. Both CT and MRI play a significant role in staging and follow up of patients treated for urothelial cancer. Newer imaging methods such as diffusion-weighted MRI have shown promising results for improving accuracy of staging and follow up of urothelial cancer.
Key points
- •
Cancer of the kidney and urinary tract continue to affect significant numbers of patients, and the incidence of renal cancer is increasing.
- •
New and evolving techniques in radiologic imaging have improved the detection, characterization, staging, and treatment planning of cancer of the kidney and urinary tract.
- •
For reassessment of advanced stage or recurrent kidney and urinary tract cancer after treatment, new, more functional radiologic imaging techniques such as diffusion-weighted magnetic resonance imaging have been shown to be useful.
Cancer of the kidney
Epidemiology of Renal Cancer
More than 80% of renal cancers are adenocarcinomas arising from the renal parenchyma, that is, renal cell carcinoma (RCC). It is difficult to obtain population-based data on the incidence and mortality of RCC, because published population data from different geographic regions combine RCC and cancer of the renal pelvis as 1 group. Thus, in this article, epidemiologic data regarding renal cancer refers to cancers of the renal parenchyma and renal pelvis. It was estimated that 65,150 new cases of cancer of the kidney and renal pelvis would be diagnosed in the United States in 2013. Incidence rates for renal cancer in the United States have been increasing steadily for more than 3 decades, more rapidly for African Americans than whites. In the United States, the annual incidence of renal cancer increased by 2.6% per year between 1997 and 2007. The increased incidence of renal cancer occurred across all age groups, with the greatest increase in patients with localized tumors. The increase in incidence of localized tumors can be attributed to the introduction and widespread use of cross-sectional abdominal imaging, including diagnostic ultrasonography (US), computed tomography (CT), and magnetic resonance imaging (MRI), which allow detection of asymptomatic localized renal tumors. Up to 50% to 60% of renal cancers may be found incidentally in asymptomatic patients on abdominal imaging studies performed for unrelated indications. However, the incidence of more advanced renal cancers in the United States, including those with regional extension or distant metastasis, also increased in all race and sex categories. The global incidence of renal cancer increased from the 1970s until the mid-1990s, then leveled off or decreased in many countries.
New and Expanded Roles for Radiologic Imaging of Renal Cancer
The large number of renal tumors detected on routine survey-type abdominal imaging studies has stimulated further expansion of the role of imaging, because more focused imaging studies are often required to characterize these lesions as benign or malignant. Although as many as 85% of renal lesions believed to warrant surgery for presumed renal cancer are malignant, the number of benign lesions with features on imaging that are indistinguishable from malignancy is not insignificant. In a series of 292 partial nephrectomies for presumed renal neoplasms, 22% of the lesions were benign. Benign histology is more common in small lesions. In a series of 2675 patients treated surgically for renal lesions, the percentage of benign histology for lesions for those with diameter less than 1 cm was 38%.
The task of modern imaging of renal lesions is not only to detect and stage lesions suspicious for cancer but also to provide definitive characterization of these lesions in as many cases as possible, to minimize unnecessary invasive procedures. For lesions believed likely to represent cancer, imaging is used for planning and execution of percutaneous and intraoperative biopsies and ablative procedures as well as for surgical planning. For patients undergoing nonsurgical treatment of unresectable, metastatic, residual, or recurrent renal cancer, radiologic imaging is used for staging to determine extent of disease and subsequently to assess treatment response. In recent years, novel methods have been introduced to determine treatment response beyond simple tumor bidirectional size measurements, using functional parameters.
Radiologic Imaging for Detection, Characterization, and Staging of RCC
Most renal masses are incidentally discovered on medical imaging studies obtained to investigate a large variety of abdominal conditions. Once it has been shown that the morphology of a renal mass is not in keeping with an uncomplicated simple cyst, the presence of vascularity in a renal mass is the most reliable finding to characterize the lesion as a neoplasm.
When a renal mass has been defined as a probable cancer, radiologic imaging is used to stage the tumor. In the 1960s, the Robson classification was developed to stage renal cell cancers. In this system, stage I tumors were confined to the renal capsule; stage II tumors extended to the perirenal fat or ipsilateral adrenal gland; stage III tumors had vascular (A) or nodal (B) extension, or both (C); and stage IV indicated distant disease. This system has been widely replaced with the TNM (tumor, node, metastasis) classification of the International Union Against Cancer (Union International Contre le Cancer [UICC]), which is being used worldwide ( Table 1 ). US, CT, and MRI are the standard imaging modalities used to evaluate renal masses.
| Definition of TNM | |
|---|---|
| Primary Tumor (T) | |
| TX | Primary tumor cannot be assessed |
| T0 | No evidence of primary tumor |
| T1 | Tumor ≤7 cm, limited to kidney |
| T1a | Tumor ≤4 cm, limited to kidney |
| T1b | Tumor 4–7 cm, limited to kidney |
| T2 | Tumor >7 cm, limited to the kidney |
| T2a | Tumor >7 cm but ≤10 cm in greatest dimension |
| T2b | Tumor >10 cm, limited to the kidney |
| T3 | Tumor extends into major veins or perinephric tissues but not into the ipsilateral adrenal gland and not beyond Gerota’s fascia |
| T3a | Tumor grossly extends into the renal vein or its segmental (muscle containing) branches, or tumor invades perirenal and/or renal sinus fat but not beyond Gerota’s fascia |
| T3b | Tumor grossly extends into the vena cava below the diaphragm |
| T3c | Tumor grossly extends into the vena cava above the diaphragm or invades the wall of the vena cava |
| T4 | Tumor invades beyond Gerota’s fascia (Including contiguous extension into the ipsilateral adrenal gland) |
| Regional Lymph Nodes (N) | |
| NX | Regional lymph nodes cannot be assessed |
| N0 | No regional lymph node metastasis |
| N1 | Metastasis in regional lymph node(s) |
| Distant Metastasis (M) | |
| M0 | No distant metastasis |
| M1 | Distant metastasis |
| Anatomic Stage/Prognostic Groups | |||
| Stage I | T1 | N0 | M0 |
| Stage II | T2 | N0 | M0 |
| Stage III | T1 or T2 | N1 | M0 |
| Stage IV | T4 | Any N | M0 |
| Any T | Any N | M1 | |
US
The advantage of renal US is its low cost, wide availability, and lack of ionizing radiation or intravenous (IV) contrast material. In many cases, use of US to define a renal lesion can obviate more costly imaging tests.
For detection of small renal cancers, US lacks the sensitivity of CT. In a study by Jamis-Dow and colleagues, CT and US detection rates for renal lesions measuring 15 to 20 mm at surgical pathology, were, respectively, 100% and 58%; for lesions measuring 20 to 25 mm, 100% and 79%.
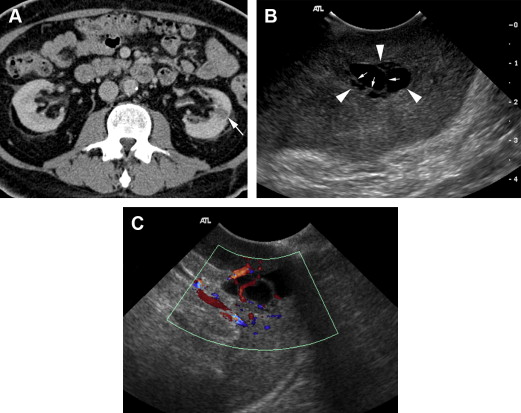
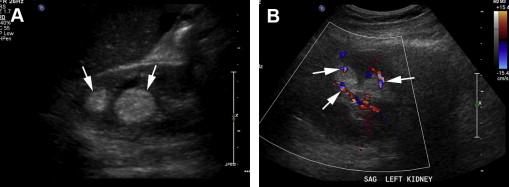
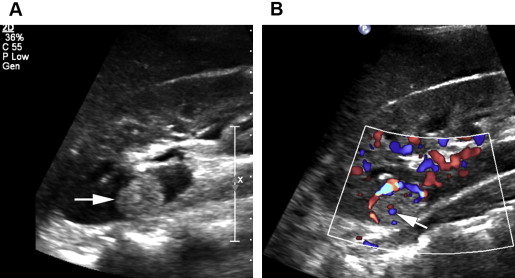
For characterization of renal lesions, US is useful and definitive in many cases, because most space-occupying renal lesions are cysts that are easily characterized with US. US is also useful to detect characteristics in cystic renal lesions that raise suspicion that the lesion represents a neoplasm, including nodularity, thickened septations, and vascularity ( Fig. 1 ). US can distinguish cystic from solid renal lesions. Although contrast-enhanced US would be potentially useful for determining vascularity of renal lesions, it is not approved by the US Food and Drug Administration (FDA) for use in the United States. Echogenicity of solid renal lesions as seen on US is not specific for differentiating benign from malignant lesions, because the echogenicity of RCC is variable. Both RCC and angiomyolipoma (AML), a benign macroscopic fat-containing lesion, can appear hyperechoic ( Figs. 2 and 3 ).
CT
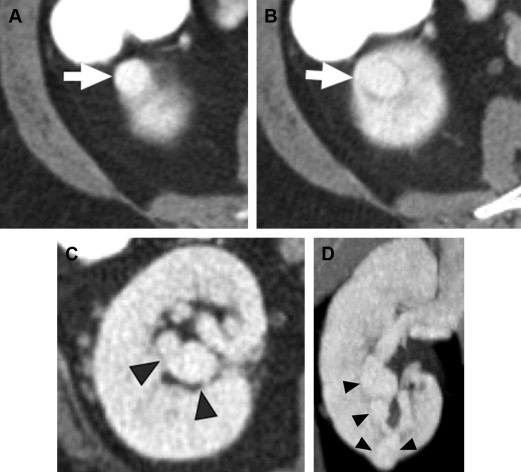
CT is the modality of choice for both detection and characterization of RCC. CT excels in its high spatial resolution and its ability to detect enhancement of a lesion. Newer, multidetector CT (MDCT) scanners, which use ever-increasing numbers of rows of detectors, allow high-quality multiplanar reconstructions of image datasets, with spatial resolution nearly equivalent in all planes ( Fig. 4 ).
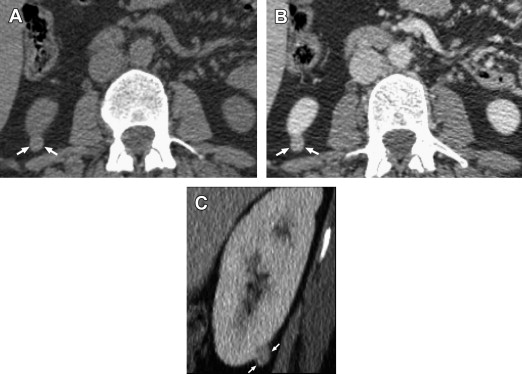
For detection of renal masses measuring 15 mm or larger, CT has excellent sensitivity ( Fig. 5 ). For detection of smaller renal lesions measuring 0 to 5 mm, CT and US detection rates in the study by Jamis-Dow and colleagues were respectively 47% and 0%, and for lesions measuring 5 to 10 mm, 60% and 21%.
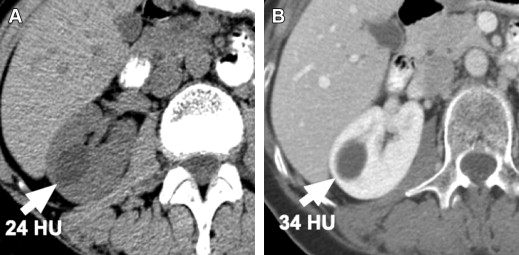
Contrast enhancement of a mass lesion suspected to represent cancer is the most important feature used in radiologic imaging to confirm that the lesion is a neoplasm, because enhancement shows that the lesion has vascularity. Enhancement on CT is defined as an increase in density measured by Hounsfield unit (HU) of at least 15 to 20 HU after IV contrast is given. Before the introduction of helical scanners, thresholds for enhancement were as low as 10 HU, but the phenomenon of pseudoenhancement, which creates an artifactual increase in measured HU density of a lesion after IV contrast is given, has been problematic with helical scanners ( Fig. 6 ). Pseudoenhancement is related to hardening of the radiograph beam (loss of low-energy photons) as it passes through enhancing renal tissue surrounding a small lesion. Increase in HU attenuation number as a result of pseudoenhancement is usually mild; higher HU thresholds for defining enhancement should be used to avoid false-positive interpretation for enhancement.
Although in some instances, a single-phase survey-type IV contrast-enhanced abdominal CT scan shows that a renal mass is obviously enhancing and morphologically in keeping with a renal cancer, in many cases, a dedicated, multiphase CT study obtained before and after IV contrast administration is necessary to determine that there is a significant increase in density after IV contrast, thereby confirming tumor enhancement, and to best define the lesion. Several investigators have presented evidence that the degree of vascularity of a renal tumor as assessed on a multiphase examination has predictive value in differentiating subtypes of renal carcinoma. A dedicated renal mass protocol CT study should include thin (≤3 mm) axial sections before and after IV contrast. Although a multiphase CT study, with more than 1 postcontrast phase ( Table 2 ), provides the most information, a renal mass protocol may be streamlined to minimize radiation dose, by restricting the number of scanning phases to include only those phases necessary to determine that the lesion enhances. For surgical planning studies, additional phases may be added, depending on the information needed.
| Phase | Time After Start of Contrast Injection | Use for Detection of |
|---|---|---|
| Non-enhanced | Before injection | Renal calcifications, baseline density of mass |
| Corticomedullary | 25–80 s | Differentiate bulges of normal variant renal parenchyma from true renal mass |
| Nephrographic | 60–136 s | Parenchymal mass lesions, enhancement of mass |
| Excretory | 3–5 min | Collecting system abnormalities |
CT is the mainstay modality for staging RCC, with a reported overall staging accuracy of up to at least 90%, similar to MRI. Although historically, MRI had the advantage over CT for delineating extent of tumor thrombus, newer multidetector helical CT scanners allow high-quality multiplanar imaging, which may achieve this purpose in more cases than was possible in the past. Limitations in staging accuracy include difficulty in distinguishing perinephric edema from perinephric tumor extension and difficulty in distinguishing enlarged lymph nodes because of reactive inflammation from lymph nodes involved with tumor, because the diagnosis of lymph node involvement with tumor using CT depends only on size criteria. False-positive rates for retroperitoneal nodal involvement have been reported as high as 40% to 50%. False-negative results, reported as approximately 4%, may occur as a result of microscopic involvement of normal-sized nodes.
Limitations of CT
Although CT is of tremendous value for detecting and characterizing renal cancer, disadvantages of CT include its limited ability to characterize small lesions less than 1 cm in diameter, the potentially adverse effects of iodinated IV contrast (including nephrotoxicity and allergic reactions), and the exposure of patients undergoing CT to ionizing radiation.
MRI
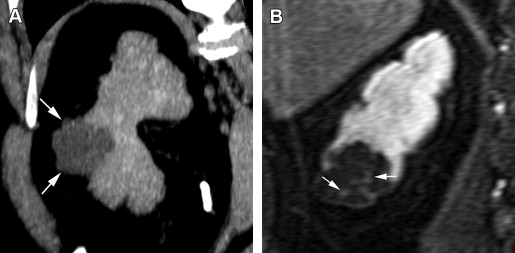
MRI is a robust modality to characterize renal mass lesions, because of its superior tissue contrast. MRI can detect IV gadolinium contrast enhancement with high sensitivity. The ability of MRI to depict morphologic detail of cystic lesions, including nodular enhancing elements, is superior to CT ( Fig. 7 ). MRI is performed on a 1.5-T or 3-T magnet using a phased-array body coil. The standard MRI protocol for renal mass imaging should include T2-weighted sequences, T1-weighted opposed-phase imaging (with in-phase and out-of-phase sequences) for detection of intratumoral fat, and fat-suppressed T1-weighted gradient-echo acquisition before and after administration of IV gadolinium contrast in corticomedullary, nephrographic, and urographic phases of renal enhancement.

