Fig. 4.1
Effects of AdipoR1 CTF344-375 on the activities of ADAM17/TACE. Synthetic peptide Adiponectin Receptor C terminal fragment 32 mer peptide (AdipoR1 CTF344-375) at concentrations of 0–50 μg/mL was incubated with ADAMI7/TACE from 10 to 120 min. The percent activities relative to that of the control sample (0 mg/L CTF1) were plotted
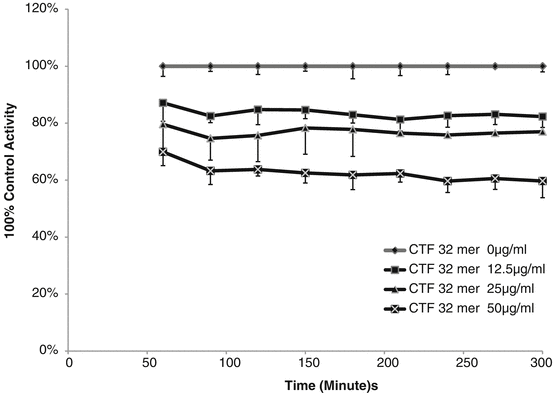
Fig. 4.2
Effects of AdipoR1 CTF344-375 on the activities of IDE. Synthetic peptide Adiponectin Receptor C terminal fragment 32 mer peptide (AdipoR1 CTF344-375) At concentrations of 0–50 μg/mL was incubated with IDE from 60 to 300 min. The percent activities (RFU) relative to that of the control sample (0 mg/L CTF1) were plotted
Table 4.1
Adiponectin Receptor CTF peptide inhibition data
Peptide name | Number of amino acids (mer) | Form | Description | ADAM-17 inhibition (observed) | IDE inhibition (concentration at 90 % inhibition) |
|---|---|---|---|---|---|
AdipoR1 CTF344-375 | 32 | Monomer | R1 clinical form | Positive | 150.0 μg/ml |
AdipoR1 CTF351-375 | 25 | Monomer | R1 soluble portion | Negative | 25.4 μg/ml |
AdipoR1 CTF358-375 | 17 | Monomer | Non inhibitory domain | Negative | Negative |
AdipoR1 CTF367-375 | 9 | Monomer | Tail (end of C terminal) | Negative | Negative |
AdipoR1 CTF344-353 | 10 | Monomer | Non inhibitory domain | Negative | Negative |
AdipoR1 CTF351-362 | 12 | Monomer | Inhibitory domain (active site) | Negative | 20.2 μg/ml |
AdipoR2 CTF344-375 | 32 | Monomer | R1 clinical form | Positive | 140.0 μg/ml |
AdipoR2 CTF351-375 | 25 | Monomer | R1 soluble portion | Negative | 9.0 μg/ml |
AdipoR2 CTF367-375 | 9 | Monomer | Tail (end of C terminal) | Negative | Negative |
AdipoR1 CTF351-375 AdipoR1 CTF351-375 | 25 | Homodimer | R1 CTF25 R1 CTF25 | Negative | 12.5 μg/ml |
AdipoR2 CTF351-375 AdipoR2 CTF351-375 | 25 | Homodimer | R2 CTF25 R2 CTF25 | Negative | 9.0 μg/ml |
AdipoR1 CTF351-375 AdipoR2 CTF351-375 | 25 | Heterodimer | R1 CTF25 R2 CTF25 | Negative | 5.2 μg/ml |
A sharp dose- and time-dependent inhibition of ADAM17/TACE activity was observed with only the full length 32 mer sequences (See AdipoR1 and R2 CTF344-375 in Table 4.1 and Fig. 4.1). Activity resumed and remained at about 50 % after 60 min of incubation. The acute decrease of activity and recovery supported TACE is the possible cleavage protease. The sequence of AdipoR1 and R2 CTF344-375 of Val-Val-Ala-Ala at the cleavage points matches the known cleavage sequence for ADAM17/TACE.
Additional experiments supported that ADAM-17/TACE was the cleavage protease. Western blots of recombinant AdipoR1 (62 kDa from Novus) before and after treatment with TACE (R&D Systems) showed AdipoR1 cleaved into a 27 kDa fragment and a 7 kDa fragment matching a CTF dimer (See on-line supplemental western blot data at www.extras.springer.com/2015/978-3-319-21926-4).
A time-independent inhibition of IDE activity was observed with all sequences of CTF containing AdipoR1 CTF351-362, considered the active inhibitor site (See Table 4.1 and Fig. 4.2). The impact was not reversed with time. The amount of CTF needed for inhibition of 90 % (IC90) of the IDE activity was determined. The soluble 25- and 12-mer peptides were more active inhibitors, with the 12-mer identified as the key inhibitory site.
The homology between the R1 CTF and R2 CTF is very high with key differences only in the last nine peptides of the C terminal. No large inhibitory differences were observed between R1 and R2. R2 was slightly more inhibitory. The dimers for CTF were not stronger inhibitors than monomers. The hetero-dimer of R1-R2 is slightly active than the homo-dimers.
Structural comparison of insulin beta chain and CTF 32 mer was made as both bind IDE. There was no sequence homology between them. Molecular modeling showed structural similarity in the size and orientation of the α helixes (see Fig. 4.3). The inhibitory domain AdipoR1 CTF351-362 is located the in bend between ß sheet located at AdipoR1 CTF344-354 between the α helix located at AdipoR1 CTF356-364 . The interaction point between the sheet and helix is Phe 353 and Arg 361. IDE has multiple insulin cleavage sites at multiple sites for insulin (Duckworth et al. 1998). The inhibitory domain of the CTF inhibitor could association with IDE and block insulin binding.
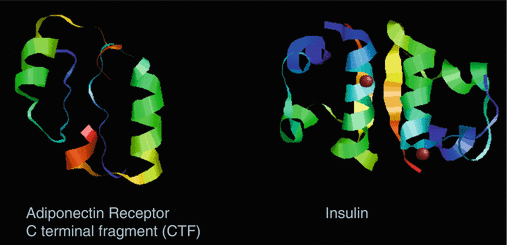
Fig. 4.3
Molecular structure comparison of AdipoR CTF to insulin. I-TASSER structure for CTF 32-mer heterodimer of CTF R1 and CTF R2 is shown. The two cysteines were placed in docked orientation (ZDOCK). The α helixes of AdipoR1 and R2 located at CTF356-364. are shown along with the between ß sheets AdipoR1 and R located at CTF344-354. Insulin ß chain dimer complex of 4-hydroxybenzamine was taken from the protein database (PDB-ID: 2bn3, Resolution 1.40 Å). The α helix of insulin ß chain is from Val-Asn-Gln-His-Leu-Cys-Gly-Ser-His-Leu-Val-Glu-Ala-Leu-Tyr-Leu-Val-Cys-Gly (Images are shown as captured in RasMol viewer)
4.3.2 Tissue Forms and Distribution
Multiple forms of bound CTF found were found in tissue and cell cultures by western blots with monoclonal antibodies to CTF (See Table 4.2 and on-line supplement data for western blots at www.extras.springer.com/2015/978-3-319-21926-4). CTF bound to Ig, Fab2, IgG or IgM immunoglobulin (Ig CTF) was only observed in liver, muscle, and myocyte cell culture. The full receptor was found in fat, muscle and liver tissue samples and not plasma. Lower molecular weight forms of CTF bound to gamma chain or kappa light chain were observed in pancreas and mesenteric fat tissues. TACE and IDE were found in liver, pancreas, muscle and mesenteric fat of normal and diabetic rats. Normal and diabetic rat treated in one exposure with AdipoR1 30 and 32 mer exhibited no changes in tissue forms.
Table 4.2
CTF Immunoglobulin in human tissue and blood
Ig-CTF band (KD) | Observed kDa in Western blots | |||||
|---|---|---|---|---|---|---|
Human plasma | Fat tissue | Liver tissue | Muscle tissue | Pancreas tissue | Myocyte cell culture | |
IgM-CTF | 250 | – | – | 200 | – | 200 |
IgG-CTF | 160 | – | – | – | – | |
Fab2-CTF | 100 | – | 100 | 110 | – | 100–110 |
Ig-CTF | – | 70 | 80 | – | 60 | |
Gamma heavy chain-CTF | 55 | – | 55 | 50 | – | |
AdipoR1 | 37–45 | 43 | 37–45 | – | 47 | |
Light chain CTF | 25 | 25 | 25 | 25 | 25 | – |
Light chain CTF | 22 | 22 | 22 | 22 | 22 | – |
CTF dimer | 7 | – | – | – | – | – |
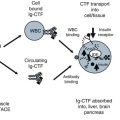
4.3.3 Plasma Forms
All Ig CTF and free CTF forms were observed in plasma (See Table 4.2). Follow up with immuno ctyochemistry (ICC) of human whole blood showed Ig-CTF was freely circulating in plasma As well As on washed white blood cells (WBC) but not red blood cells (RBC) (See on-line supplement for cell and tissue staining procedure at www.extras.springer.com/2015/978-3-319-21926-4). WBC binding to Ig-CTF occurred on some neutrophils with polymorphonuclear pattern, basophils, T cell (CD3 positive by counter staining) and Beta cell lymphocytes (CD 19 positive by counter staining). As the Fc receptor interaction was blocked, the WBC binding was assumed to be through CTF binding or absorption into cells. It was not determined whether CTF was in free form or IgCTF bound form when associated with WBC. Levels of CTF detected were above any expression level of AdipoR1 on WBC surface (Golz et al. 2007). Additional free circulating level TACE and IDE were also found in human blood by westerns blot with some differences noted in molecular weight between normal and diabetic samoles.
Related posts:
 Cardiovascular and Metabolic Syndrome Impact on Uristatin
 C-Terminal Fragment of Adiponectin Receptor Clinical Correlations
 Development of Adiponectin Receptor C-Terminal Fragment Bioassays
 Cell and Biological Models for the C Terminal Fragment of Adiponectin Receptor
 Uristatin Immunoassay Usage in Glomerular Nephritis Assessment
 Impact of Inflammation and Innate Immunity Response in Obesity Mediated Diabetes
Stay updated, free articles. Join our Telegram channel

Full access? Get Clinical Tree


