Physiologic and Biologic Evaluation of Allergic Lung Diseases
Ravi Kalhan
Jane E. Dematte
Allergic and immunologic lung disease can be assessed through a variety of physiologic and biologic measurements. Physiologic measurements include comprehensive pulmonary function testing, such as forced spirometry, measurement of lung volumes, and determination of diffusing capacity. Peak expiratory flow measurement is easy to obtain and may serve as a useful surrogate for complete spirometric evaluation. Bronchoprovocation testing represents a combined physiologic–biologic approach to assessing airway hyperreactivity, and fraction of expired nitric oxide is a biologic test that correlates with the amount of eosinophilic inflammation in the airways. Finally, bronchoalveolar lavage fluid provides a window into the biologic make-up of lung inflammatory cells and can be used in the diagnosis of hypersensitivity pneumonitis and eosinophilic pneumonia.
Spirometry
Essential Components of Forced Spirometry
Forced spirometry is an important component of pulmonary function testing and the key component of the physiologic assessment of obstructive airways diseases. The American Thoracic Society (ATS)/European Respiratory Society (ERS) task force on the Standardization of Lung Function Testing assert several indications for spirometry including diagnosis and monitoring of diseases that affect lung function and determining prognosis or response to therapeutic interventions in those diseases (1). A forced spirometry contains the following components:
The forced vital capacity (FVC) is the maximum amount of air exhaled with a maximal forced effort from total lung capacity (TLC).
The forced expiratory volume in 1 second (FEV1) is the maximal volume of air exhaled in the first second of the FVC maneuver.
The mean forced expiratory flow between 25% and 75% of the FVC (FEF25-75%), also termed the maximum mid-expiratory flow (MMEF), provides a measurement of expiratory flow during the middle phase of the FVC maneuver and provides a measure of small airways obstruction albeit an inconsistent and nonspecific one in individual patients (1,2).
With worsening obstructive airways disease, airflow at low lung volumes can become very slow, and it may be difficult for older patients, or those with severe airflow obstruction, to sustain a complete FVC maneuver. Some experts have therefore advocated the use of the forced expiratory volume in 6 second (FEV6), the volume of air exhaled in the first 6 seconds of the FVC maneuver, as a substitute for FVC (3,4). The FEV1/FVC ratio (or FEV1/FEV6 ratio) can be calculated from the above data and, when low, serves as one of the defining features of obstructive airways disease. A flow-volume loop is also constructed as a part of forced spirometry and when analyzed visually can reinforce the presence of airflow obstruction, provide an early indication of airflow obstruction when the FEV1/FVC ratio is not yet reduced, and provide information regarding extrathoracic (upper airway) obstruction.
The peak expiratory flow (PEF) is the maximum expiratory flow achieved from a forced expiration starting, without hesitation, from TLC. Reversibility testing can be obtained as a part of forced spirometry by repeat testing after administration of a bronchodilator. Patients are considered to have reversible airflow obstruction when, following the administration of a bronchodilator, the FEV1 and/or FVC increases by more than 12% and 200 mL in a single testing session. Repeat spirometry should be performed 10 minutes to 15 minutes after
administration of a short-acting beta-agonist or 30 minutes after administration of a short-acting anticholinergic (2). Increases of less than 8% in FEV1 or FVC are likely related to normal variability of the test and do not represent significant responses to a bronchodilator (5).
administration of a short-acting beta-agonist or 30 minutes after administration of a short-acting anticholinergic (2). Increases of less than 8% in FEV1 or FVC are likely related to normal variability of the test and do not represent significant responses to a bronchodilator (5).
The FVC maneuver has three phases: maximal inspiration to TLC from relaxed breathing, a forced exhalation, and continued complete exhalation until the end of the test. Because false reductions in FEV1 and PEF have been observed when the maximal inspiration is slow or there is a prolonged pause at TLC (6), the initial inspiration should be fast and pauses at TLC minimized. For an accurate FVC maneuver, specific criteria for the end of the test are essential. The volume-time curve should show no change in volume for 1 second or greater, and the patient should have tried to exhale for 3 seconds or longer if younger than 10 years old or 6 seconds or longer if 10 years or older (7). In summary, an adequate FVC maneuver must have a maximum inspiration, a rapid start followed by a smooth continuous exhalation, and maximal effort until the volume-time curve reaches a plateau. Idealized flow-volume loops and volume-time curves are shown in Fig. 9.1.
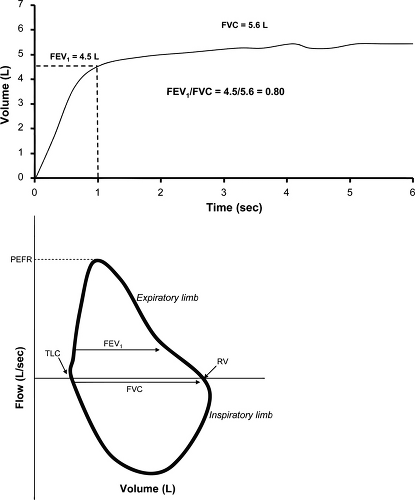 Figure 9.1 Stereotypical volume-time curve (top) and flow-volume loop (bottom) in a normal subject. In the volume-time curve, approximately 80% of volume is expired in the first second resulting in a normal FEV1/FVC ratio of 0.80. The quality of the maneuver is documented by a volume-plateau at the termination of the test after 6 seconds. After inspiration to total lung capacity (TLC), the expiratory limb of the flow-volume loop has a sharp increase in peak expiratory flow rate (PEFR) and then a smooth deceleration in flow over the entire expiration until complete at residual volume (RV). |
Spirometry in Asthma
The Expert Panel Report 3 of the National Asthma Education and Prevention Program (NAEPP) of the
National Heart, Lung, and Blood Institute recommends the use of forced spirometry in asthma at the following four time periods (3):
National Heart, Lung, and Blood Institute recommends the use of forced spirometry in asthma at the following four time periods (3):
When the diagnosis of asthma is being considered
At the time of initial assessment
After treatment is initiated and symptoms have stabilized to document attainment of normal or near-normal airway function
At least every year to 2 years to assess the maintenance of airway function
While clinical symptoms are important factors in diagnosing asthma, symptoms often do not correlate well with lung function in either adults or children (8–11) creating a well-documented disconnect between severity of asthma symptoms and severity of airflow obstruction (12). The NAEPP further recommends that forced spirometry should be followed over the patient’s lifetime to detect the possible rate in decline in lung function over time (3).
Airway obstruction that is spontaneously reversible or reversible with medical intervention on forced spirometry is a principle clinical feature of asthma (3). The ATS/ERS task force defines an obstructive ventilatory defect as occurring when there is a disproportionate reduction of maximum airflow relative to maximum volume (i.e., FVC) that can be displaced from the lung (2). Obstructive defects are identified on spirometry by a reduction in the FEV1/FVC ratio. The National Health and Nutrition Examination survey (NHANES III) derived reference equations (13) provide ethnically appropriate predicted values for the FEV1/FVC ratio and other spirometric parameters. The ATS/ERS task force suggests that obstruction is present when an individual’s FEV1/FVC ratio is below the fifth percentile of the predicted value or alternatively when it is less than the lower limit of normal (LLN) based on the reference equations (2). While in small airways obstruction the FEF25-75% can be reduced as well, and often this occurs earlier in disease than a decrease in the FEV1, abnormalities in MMEF are not specific for small airways disease and should not be used to identify airflow obstruction (2).
After identifying the presence of an obstructive defect in patients in whom there is clinical suspicion of asthma, assessment of bronchodilator responsiveness is appropriate. The Global Initiative for Asthma Global Strategy for Asthma Management and Prevention notes that asthma is a variable disease characterized by daily, monthly, or seasonal variation in symptoms and lung function (14). The variability that is an essential feature of asthma results in a variable response in an individual patient to bronchodilator testing. An individual patient is unlikely to exhibit bronchodilator responsiveness every time he or she is tested, particularly if the disease is well-controlled (14). Repeated testing at different times, therefore, is important to confirm the diagnosis of asthma as well as assess asthma control (3,14).
After an FEV1/FVC ratio less than the LLN is detected by spirometry, the ATS/ERS task force recommends that the severity of airflow obstruction be assessed by the magnitude of reduction in the FEV1.
Mild obstruction—FEV1 >70% predicted, but below LLN
Moderate obstruction—FEV1 60% to 69% predicted
Moderately severe obstruction—FEV1 50% to 59% predicted
Severe obstruction—FEV1 35% to 49% predicted
Very severe obstruction—FEV1 < 35% predicted
Obstructive ventilatory defects are visually detected by a delayed plateau on the volume-time curve as well as “scooping,” “coving,” or upward concavity to the shape of the expiratory limb of a flow-volume curve (Fig. 9.2). The inspiratory limb of the flow-volume loop is normal in asthma. If the inspiratory limb is flattened, extrathoracic causes of airflow obstruction should be considered. Vocal cord dysfunction (VCD) can clinically mimic asthma and has been reported to be concomitant with asthma in many patients (15). When asthma symptoms persist despite therapy, a flattening of the inspiratory limb of the flow-loop, termed variable extrathoracic obstruction, can prove useful in raising suspicion of VCD as an etiology of persistent symptoms.
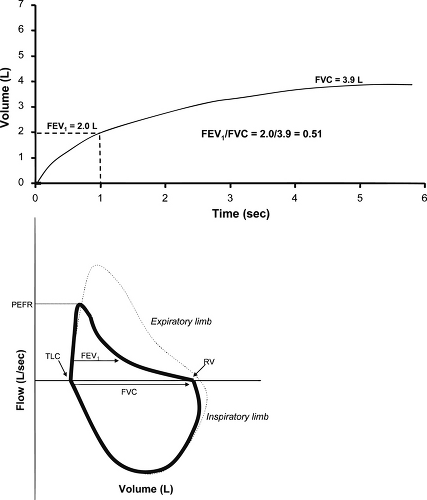 Figure 9.2 Volume-time curve (top) and flow-volume loop (bottom) in obstructive airways disease such as asthma. On the volume time curve, note that only approximately 50% of volume is expired in the first second resulting in a decreased FEV1/FVC ratio of 0.51. In addition, the plateau of expired volume is delayed and not achieved until later in the expiratory compared with the example in Figure 9.1, but a plateau is still achieved at 6 seconds indicating a test of adequate quality. The flow-volume loop shows a decreased PEFR compared to normal (dashed curve) and the expiratory curve demonstrates the characteristic concave upward (or “scooped”) appearance reflecting decreased expiratory flow throughout the maneuver. |
The NAEPP recommends periodic spirometry in addition to assessing symptoms (3) as individuals with low FEV1 represent a group at high risk for acute asthma exacerbations (16). The frequency of performing spirometry in an individual patient depends on whether he or she does not perceive symptoms until airflow obstruction is severe. Unfortunately, there is no good means for detecting these “poor perceivers” (3). It has been documented that in asthma patients, there is little correlation between FEV1 and self-perception of severity of airflow obstruction (17). This inability to perceive severity of airflow obstruction among some patients, coupled with the fact that many patients with near-fatal asthma are in fact “poor perceivers” (18) makes regular spirometry testing an important aspect of disease monitoring.
Spirometry in Hypersensivity Pneumonitis
In its stereotypical acute form, hypersensitivity pneumonitis (HP) manifests as a restrictive ventilatory defect on pulmonary function testing. When forced spirometry is performed, restrictive defects are characterized by the presence of a normal or increased (>85%) FEV1/FVC ratio and a diminished FVC (2). In the setting of restrictive lung disease, the flow-volume loop is often narrowed and the expiratory limb has a convex upward shape (2). This spirometric pattern
lacks specificity for restrictive lung disease and can be associated with poor patient effort on the forced spirometry. A low FVC, therefore, cannot be deemed diagnostic for a restrictive ventilatory defect and measurement of lung volumes and diffusing capacity is required. A diminished FVC carries a positive predictive value for an actual restrictive ventilatory defect of only 41% (19). The negative predictive value for an FVC in excluding a restrictive defect, however, is 97.5% (19). Therefore, forced spirometry may serve as a useful screening tool to exclude restrictive lung diseases such as acute HP; the spirometry of subacute and chronic HP is generally a mixed obstructive and restrictive pattern (Chapter 23).
lacks specificity for restrictive lung disease and can be associated with poor patient effort on the forced spirometry. A low FVC, therefore, cannot be deemed diagnostic for a restrictive ventilatory defect and measurement of lung volumes and diffusing capacity is required. A diminished FVC carries a positive predictive value for an actual restrictive ventilatory defect of only 41% (19). The negative predictive value for an FVC in excluding a restrictive defect, however, is 97.5% (19). Therefore, forced spirometry may serve as a useful screening tool to exclude restrictive lung diseases such as acute HP; the spirometry of subacute and chronic HP is generally a mixed obstructive and restrictive pattern (Chapter 23).
Full Pulmonary Function Testing
Essential Components of Full Pulmonary Function Testing
Full pulmonary function tests (PFTs) comprise measurement of absolute lung volumes and diffusing capacity in addition to forced spirometry. Absolute lung volumes include: Residual Volume (RV), the volume of gas that remains in the lung after a complete expiration; Functional Residual Capacity (FRC), the volume of gas remaining in the lung after exhaling a normal tidal breath; and Total Lung Capacity (TLC), the maximal
amount of gas in the lung after maximal inspiration (Fig. 9.3). Lung volumes are typically measured by plethysmographic, helium gas dilution or nitrogen washout methods. Body plethsymography is considered the optimal method as both ventilated and nonventilated lung volumes are measured. A discussion of the methodology used to measure lung volumes is beyond the scope of this chapter but was recently published by the ATS/ERS task force (20).
amount of gas in the lung after maximal inspiration (Fig. 9.3). Lung volumes are typically measured by plethysmographic, helium gas dilution or nitrogen washout methods. Body plethsymography is considered the optimal method as both ventilated and nonventilated lung volumes are measured. A discussion of the methodology used to measure lung volumes is beyond the scope of this chapter but was recently published by the ATS/ERS task force (20).
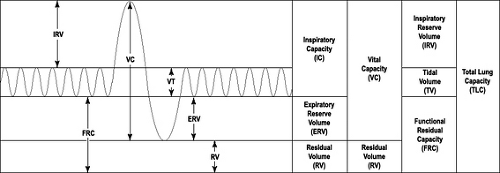 Figure 9.3 Residual Volume (RV): the volume of gas that remains in the lung after a complete expiration; Functional Residual Capacity (FRC): the volume of gas remaining in the lung after exhaling a normal tidal breath; Total Lung Capacity (TLC): the maximal amount of gas in the lung after maximal inspiration; Inspiratory Capacity (IC): the difference between TLC and FRC; Expiratory Reserve Volume (ERV): the difference between FRC and RV. |
Measurement of lung volumes is required for the definitive diagnosis of a restrictive ventilatory impairment, defined as a reduction of the TLC below the fifth percentile of the predicted value (2). While reductions in vital capacity (VC) are sometimes interpreted as indicating restriction, VC is poorly predictive of an associated reduction in TLC (19, 21). A restrictive pattern on PFTs suggests the presence of parenchymal lung disease wherein there is concentric reduction in all volumes, the TLC, FRC, RV, and VC. Measurement of lung volumes is also required to establish a mixed obstructive and restrictive impairment. Severity of the impairment is based on the degree of reduction in the TLC as set forth by the ATS in 1991 (22).
Mild restriction—TLC >70% predicted <LLN
Moderate restriction—TLC 60% to 69% predicted
Moderately severe restriction—TLC 50% to 59% predicted
Severe restriction—TLC 34% to 49% predicted
Very severe restriction—TLC <34% predicted
A significant drawback to lung volume testing is the lack of robust reference standards. The studies from which lung volume reference values were derived are obsolete, lack standardized and detailed description of measurement technique, included asymptomatic smokers, had small sample sizes, and were Caucasian-based and cannot be directly applied to other ethnic groups (23


Related posts:

Stay updated, free articles. Join our Telegram channel
Full access? Get Clinical Tree
