Pathophysiology and Treatment of Dyslipidemia in Diabetes
Sherita Hill Golden
Miguel Munoz
Atherosclerosis is the leading cause of death among individuals with diabetes, accounting for 80% of all mortality. Approximately 75% of deaths result from coronary atherosclerosis and 25% from cerebral or peripheral arterial disease. Greater than 75% of hospitalizations for diabetic complications are due to atherosclerosis (1). Mortality rates for ischemic heart disease are two- to fourfold greater for individuals with diabetes compared to those without diabetes (2). The decision to make diabetes a coronary heart disease (CHD) risk equivalent is supported by a landmark study by Haffner et al. in 1998 (3), which showed that patients with diabetes who had never experienced a myocardial infarction (MI) had a comparable risk of cardiovascular disease (CVD) mortality as individuals without diabetes who had already experienced an MI. This study formed the basis for more aggressive treatment of CVD risk factors, particularly dyslipidemia, in individuals with diabetes. In this chapter, we review the pathophysiology of diabetic dyslipidemia as it relates to insulin resistance, the results of lipid-lowering trials of prevention of CVD in diabetes, and current treatment guidelines for diabetic dyslipidemia.
THEORETICAL CONSIDERATIONS
Historically, diabetes has been considered a disorder primarily related to abnormal glucose metabolism. More recently, it has been appreciated that obesity, or the products of excess adipose tissue, often precede the abnormalities of glucose metabolism (4). In particular, elevated plasma free (nonesterified) fatty acids (FFA) play a paramount role in the development of type 2 diabetes by causing insulin resistance. Indeed, insulin resistance can be caused even if the FFA are elevated for more than a few hours. In starvation or the second half of pregnancy, for example, such induction of insulin resistance by FFA can be beneficial for preserving carbohydrate for use by the brain and other vital tissues. In contrast, in periods of excess energy, induction of insulin resistance by FFA is not desirable, eventually leading to elevated glucose levels when the secretion of insulin by the pancreas is insufficient to compensate for the insulin resistance (4).
Role of FFA in the Pathogenesis of Insulin Resistance, Diabetes, and Dyslipidemia
A number of tissues plays a paramount role in the pathophysiology of diabetic dyslipidemia. These include adipose tissue, liver, skeletal muscle, pancreas, and intestine. Each of these will be considered separately in this chapter along with their interrelationships.
Metabolism of Triglycerides in Adipocytes
In the normal postprandial state, FFA are delivered to the adipocyte following the hydrolysis of triglycerides (TG) by lipoprotein lipase (LPL) in the TG-rich lipoproteins (TRL) at the surface of endothelial cells (5) (Fig. 10.1). After crossing the endothelial cells and entering the adipocyte, the FFA are activated and incorporated into TG, a process referred to as “fatty acid trapping.” The final step in this process is the addition of a fatty acid CoA to diacylglycerol (DAG) through the action of diacylglycerol acyltransferase (DGAT) (Fig. 10.1). Insulin plays an important role in this process since it increases LPL activity as well as stimulates the formation of TG (Fig. 10.1). The acylation-stimulating protein (ASP) also stimulates the incorporation of FFA into TG in adipocytes, an effect that is independent and additive of that of insulin (see also Chapter 8) (6). The interaction of insulin with its receptor also normally inhibits the activity of hormone-sensitive lipase (HSL) in the postprandial state, decreasing the efflux of FFA from the adipocyte (Fig. 10.1). In contrast, catecholamines upregulate HSL, thereby increasing the release of FFA from the adipocyte (Fig. 10.1). When the adipocyte is resistant to the effect of insulin, there is decrease in both fatty acid trapping and the inhibition of HSL by insulin. Both of these pathologic effects of insulin resistance will increase the flux of FFA to liver and muscle (Fig. 10.1) (see following text).
Molecules That Decrease the Flux of FFA from Adipose Tissue to Liver and Muscle. An inhibitory G protein-coupled receptor, GPR109A, on adipocytes also suppresses the release of FFA by HSL (5) (Fig. 10.1). Both β-hydroxybutyrate and niacin are ligands for GPR109A that may initiate the inhibitory G-protein signal that decreases cAMP via adenyl cyclase, leading to reduced PKA activation and lower HSL activity (5) (Fig. 10.1). The AMP-activated protein kinase (AMPK) system also normally suppresses activation of HSL (5) (Fig. 10.1). AMPK appears to facilitate a balance between the amount of FFA released from TG by HSL, and that released from the cell or, alternatively, oxidized. Otherwise, excess FFA in adipocytes will be recycled back into TG, a process that requires ATP. Adiponectin activates AMPK-increasing oxidation of FFA and insulin sensitivity (5) (Fig. 10.1). Peroxisome proliferator-activated receptor (PPAR)-α agonists, such as fibrates, increase plasma adiponectin in patients with CVD, dyslipidemia, and insulin resistance, an effect that is proportional to the improvements in TG and high-density lipoprotein cholesterol (HDL-C) (5). PPAR-α can be expressed in adipose tissue where it upregulates genes oxidation of FFA. Agonists of PPAR-γ, such as thiazolidinediones (TZDs) also increase adiponectin in diabetic individuals
leading to improvement of insulin sensitivity and dyslipidemia. It has been pointed out that the metabolic improvements seen with PPAR-γ agonists are similar to those observed with rimonabant, an inhibitor of the endocannabinoid receptor, suggesting cross talk between the endocannabinoid system and PPAR-γ (5) (see also Chapter 24).
leading to improvement of insulin sensitivity and dyslipidemia. It has been pointed out that the metabolic improvements seen with PPAR-γ agonists are similar to those observed with rimonabant, an inhibitor of the endocannabinoid receptor, suggesting cross talk between the endocannabinoid system and PPAR-γ (5) (see also Chapter 24).
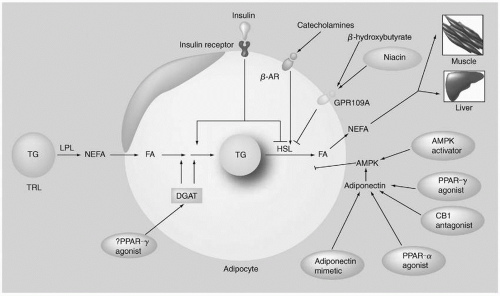 FIGURE 10.1 Metabolism of TG in adipocytes. In the postprandial state, FFA are delivered to adipocytes following the hydrolysis of TG by LPL. After crossing the endothelial cells and entering the adipocyte, the FFA are activated and incorporated into TG, a process referred to as “fatty acid trapping.” The final step in this process is the addition of a fatty acid CoA to diacylglycerol through the action of DGAT. Insulin both increases LPL activity and stimulates the formation of TG. The interaction of insulin with its receptor (IR) normally inhibits the activity of HSL in the postprandial state, decreasing the efflux of FFA from the adipocyte. In contrast, catecholamines upregulate HSL, thereby increasing the release of FFA from the adipocyte. When the adipocyte is resistant to the effect of insulin, there is a decrease in both FFA trapping and the inhibition of HSL by insulin, increasing the flux of FFA to liver and muscle. In contrast, the inhibitory G protein-coupled receptor, GPR109A, on adipocytes suppresses the release of FFA by HSL. Both β-hydroxybutyrate and niacin are ligands for GPR109A that may initiate the inhibitory G-protein signal that decreases cAMP via adenyl cyclase, leading to reduced PKA activation and lower HSL activity. The AMPK system also normally suppresses activation of HSL. Adiponectin activates AMPK by increasing FFA oxidation and insulin sensitivity. FFA, free fatty acids; TG, triglycerides; LPL, lipoprotein lipase; DGAT, diacylglycerol acyltransferase; NEFA, non-esterified fatty acids; PPAR gamma, Peroxisome Proliferator-Activated Receptor-gamma; TRL, triglyceride-rich lipoproteins; beta-AR, beta adrenergic receptor. HSL, hormone-sensitive lipase; AMPK, AMP-activated protein kinase. (Reproduced from Toh S-A, Rader DJ. Dyslipidemia in insulin resistance: clinical challenges and adipocentric therapeutic frontiers. Expert Rev Cardiovascular Ther. 2008;6:1007-1022, with permission.) (see color insert.) |
Initiation of Insulin Resistance in Adipocytes. The initiation of insulin resistance in the adipocyte is an area of intense investigation (5,6). Excessive caloric intake leads to adipocyte hypertrophy and increases visceral adipose tissue. Adipose tissue is an endocrine organ that secretes many cytokines and adipokines. Proinflammatory cytokines include tumor necrosis factor (TNF)-α, interleukin (IL)-1, -4, and -6, monocyte chemotactic protein (MCP)-1, interferon (IFN)-γ, and nitric oxide synthase (NOS)-1 (5). These cytokines can promote inflammation, insulin resistance, and dyslipidemia. Increased secretion of the chemotactic molecule MCP-1 by adipocytes recruits monocytes/macrophages into adipose tissue. MCP-1 is also known as the C-C motif chemokine ligand (CCL)-2 that binds to the C-C chemokine receptor (CCR) (5). CCL-2 is highly expressed in obese subjects and its interaction with CCR appears to promote insulin resistance. Further, proinflammatory cytokines such as IFN-γ influence the macrophage to express a proinflammatory profile (macrophage M1) (5,6). Conversely, adipocytes that are smaller and not hypertrophied secrete increased amounts of adiponectin that helps prevent insulin resistance, inflammation, and dyslipidemia (5). Under this last scenario, macrophages are not proinflammatory (macrophage M2) (5,6) and secrete antiinflammatory molecules such as IL-10 (5).
Metabolism of TG in Hepatocytes
In the liver FFA are normally activated (fatty acid CoA) and then oxidized or incorporated into TG or cholesteryl esters. When the increased flux of FFA to the liver from insulin-resistant adipocytes exceeds the ability of the oxidative or storage pathways to metabolize fatty acid CoA, intermediates of fatty acid metabolism such as DAG, PA, LPA, and ceramide (see also Chapter 4) accumulate and can activate a number of different serine kinases that negatively regulate insulin action (6).
Apolipoprotein B-100 (apoB-100) is constitutively made in the liver. Only some of the apoB-100 molecules that are made survive and become incorporated into very low density lipoprotein (VLDL); the remainder are degraded by proteolytic enzymes. As apoB-100 interacts with cholesteryl esters, it likely assumes a new conformation leading to decreased degradation of apoB and thus to its increased production. TG is then incorporated into this complex through the action of microsomal triglyceride transfer protein (MTP), producing VLDL. Insulin normally decreases cholesterol synthesis and thereby inhibits apoB secretion, effects that are opposite to those seen in most patients with diabetes and insulin resistance who manifest increased hepatic synthesis of cholesterol, apoB-100, TG, and VLDL. Enhanced secretion of VLDL leads to increased production of small, dense LDL particles and low HDL-C (7) (see Fig. 1.7, page 17) (see also the following text).
Implications of Insulin Resistance for Glucose Production in Liver. The main function of insulin in the liver is the control of endogenous glucose production (EGP), which is the sum of gluconeogenesis (GNG) (the formation of glucose from nonglucose precursors), and glycogenolysis (GL) (the formation of glucose from the hydrolysis of glycogen) (8). In normals, insulin sharply reduces GL, modestly decreases GNG, and thereby lowers EGP. FFA produce insulin resistance in liver by inhibiting the acute insulin suppression of GL, resulting in increased EGP that contributes to hyperglycemia.
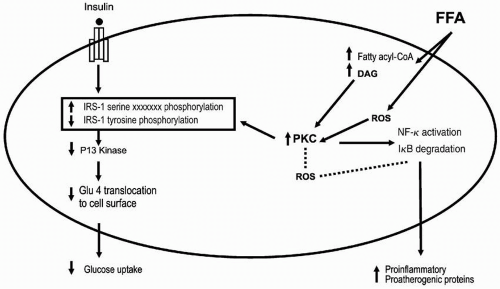 FIGURE 10.2 Potential mechanisms of free fatty acids (FFA) on insulin resistance in human muscle. An increase in plasma FFA is followed by an increased uptake of FFAs. An intramyocellular accumulation of fatty acyl-CoA and DAG activates several isoforms of PKC. Activation of PKC appears to interrupt insulin signaling by serine phosphorylation of IRS-1, resulting in decreased tyrosine phosphorylation of IRS-1. Activation of PKC also leads to production of proatherogenic and inflammatory proteins by the activation of the IκB-α/NF-κB pathway. The broken lines indicate that activation of PKC by ROS and activation of the IκB-α/NF-κB pathway by ROS has not been proven in human muscle but has been shown in bovine aortic smooth muscle and endothelial cells. PI, phosphatidyl inositol. DAG, diacylglycerol; PKC, phosphokinase C; IRS-1, insulin receptor substrate-1; ROS, reactive oxygen species. (Reproduced from Boden G, Laakso M. Lipids and glucose in type 2 diabetes. Diabetes Care. 2004;27: 2253-2259, with permission.) |
Metabolism of TG in Myocytes
The myocytes in skeletal muscle are responsible for most of the insulin-stimulated glucose uptake. In the face of increased flux of FFAs to the myocytes, FFAs are activated and incorporated into DAG, which then forms long-chain acyl-CoA (LCCoA). LCCoA activates protein kinase C (PKC) that interrupts insulin signaling by increasing serine phosphorylation and decreasing tyrosine phosphorylation of the insulin receptor substrate-1 (IRS-1) (4) (Fig. 10.2). Serine phosphorylation can lead to the degradation of IRS-1. This sequence of events decreases the binding and activation of phosphatidylinositol (PI)-3-kinase to IRS-1, leading to reduced transport of GLUT4 to the cell surface and decreased glucose uptake (4). As a result, the cells become resistant to insulin-stimulated glucose transport (Fig. 10.2). Thus, it is not the accumulation of TG per se that causes insulin resistance but rather the effect of other molecules such as DAG that initiate a cascade of effects that lead to insulin resistance.
An increase of DAG levels in the myocytes can also promote the activation of the nuclear factor (NF)-κB pathway (4) (Fig. 10.2). NF-κB is involved in the pathogenesis of atherosclerosis (4) and may contribute to the increase of CVD in diabetic individuals. FFAs can also cause insulin resistance by increasing oxidative stress (4). Reactive oxygen species can activate PKC and the NF-κB pathway (Fig. 10.2).
Metabolism of TG in Pancreatic Cells
The effect of FFA in the pancreas has provided some insight into why some obese, insulin-resistant patients develop diabetes and others do not, despite the fact that FFA are promoting insulin resistance in liver and muscle in both groups. FFA are known potent insulin secretagogues, and in obese patients with normal pancreatic B cells, FFA compensate for the insulin resistance that they produce (4). Conversely, in patients genetically predisposed to develop diabetes (such as first-degree relatives of type 2 diabetic individuals), FFA are unable to compensate sufficiently by producing enough insulin to counterbalance the insulin resistance that they produce (4). This genetic predisposition to pancreatic B cell failure involves a defect in the stimulation of the secretion of insulin by both FFA and glucose.
Metabolism of TG in Intestinal Cells
It is well known that excessive postprandial lipemia is quite prevalent in obese, insulin-resistant patients and type 2 diabetes. Postprandial dyslipidemia is characterized by hypertriglyceridemia due to the presence of intestinally derived chylomicrons and chylomicron remnants and hepatic-derived VLDL and VLDL remnants (9) (see also Chapter 7). When they are small enough, both chylomicron and VLDL remnants can enter the vascular wall and promote atherosclerosis by virtue of their cholesterol moiety. Increased small, dense LDL particles and a low HDL are also often part of the postprandial dyslipidemia. This dyslipidemia is due in no small part to the anabolic and catabolic abnormalities of lipid metabolism that accompany insulin resistance, namely increased hepatic production of apoB-100-containing VLDL and decreased activity of LPL and increased expression of apolipoprotein C-III (apoC-III), an inhibitor of LPL (5) (see also the preceding text).
In insulin resistance, however, there is also overproduction of intestinal apoB-48-containing chylomicrons (10) (see also Chapter 7). Intestinal lipoprotein production can be stimulated by elevation of FFA that occurs in insulin resistance. Enhanced intestinal fat absorption also occurs through upregulation of CD36/fatty acid translocase (FAT). Both of these states promote the formation of fatty acid CoA, DAG, and TG. TG decrease the proteolysis of apoB-48, leading to enhanced biosynthesis of chylomicrons by MTP and increased secretion (9). Finally, of the panoply of intestinally derived peptides, two, glucagon-like peptide-1 (GLP-1) and glucagon-like peptide-2 (GLP-2), appear to be important regulators of intestinal lipid absorption and lipoprotein production (10). Further details concerning the processing of dietary lipids can be found in two reviews (10,11).
Gene Variants, Insulin Resistance, and Dyslipidemia
Both genetic and environmental factors influence the development of insulin resistance and dyslipidemia. As outlined above (see also Figs. 1.7, 10.1, and 10.2), there are a panoply of proteins, whose expression and function might be altered by gene variants (i.e., polymorphisms or mutations). A detailed discussion of all these variants is beyond the scope of this chapter, and the reader is referred to a more comprehensive review (12). Rather some selected variants will be discussed as examples of gene variants that primarily affect insulin action or dyslipidemia (13).
Gene Variants Primarily Regulating Insulin Action
PC-1. PC-1 is a class II transmembrane glycoprotein that inhibits insulin receptor (IR) tyrosine kinase activity (11). The K121Q polymorphism in exon 4 of the PC-1 gene is associated with hyperglycemia and insulin resistance in most but not all studies. Little information is available on the effect of this polymorphism on dyslipidemia (13).
IRS-1. IRS-1 (see above) is a major substrate for the IR (Fig. 10.2). It regulates insulin signaling in adipose tissue (Fig. 10.1), skeletal muscle (Fig. 10.2), and the vasculature (13). A common variant in the IRS-1 gene is the Gly972Arg substitution that causes a decrease in the normal binding and activation of PI-3-kinase to IRS-1 (Fig. 10.2). Carriers of this variant have insulin resistance and dyslipidemia. Their blood pressure is also elevated. Obesity accentuates these abnormalities, a convergence that suggests the presence of the metabolic syndrome (13).
PPAR-γ2. PPAR-γ2 is expressed in adipose tissue and regulates glucose homeostasis and body weight. Rare loss-of-function mutations result in lipodystrophy while rare gain-of-function mutations increase body fat mass (13). A more common polymorphism in the PPAR-γ gene, a Pro12Ala substitution, is significantly associated with lower body mass index, greater insulin sensitivity, higher HDL-C, and lower levels of TG (13). In contrast, the Pro12Pro genotype increases susceptibility to type 2 diabetes. Of interest, the Pro12Pro genotype interacts with the K121Q genotype of PC-1 (see also the preceding), producing higher fasting blood glucose levels and greater insulin resistance than those who were carriers of Pro12Pro and K121K (13).
These genetic studies further emphasize the pharmacologic importance of PPAR-γ and PPAR-α in the dyslipidemia associated with diabetes (see also the following text). Fibric acid derivatives are agonists of PPAR-α in the liver and decrease TG by upregulating LPL and downregulating apoC-III, an inhibitor of LPL. HDL-C levels also increase (see also the following text). The TZDs are agonists of PPAR-γ and improve insulin sensitivity and provide a modest improvement in the dyslipidemia of diabetes (see also the following text).
Gene Variants Primarily Regulating Dyslipidemia
Hepatic Lipase. Hepatic lipase (HL) plays a paramount role in the hydrolysis of TG and phospholipid (PL) in both LDL and HDL, producing small dense LDL and HDL in the syndromes of insulin resistance and VLDL overproduction (Fig. 1.7) (see also Chapter 8). Genetic variants in the promoter region of the HL gene, such as the C-514T polymorphism, are strongly associated with the dyslipidemic triad (see also Chapter 8).
Other Gene Variants Regulating Lipoprotein Levels and LDL Particle Size. In addition to the HL gene, other genes involved in the endogenous lipoprotein pathway and the generation of small, dense LDL (Fig. 1.7), such as those for LPL, CETP, and apolipoprotein E (apoE), may influence the levels of TG, HDL-C, and small, dense LDL.
Fatty Acid Binding Protein Type 2. The intestinal fatty acid binding protein (FABP)-2 gene is a member of a family of more than 20 FABP genes (13). The FABP-2 gene is only expressed in the intestinal epithelial cells, where it promotes the transport of hydrophobic FFA from the plasma membrane to the
endoplasmic reticulum and the subsequent esterification of FFA to TG. A common polymorphism in the FABP-2 gene, Ala54Thr, may promote insulin resistance since increased dietary fat absorption leads to higher plasma FFA and TG (13) that may adversely affect insulin action in the hepatocytes and skeletal muscle cells (see also the preceding text). While the Ala54Thr polymorphism appears to contribute to increased postprandial dyslipidemia (see also the preceding text) it does not increase the risk of type 2 diabetes (13).
endoplasmic reticulum and the subsequent esterification of FFA to TG. A common polymorphism in the FABP-2 gene, Ala54Thr, may promote insulin resistance since increased dietary fat absorption leads to higher plasma FFA and TG (13) that may adversely affect insulin action in the hepatocytes and skeletal muscle cells (see also the preceding text). While the Ala54Thr polymorphism appears to contribute to increased postprandial dyslipidemia (see also the preceding text) it does not increase the risk of type 2 diabetes (13).
Pathophysiology of Diabetic Dyslipidemia in Relation to the Prediabetic State
Both type 2 diabetes and CVD are hypothesized to spring from a “common soil” of metabolic antecedents, including impaired glucose tolerance, hypertension, dyslipidemia, and abdominal obesity (14). The clustering of these CVD risk factors is thought to result from an underlying insulin-resistance syndrome, also known as the metabolic syndrome or Syndrome X, which precedes the onset of type 2 diabetes. Reaven (15) first summarized the insulin-resistance syndrome as resistance to insulin-stimulated glucose uptake, hyperinsulinemia, impaired glucose tolerance, hyperglycemia, hypertension, elevated TG, and decreased HDL-C. The presence of dyslipidemia related to insulin resistance prior to the onset of type 2 diabetes may explain why >50% of patients with newly diagnosed type 2 diabetes already have evidence of coronary artery disease at the time of diagnosis. In the San Antonio Heart Study, Haffner et al. showed that compared to individuals who remained nondiabetic, individuals who eventually developed diabetes had higher TG and lower HDL-C several years before diagnosis (14).
Compared to individuals without diabetes, those with diabetes typically have higher TG and lower HDL-C. In studies of both diabetic and nondiabetic individuals, TG are positively correlated with direct measures of insulin resistance (16,17,18) as well as serum insulin levels (19,20). Individuals with type 2 diabetes have three characteristic abnormalities in their lipid profiles—(i) hypertriglyceridemia, (ii) small, dense LDL particles, and (iii) low HDL-C. In the Strong Heart Study, diabetic women had lower HDL-C levels compared to women without diabetes, and both men and women with diabetes had smaller LDL particle size than their nondiabetic counterparts (18). Type 2 diabetes is also associated with a higher prevalence of small, dense LDL particles (7,21,22,23).
Related posts:
 Use of Noninvasive Methods to Diagnose Cardiovascular Disease in Dyslipidemic Patients
 Dyslipidemia and Atherosclerosis in Women
 Fish Oils in the Treatment of Dyslipidemia and Cardiovascular Disease
 Lipid, Apolipoprotein, and Lipoprotein Metabolism: Implications for the Diagnosis and Treatment of Dyslipidemia
 Disorders of Hypertriglyceridemia
 Trans Fatty Acids, Dyslipidemia, and Cardiovascular Disease
Stay updated, free articles. Join our Telegram channel

Full access? Get Clinical Tree


