2 Pathology and Molecular Classification
Based on the principles established by Percival Bailey and Harvey Cushing almost a century ago, the classification of primary central nervous system (CNS) neoplasias is based on morphological similarities with preexisting normal cells from which these neoplasias are considered to originate. Brain tumors that are composed of cells that resemble astrocytes, oligodendrocytes, and ependymal cells are classified as astrocytomas, oligodendrogliomas, and ependymomas, respectively. Tumors composed of small round cells that resemble the neuronal precursor cells seen during normal neurodevelopment are classified as primitive neuroectodermal tumors (PNETs). When PNETs arise in the cerebellum, they are classified as medulloblastomas. To corroborate diagnoses that are based on microscopic analysis, tumors are further examined by immunohistochemistry to determine whether there is expression of specific proteins associated with specific types of normal CNS cells, alluding to the putative cell type of origin. For example, glial fibrillary acidic protein (GFAP) is expressed primarily in glial cells, and the presence of GFAP expression in a CNS neoplasm helps categorize it as a glioma.
In addition to the cell-of-origin relationship, CNS neoplasia are graded based on the identification of morphological features that have been associated with clinical behavior and patient outcomes, helping to guide the choice of therapy for that specific tumor type. Various grading schema have been proposed to classify CNS tumors based on their expected clinical behavior. Among these, the World Health Organization (WHO) Classification of Tumors of the Central Nervous System is the most widely accepted, and the most recent edition was published in 2007. Tumor classification includes an assessment of the extent of specimen anaplasia, which involves estimating tumor-cell to normal-cell similarity, combined with a determination of the presence or absence of microscopic features indicative of aggressive behavior, such as mitotic activity, tumor necrosis, and angiogenesis. Although the Bailey and Cushing system of classification has proven highly useful in neuro-oncology research and clinical practice, modern molecular profiling techniques are yielding a new layer of diagnostic and prognostic information, in addition to the conventional histopathological classification. However, it is important to recognize that comprehensive tumor molecular profiling is still at the relatively early stages of development and application, and the results of related studies are only just beginning to have a widespread impact on clinical practice. Nonetheless, as these approaches move toward consensus platforms and standardized methods, the prospect of their improving our ability to provide detailed and individualized information for appropriate therapy selection and improved patient outcomes looks very promising.
 Methods for Tumor Molecular Profiling and Classification
During the 1980s and 1990s, the most commonly used molecular methods for examining cells and tissues enabled us to acquire results for single genes, transcripts, or proteins for each experiment conducted. Undoubtedly the Western or immunoblot for protein analysis, as well as Southern and Northern blots for DNA and RNA analysis, respectively, generated large and useful bodies of information that served to highlight the distinct features of normal versus malignant cells, but just as certainly these methods are labor intensive and relatively inefficient in yielding data. The rapid development and application of techniques for querying all, or at least large portions, of the genomes, transcriptomes, and proteomes for cells and tissues has led to giant strides in their application to the study of CNS neoplasia, and the most common representatives of these methods are discussed briefly in the following section.
Comparative Genomic Hybridization
The completion of the Human Genome Project brought with it the ability to organize cloned DNA sequences with respect to their linear and contiguous order on human chromosomes. A specific type of recombinant DNA, referred to as a bacterial artificial chromosome (BAC), proved highly useful for this purpose, and BAC clones containing human chromosomal DNA are now proving to be a critical resource for the genomic profiling of tumor DNAs. The BACs accommodate, on average, 100,000 base pairs of human chromosomal DNA (1.7 × 10⁻⁵ of the DNA in a normal human cell).
The DNA sequence contained in a BAC can be assigned to a specific chromosome location, and by arraying thousands of these BACs, it is possible to provide an orderly representation of all human chromosomes on very small surfaces. These arrayed BACs can be used for examining changes in tumor DNAs as follows. The DNA from a tumor and from a normal human DNA tissue/cell source are isolated, fragmented, and labeled through the incorporation of nucleotides that have been tagged with fluorescent dyes. Generally a red fluorescent dye is used to label a tumor DNA, and a green fluorescent dye is used to label a normal DNA (Fig. 2.1). These DNAs are mixed and cohybridized to a slide or “chip,” onto which BACs have been spotted or “arrayed.” The fluorescent dye–labeled normal and tumor DNAs compete with each other for binding to the arrayed BACs, and for sequences in which there is overrepresentation in the tumor DNA, red fluorescence is preferentially emitted, whereas tumor DNA underrepresentation results in preferential green fluorescence emission. By reading the fluorescence emissions for all coordinates (spots) on the array (Fig. 2.1b), regions of tumor chromosomal gain or deletion can be deduced (Fig. 2.1a). This procedure is most commonly referred to as array comparative genomic hybridization (CGH). When applied to a series of tumors, the thousands of CGH data fields for each tumor can be compared against specific clinical behaviors, such as survival, in an attempt to identify array “fingerprints” that are consistently associated with the clinical feature of interest (Fig. 2.1c).

The lower-resolution precursor of array CGH involves the hybridization of labeled normal and tumor DNAs directly to metaphase chromosomes (Fig. 2.1a), followed by an analysis of the red-to-green fluorescence of the chromosomes to identify regions of gain or loss in the tumor genome. Array CGH technologies have rapidly supplanted direct chromosomal CGH and, as a result, much of the comparative genomic hybridization literature since 2000 involves this approach.
Fluorescence In-Situ Hybridization Analysis
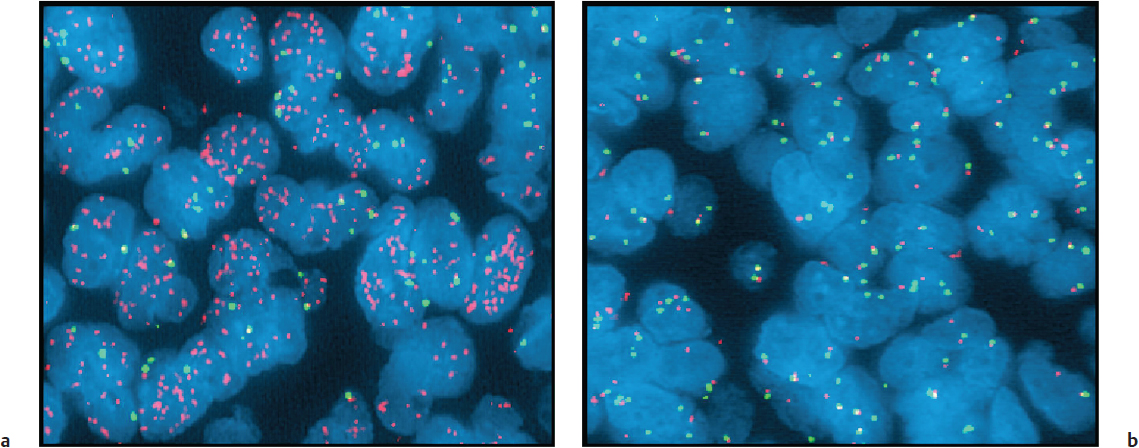
Normally, there are two copies of each gene per cell. The same BAC clones already described can be used singularly to examine individual tumor cells for increased or decreased DNA content of specific chromosome locations. This is accomplished by hybridizing a fluorescence-labeled BAC to sectioned tumor tissues, followed by fluorescence microscopy examination of the cells in the tissue to assess whether they show increased (> 2) or decreased (< 2) signals per cell, and that would indicate gain or loss, respectively, of the BAC sequence in tumor cells (there are normally 2 copies of each gene). A straightforward example of this fluorescence in-situ hybridization (FISH) analysis involves the hybridization of a BAC containing a gene that is amplified in a tumor, such as the epidermal growth factor receptor gene (EGFR), and that would produce many more than two signals in the cells of a tumor (Fig. 2.2), as compared with the two signals that we would see if the BAC were hybridized to a tumor in which the gene were not amplified. Though the results of FISH are often inferred from the results of array CGH, FISH is an essential corroboration of CGH information, especially in instances where a gene of interest encodes a potential therapeutic target.
Expression Profiling
Similar to the global as well as individual approaches for examining tumor DNA, there are comprehensive and individual approaches for examining expressed sequences (messenger RNAs [mRNAs]) in tumor tissues. The comprehensive analytic approach most commonly used is referred to as expression profiling. It shares some similarities with array CGH for DNA but has distinct features as well. Rather than the use of arrayed BAC clones containing very large genomic DNA inserts, short nucleotide sequences (oligonucleotides), complementary to all known expressed sequences, are fixed or synthesized on a solid support, with each oligonucleotide spotted at a defined coordinate. Tumor mRNA, rather than being directly labeled after isolation, is first converted to complementary DNA (cDNA) that is then used as a template for the synthesis of biotinylated complimentary RNA (cRNA), and which is then hybridized to the arrayed oligonucleotides. Subsequent to rinsing away unbound cRNA, the arrays are incubated with fluorescent dye–tagged streptavidin, which binds to the biotinylated cRNA. The array is then subjected to quantitative fluorescence analysis, and the relative expression levels of individual tumor transcripts are determined.
Real-Time Quantitative Polymerase Chain Reaction
Just as FISH analysis can be considered a validation for array CGH results, real-time quantitative polymerase chain reaction (PCR) is important to the validation of expression profile results. In brief, this approach involves the use of PCR and fluorescence detection to monitor the rate of amplification for a specific cDNA, the starting amount for which is determined by the tumor-associated expression of its corresponding transcript. A rapid amplification of a sequence of interest would be consistent with expression profile data indicating the same sequence as being overexpressed in the same tumor. Conversely, a tumor-specific reduced rate of sequence amplification would be consistent with expression profile data indicating a transcript’s underrepresentation in a tumor. However, rather than simply reexamining tumors that have already been expression profiled, the approach that is used more often with quantitative PCR is to examine a set of genes, having been revealed as up- or downregulated in a few tumors by expression profiling, in an expanded series of tumors that have not been expression profiled. Alternatively, one can examine tumor tissues for corresponding protein expression. If appropriate antibodies are available for immunohistochemical (IHC) analysis, one can rapidly acquire data for a large number of tumor specimens using tissue microarrays (TMAs).
Matrix-Assisted Laser Desorption/Ionization Mass Spectrometry
In preparing to use this comprehensive protein detection method, a tissue section is deposited or mounted on a metal plate, coated with an ultraviolet (UV)-absorbing matrix, and subsequently exposed to a UV laser that ionizes the protein/peptide content coated by the matrix. The charged molecules in the matrix are accelerated down a flight tube, and each is detected based on its unique mass-to-charge ratio. The signals are separated according to this ratio, and the data output is a spectrum in which the peaks observed correspond to the peptides and proteins from the sample. In the case of direct tissue analysis, multiple regions of the tissue’s surface are examined to account for cellular heterogeneity, and the data are collected as a series of mass spectra. Each spectrum contains signals from many hundreds of proteins and peptides specific to a corresponding tissue region.
As with the global/comprehensive approaches to DNA and RNA analysis, comprehensive protein analysis has corroborative approaches for validating individual biomarkers of interest (i.e., Western blot in instances where additional fresh tissue is available, and IHC analysis of formalin-fixed tissues). Comprehensive proteomic analysis has exciting potential but it is the least mature of the global approaches for investigating the molecular characteristics of a tumor tissue, although its use is gradually becoming more prevalent.
Next-Generation Sequencing for Brain Tumor Diagnosis
Recently, there has been a growing effort to better understand the genetic basis of various neoplasms, including gliomas, using highly refined high-throughput sequencing. The term next-generation sequencing (NGS) encompasses several different technologies to investigate the genome, epigenome, and transcriptome. Common to these methods is the concurrent analysis of multiple DNA templates (massively parallel sequencing) that extends far beyond the capabilities of prior standard methods, at a much lower overall cost. Next-generation sequencing refers to the technology only, and the exact template to be sequenced can range from the whole genome to a more targeted approach. For example, because the human exome (the portion of the genome that codes for known genes) makes up only 1% of the human genome, there is a gain in efficiency (not to mention lower sequencing costs) when targeted approaches, such as whole exome sequencing, are applied. In this method, there is initial enrichment of the exonic regions in the sample, followed by targeted sequencing. Comparing the tumor exome to the nontumor exome from the same patient enables identification of tumor-specific variations (somatic mutations).
The efficiency of capturing the entire exome, or portions thereof, however, depends on the fidelity and efficiency of the enrichment methods utilized. Following the generation of raw data from the sequencer, various bioinformatics tools are required to analyze and interpret the results. These include aligning the sequences to the human genome, post-alignment processing to identify aberrations, and functional prediction. Interestingly, a major hurdle in the ability to apply NGS in the clinical setting is not the technology itself but rather the bioinformatics and data interpretation. A consensus regarding the standardized utilization of the available bioinformatics tools is only just beginning to form. Even with these challenges, NGS, by virtue of allowing simultaneous testing for multiple targets in a time frame appropriate for a clinical setting, holds great promise for clinical implementation of cancer diagnosis and management, including brain tumors.
Next-generation sequencing will most likely be utilized routinely in the near future as an adjunct to histopathology for tumor classification. Targeted drugs that show efficacy in a subset of patients will become personalized when known mutations or patterns of aberration (tumor signatures) are increasingly recognized. Acknowledging that histopathology offers only a first step toward biological classification, tumor subsets will be identified using clinically relevant mutations, DNA copy number alterations, and expression signatures, all of which can be determined by specific NGS applications, in the clinical setting.
 Common Central Nervous System Tumors
Medulloblastoma
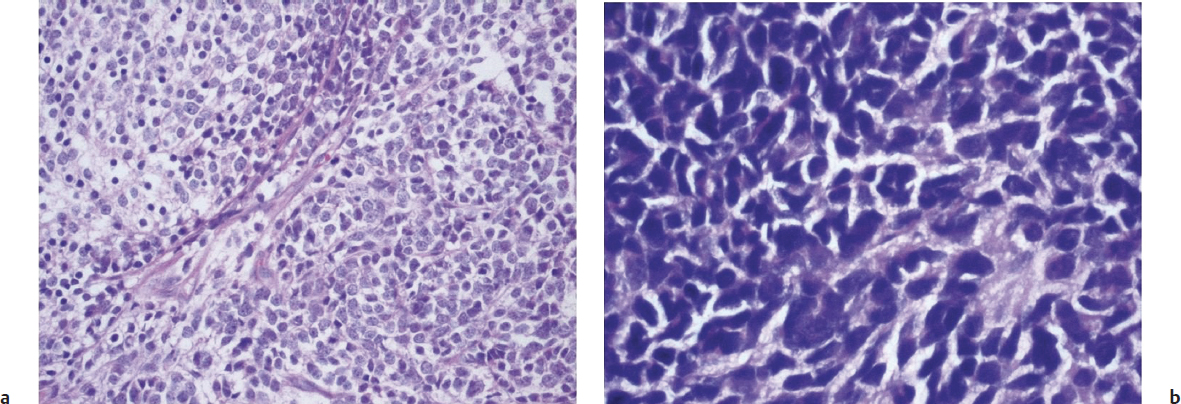
Medulloblastoma is a highly cellular, invasive, and malignant CNS tumor that occurs in the posterior fossa, with a peak incidence in childhood and occasional occurrences in adults of late middle age. Classic medulloblastomas consist of densely packed cells of round to oval shape, with hyperchromatic nuclei, minimal cytoplasm, and a “small round blue cell” tumor. They have high mitotic and apoptotic rates, and usually display neuroblastic rosettes (Fig. 2.3). Microvascular proliferation is relatively uncommon, and tumors may show evidence of neuronal, glial, or combined differentiation. Histological variants include desmoplastic/nodular medulloblastoma, which has nodular reticulin-free regions of neuronal maturation; anaplastic medulloblastoma, which has marked nuclear pleomorphism; and large cell medulloblastoma, which has larger nuclei with prominent nucleoli.
Medulloblastomas often invade the fourth ventricle, with occasional brainstem involvement. There is a high risk of seeding through the subarachnoid space due to the tendency of the tumor to penetrate the ependymal surface. Many antigens have been identified as being focally expressed in medulloblastoma, including nestin, vimentin, neurofilament proteins, GFAP, retinal S-antigen, Trk-A, Trk-B, Trk-C, and neural cellular adhesion molecules (N-CAMs).
The study of genetic syndromes has contributed significantly to our understanding of the molecular biology of medulloblastoma. Gorlin’s syndrome (hereditary nevoid basal cell carcinoma syndrome) and familial adenomatous polyposis (FAP) syndrome arise from mutations in the patched homolog 1, PTCH1 (9q), and adenomatous polyposis coli, APC (5q) genes, respectively, and each confers predisposition to medulloblastoma formation. The products of these two genes take part in interconnected pathways that are of fundamental importance to neural development. Other genes being investigated for their significance in medulloblastoma development include NMYC and MYCC, which are amplified in ~10% of these tumors and are in fact associated with the large cell and anaplastic medulloblastoma variants, and have an especially aggressive clinical behavior.1
Among the common pediatric CNS tumors, substantial comprehensive genomic characterizations have been performed on medulloblastomas. The use of array CGH revealed chromosome 6q23 homozygous deletion in an extensively utilized medulloblastoma cell line, and novel medulloblastoma amplification targets PPM1D and CDK6. An alternative form of comprehensive genomic analysis, digital spectral karyotyping, also revealed the amplification of OTX-2, which encodes a transcriptional regulator of CMYC.2–4
With respect to transcriptome analysis, there has been substantial application of expression profiling to the study of medulloblastoma. The first such investigation,5 which has proven to be highly influential as concerns the utility of global gene expression analysis in neuro-oncology research, demonstrated that transcriptome fingerprints can be used to distinguish histopathologically similar small round cell tumors of the CNS; specifically, medulloblastomas can be transcriptionally distinguished from other primitive neuroectodermal tumors and atypical teratoid/rhabdoid tumors, the latter of which has a consistently poor prognosis. The results of this same study additionally demonstrated that expression profiles can distinguish histopathological subtypes of medulloblastoma (i.e., desmoplastic from classical), and can reliably predict outcomes of medulloblastoma patients.
Recent genome-wide DNA copy number and mRNA expression profiles from a large cohort of primary medulloblastomas have been utilized to generate molecular classification schema that reliably predict patient prognosis. Current consensus classification based on these studies identifies four principal molecular subgroups of medulloblastomas, based on signalling pathway abnormalities, termed Wnt, Shh, Group 3, and Group 4.6 These subgroups appear distinct in terms of patient demographics, histological features, DNA copy number aberrations, and clinical outcomes. Medulloblastomas in the Wnt subgroup frequently show somatic mutations of CTNNB1 that encodes β-catenin, and deletions of one copy of chromosome 6. These tumors occur at all ages (but are relatively less common among infants), have an equal gender distribution, predominantly show classical medulloblastoma histology, and have relatively more favorable outcomes. Medulloblastomas in the Shh subgroup are driven by aberrations involving the sonic hedgehog signaling pathway, including mutations in the PTCH, SMO, and SUFU genes, and amplifications of GLI 1/2, almost exclusively show deletion of chromosome 9q that contains the PTCH gene, and frequently have MYCN amplification. These medulloblastomas have a bimodal age distribution, with infants and adults having these more frequently than children and appear to have an overall equal gender distribution. Desmoplastic/nodular medulloblastoma variants almost exclusively belong to this subgroup; however, it is important to note that a large proportion of medulloblastomas in the Shh subgroup are not desmoplastic/nodular. The Shh subgroup has an overall intermediate prognosis, and might have more favorable outcomes among infants. Group 3 and Group 4 medulloblastomas do not show aberrations in either of these two pathways. Medulloblastomas in these subgroups show classic, large cell and anaplastic histologies. Group 3 medulloblastomas have high-level expression of MYC but not MYCN. In contrast, Group 4 tumors have minimal expression of MYC and MYCN. Group 3 tumors have higher frequencies of gain of chromosome 1q and/or loss of chromosomes 5q and 10q as compared to Group 4 tumors. Loss of 17q is the most frequent cytogenetic change among Group 4 tumors, and is less frequently seen in Group 3 tumors. Group 3 tumors occur more commonly in males, are found in infants and children and are exceptionally rare in adults. Group 4 tumors also show a high male/female ratio, although a majority of these tumors that arise in females show loss of the X chromosome. Group 3 tumors have a high frequency of metastasis, whereas Group 4 cases have an intermediate prognosis, similar to Shh tumors. Epigenetic DNA methylation studies have also demonstrated four medulloblastoma subgroups that are highly related to these transcriptomic counterparts.7
Gliomas
Gliomas are CNS tumors that are considered to arise from the normal glial cells in the CNS, namely astrocytes, oligodendroglial cells, and ependymal cells. In general, gliomas can be classified as circumscribed or diffusely infiltrating. Diffusely infiltrating gliomas are characterized by the presence of extensive infiltration of tumor cells into the adjacent brain parenchyma, and absence of a well-defined tumor–normal parenchyma interface. These gliomas include infiltrating astrocytomas and oligodendrogliomas. The most common examples of circumscribed gliomas are pilocytic astrocytomas and ependymomas.
Pearl
• The infiltrating gliomas (diffuse astrocytomas and oligodendrogliomas) must be distinguished from the circumscribed gliomas (e.g., pilocytic astrocytomas, ependymomas). The former are biologically aggressive (to varying degrees), whereas the latter are more amenable to surgical resection and have a more favorable clinical course.
Circumscribed Gliomas
Pilocytic Astrocytomas
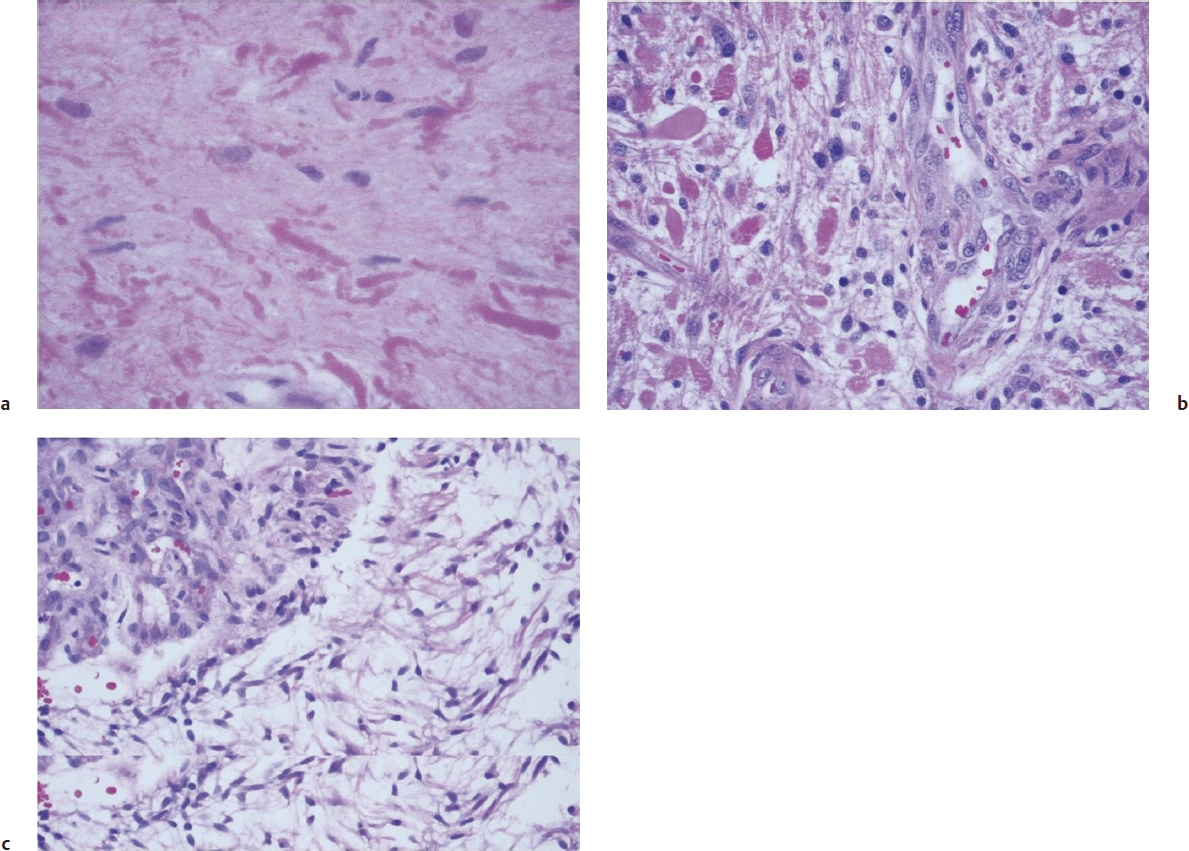
Pilocytic astrocytomas are relatively circumscribed tumors that are most often present in the cerebellum of children, but can occur in the hypothalamic region as well as the optic nerve. These tumors show a wide spectrum of morphologies, though they generally present as biphasic tumors, with loose and dense areas, and are composed of cells with elongated nuclei and bipolar thin (“piloid,” or hair-like) cytoplasmic processes. Rosenthal fibers and eosinophilic granular bodies are frequently seen in these tumors (Fig. 2.4).
Pearl
• Rosenthal fibers contain clumped GFAP filaments and might also be seen in the normal neuropil surrounding slowly expansile tumors. When present in a tumor, frequently accompanied by eosinophilic granular bodies, they suggest slow growth, such as in a pilocytic astrocytoma, pleomorphic xanthoastrocytoma, or ganglioglioma.
If present, the features typically associated with malignant biological behavior in diffuse adult astrocytomas, such as microvascular proliferation and mitoses, do not carry a negative prognostic implication. In fact, pilocytic astrocytomas are generally biologically nonaggressive and are remarkable among astrocytic tumors in maintaining their grade I status over many years. Consistent with this behavior is the favorable long-term prognosis for pilocytic astrocytoma patients where complete resection is often possible, especially for patients with cerebellar tumors.
With respect to comprehensive genome screens of these tumors, CGH (Fig. 2.1a) has demonstrated instances of 9q34.1-qter gain8 and 19p loss,9 suggesting the existence of specific gene targets whose alteration is associated with subsets of these tumors. The observation of gains of chromosome 7q34 in sporadic pilocytic astrocytomas10 led to the subsequent identification of a novel BRAF: KIAA1549 fusion/duplication product leading to activation of the BRAF-MEK-ERK signaling pathway.8,11,12 Indeed, the activation of BRAF might be the initiating event that induces pilocytic astrocytoma.13
Anaplasia in pilocytic astrocytomas, a rare event associated with worse clinical outcomes, is histologically characterized by marked nuclear atypia, more frequent mitoses, and tumor necrosis. It has been associated with prior radiation therapy and neurofibromatosis type 1. Activation of the phosphatidylinositol 3′-kinase (PI3K)-Akt pathway has also been associated with clinically aggressive pilocytic astrocytomas.14 The BRAF V600E mutation has also been described in a subset of pilocytic astrocytomas that occur in extracerebellar locations, and might be associated with a more aggressive clinical behavior.14,15 However, this mutation is more frequently seen in pleomorphic xanthoastrocytoma and ganglioglioma, two other circumscribed glial/glioneuronal brain tumors.15