Abbreviations
- ABCC8 ATP-binding cassette transporter sub-family C member 8
- ACE Angiotensin-converting enzyme
- ADA American Diabetes Association
- ADH Antidiuretic hormone (vasopressin)
- AGE Advanced glycation end product
- AGPAT 1-acylglycerol-3-phosphate-O-acyltransferase 2
- AKT/PKB AKR mouse tumor 8 kinase/protein kinase B
- AIRE Autoimmune regulator
- ALT Alanine aminotransferase
- AMPK Adenosine monophosphate-activated protein kinase
- APS1 Autoimmune polyendocrinopathy syndrome type 1
- ATF6 Activating transcription factor 6
- BMIy Body mass index
- cAMP Cyclic adenosine monophosphate
- CCK Cholecystokinin
- CEL Carboxyl-ester lipase
- cGMP Cyclic 3′,5′-guanosine monophosphate
- CIDEC Cell death-inducing DFFA-like effector C
- CSII Continuous subcutaneous insulin infusion
- CST Contraction stress test
- DCCT Diabetes Control and Complications Trial
- DIDMOAD Diabetes insipidus, diabetes mellitus, optic atrophy, deafness (Wolfram syndrome)
- DPP Diabetes Prevention Program
- DPP-4 Dipeptidyl peptidase 4
- DPT-1 Diabetes Prevention Trial-1
- EIF2AK3 Eukaryotic translation initiation factor 2-α kinase 3
- ER Endoplasmic reticulum
- FDA Food and Drug Administration
- FFA Free fatty acid
- FHR Fetal heart rate
- Foxo1 Forkhead box, subfamily O, member 1
- FOXP3 Forkhead box, subfamily P, member 3
- GABA Gamma-aminobutyric acid
- GAD Glutamic acid decarboxylase
- GCK Glucokinase
- GH Growth hormone
- GHb Glycohemoglobin
- GHSR Growth hormone-secretagogue receptor
- GI Glycemic index
- GIP Gastric inhibitory polypeptide
- GLIS3 Glioma-associated oncogene homolog—similar 3
- GLP-1 Glucagon-like peptide-1
- GLP-2 Glucagon-like peptide-2
- GLUT Glucose transporter
- GPCR G protein-coupled receptor
- GRPP Glicentin-related polypeptide
- GWAS Genome-wide association study
- HDL High-density lipoprotein
- HLA Human leukocyte antigen
- HNF Hepatocyte nuclear factor
- hPL Human placental lactogen
- IA2 Insulinoma antigen 2
- IAA Insulin autoantibody
- IAPP Islet amyloid polypeptide
- ICA Islet cell antibody
- IFG Impaired fasting glucose
- IGF-1 Insulin-like growth factor 1
- IGT Impaired glucose tolerance
- IL-6 Interleukin-6
- INS Insulin
- IP3 Inositol 1,4,5-triphosphate
- IPEX Immunodysregulation polyendocrinopathy enteropathy, X-linked
- IPF-1 Insulin promoter factor-1
- IRE1 Inositol-requiring enzyme 1
- IRS Insulin receptor substrate
- ISL1 Islet transcription factor 1
- IUGR Intrauterine growth restriction
- KPD Ketosis prone diabetes
- KCNJ11 Potassium inwardly-rectifying channel, subfamily J, member 11
- Kir6.2 Potassium channel, inwardly- rectifying 6.2
- LADA Latent autoimmune diabetes of adulthood
- LBK1 Liver kinase B1
- LDL Low-density lipoprotein
- MAPK Mitogen-activated protein kinase
- MODY Maturity-onset diabetes of the young
- MHC Major histocompatibility complex
- mTOR Mammalian target of rapamycin
- NeuroD1 Neural differentiation factor 1
- Neurog3 Neural genesis factor 3
- NIH National Institutes of Health
- NPH Neutral protamine hagedorn
- NST Nonstress test
- PAI-1 Plasminogen activator inhibitor-1
- PAX4 Paired homeobox 4
- PCSK Proprotein convertase, subtilisin/kexin
- PDE5 Phosphodiesterase type 5
- PDX1 Pancreatic duodenal homeobox-1
- PERK Protein kinase R-like endoplasmic reticulum kinase
- PGC1α PPAR gamma coactivator-1α
- PNDM Permanent neonatal diabetes mellitus
- POEMS Polyneuropathy, organomegaly, endocrinopathy, monoclonal gammopathy, and skin changes
- PP Pancreatic polypeptide
- PPAR Peroxisome proliferator-activated receptor
- PTF1A Pancreatic transcription factor 1α
- PTP1b Protein tyrosine phosphatase 1b
- RFX6 Regulatory factor X-6
- RXR 9-cis–retinoic acid receptor
- SCL19A2 Solute carrier family 19 (thiamine transporter), member 2
- SOCS Suppressor of cytokine signaling
- SREBP1c Sterol regulatory element-binding protein 1c
- SSTR Somatostatin receptor
- SUR1 Sulfonylurea receptor 1
- TCF7L2 Transcription factor 7-like 2
- TGF-a Transforming growth factor-β
- TNDM Transient neonatal diabetes mellitus
- TNF-α Tumor necrosis factor-α
- UGDP University Group Diabetes Program
- UKPDS United Kingdom Prospective Diabetes Study
- VEGF Vascular endothelial growth factor
- VLDL Very low density lipoprotein
- VNTR Variable number of tandem repeats
- WFS1 Wolfram syndrome protein 1
- ZAC Zinc finger protein-inducing apoptosis and cell cycle arrest
- ZnT8 Zinc transporter 8
- ZFP57 Zinc finger protein 57
The Endocrine Pancreas
The pancreas comprises two functionally distinct organs: the exocrine pancreas, the major digestive gland of the body; and the endocrine pancreas, the source of insulin, glucagon, somatostatin, pancreatic polypeptide (PP), and ghrelin. Whereas the major role of the products of the exocrine pancreas (the digestive enzymes) is the processing of ingested foodstuffs so that they become available for absorption, the hormones of the endocrine pancreas modulate every other aspect of cellular nutrition from rate of adsorption of foodstuffs to cellular storage or metabolism of nutrients. Dysfunction of the endocrine pancreas or abnormal responses to its hormones by target tissues cause serious disturbances in nutrient homeostasis, including the important clinical syndromes grouped under the name diabetes mellitus.
The endocrine pancreas consists of approximately 1 million small endocrine glands—the islets of Langerhans—scattered throughout the glandular substance of the exocrine pancreas. The exocrine pancreas consists of the enzyme-producing cells organized into acini, and the duct system that delivers those enzymes to the lumen of the duodenum. The islet volume comprises 1% to 1.5% of the total mass of the pancreas and weighs about 1 to 2 g in adult humans. At least five cell types—α, β, δ, ε, and PP—have been identified in the islets (Table 17–1). Each of these islet cell types produces a distinguishing peptide hormone: glucagon, insulin, somatostatin, ghrelin, and PP, respectively. Within individual islets, the different cell types are scattered throughout. A typical human islet is depicted in Figure 17–1.
Figure 17–1
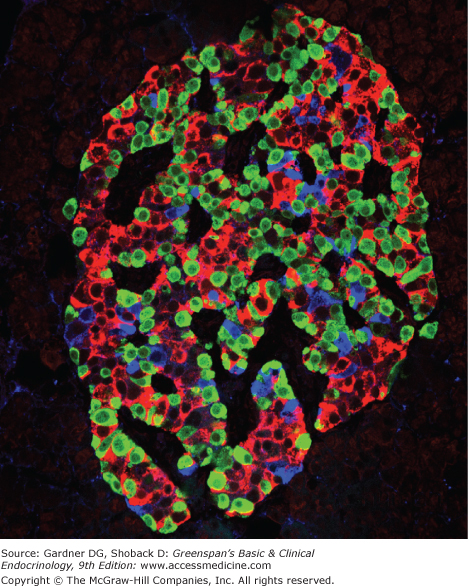
Human islet of Langerhans. Staining for insulin (red), glucagon (green), and somatostatin (blue) was performed by immunofluorescence and imaged by confocal microscopy.
(Reproduced, with permission, from Cabrera O, Berman DM, Kenyon NS, Ricordi C, Berggren PO, Caicedo A. The unique cytoarchitecture of human pancreatic islets has implications for islet cell function. Proc Natl Acad Sci. 2006;103(7):2334.)
| Cell Types | Approximate Percentage of Islet Volume | Secretory Products |
|---|---|---|
| α Cell | 25% | Glucagon, proglucagon |
| β Cell | 55% | Insulin, C peptide, proinsulin, IAPP, γ-aminobutyric acid (GABA) |
| δ Cell | 10% | Somatostatin-14 |
| ε Cell | 3% | Ghrelin |
| PP cell | 5% | Pancreatic polypeptide |
These cell types are not distributed uniformly throughout the pancreas. The PP cells reside primarily in islets in the posterior portion (posterior lobe) of the head, a discrete lobe of the pancreas separated from the anterior portion by a fascial partition. This lobe originates in the primordial ventral bud as opposed to the dorsal bud. The posterior lobe receives its blood supply from the superior mesenteric artery; the remainder of the pancreas derives most of its blood flow from the celiac artery. The islets themselves are richly vascularized, receiving five to ten times the blood flow of the surrounding exocrine pancreatic tissue. Each islet is surrounded by a lattice of astroglial cells and innervated by sympathetic, parasympathetic, and sensory neurons.
The human insulin gene resides on the short arm of chromosome 11. A unique set of transcription factors found in the β cell nucleus activates the transcription of the preproinsulin mRNA from the insulin gene (Figure 17–2). A precursor molecule, preproinsulin, a peptide of MW 11,500, is translated from the preproinsulin messenger RNA in the rough endoplasmic reticulum of pancreatic β cells (see Figure 17–2). Microsomal enzymes cleave preproinsulin to proinsulin (MW ∼9000) almost immediately after synthesis. Proinsulin is transported to the Golgi apparatus, where packaging into clathrin-coated secretory granules takes place. Maturation of the secretory granule is associated with loss of the clathrin coating and conversion of proinsulin into insulin and a smaller connecting peptide, or C peptide, by proteolytic cleavage at two sites along the peptide chain. Mature secretory granules contain insulin and C peptide in equimolar amounts and only small quantities of proinsulin, a small portion of which consists of partially cleaved intermediates.
Proinsulin (Figure 17–3) consists of a single chain of 86 amino acids, which includes the A and B chains of the insulin molecule plus a connecting segment of 35 amino acids. Two proteins—the prohormone-converting enzymes type 1 and 2 (PCSK1 and PCSK2)—are packaged with proinsulin in the immature secretory granules. These enzymes recognize and cut at pairs of basic amino acids, thereby removing the intervening sequence. After the two pairs of basic amino acids are removed by carboxypeptidase E, the result is a 51 amino acid insulin molecule and a 31 amino acid residue, the C peptide, as shown in Figure 17–3.
A small amount of proinsulin produced by the pancreas escapes cleavage and is secreted intact into the bloodstream, along with insulin and C peptide. Most anti-insulin sera used in the standard immunoassay for insulin cross-react with proinsulin; about 3% to 5% of immunoreactive insulin extracted from human pancreas is actually proinsulin. Because proinsulin is not removed by the liver, it has a half-life three to four times that of insulin. Its long half-life allows proinsulin to accumulate in the blood, where it accounts for 12% to 20% of the circulating immunoreactive insulin in the basal state in humans. Human proinsulin has about 7% to 8% of the biologic activity of insulin. The kidney is the principal site of proinsulin degradation.
Of the two major proinsulin split products present in plasma, the one split at arginine 32-33 far exceeds in amount the barely detectable 65-66 split product. In control subjects, concentrations of proinsulin and 32-33 split proinsulin after an overnight fast averaged 2.3 and 2.2 pmol/L, respectively, with corresponding postprandial rises to 10 and 20 pmol/L.
C peptide, the 31 amino acid peptide (MW 3000) released during cleavage of insulin from proinsulin, has no known biologic activity. β Cells release C peptide in equimolar amounts with insulin. It is not removed by the liver but is degraded or excreted chiefly by the kidney. It has a half-life three to four times that of insulin. In the basal state after an overnight fast, the average concentration of C peptide may remain as high as 1000 pmol/L.
Insulin is a protein consisting of 51 amino acids contained within two peptide chains: an A chain, with 21 amino acids; and a B chain, with 30 amino acids. The chains are connected by two disulfide bridges as shown in Figure 17–3. In addition, an intra chain disulfide bridge links positions 6 and 11 in the A chain. Human insulin has a molecular weight of 5808.
Endogenous insulin has a circulatory half-life of 3 to 5 minutes. It is degraded chiefly by insulinases in liver, kidney, and placenta. A single pass through the liver removes approximately 50% of the plasma insulin.
The human pancreas secretes about 30 units of insulin per day into the portal circulation of normal adults in distinct pulses with a period of approximately 5 minutes. The basal concentration of insulin in the peripheral blood of fasting humans averages 10 μU/mL (0.4 ng/mL, or 61 pmol/L). In normal control subjects, insulin seldom rises above 100 μU/mL (610 pmol/L) after standard meals. After ingestion of food, peripheral insulin concentration increases within 8 to 10 minutes, reaches peak concentrations by 30 to 45 minutes, and then rapidly declines to baseline values by 90 to 120 minutes postprandially.
Basal insulin secretion occurs in the absence of exogenous stimuli, in the fasting state. Plasma glucose levels below 80 to 100 mg/dL (4.4-5.6 mmol/L) do not stimulate insulin release, and most other physiologic regulators of insulin secretion only function in the presence of stimulatory levels of glucose. Stimulated insulin secretion occurs in response to exogenous stimuli. In vivo, ingested meals provide the major stimuli for insulin secretion. Glucose is the most potent stimulant of insulin release. The perfused pancreas releases insulin in two phases in response to glucose stimulation (Figure 17–4). When the glucose concentration increases suddenly, an initial short-lived burst of insulin release occurs (the first phase); if the glucose elevation persists, the insulin release gradually falls off and then begins to rise again to a steady level (the second phase). However, sustained levels of high glucose stimulation (∼4 hours in vitro or >24 hours in vivo) result in a reversible desensitization of the β cell response to glucose but not to other stimuli.
Figure 17–4
Multiphasic response of the in vitro perfused rat pancreas during constant stimulation with glucose.
(Modified from Grodsky GM, et al. Further studies on the dynamic aspects of insulin release in vitro with evidence for a two-compartmental storage system. Acta Diabetol Lat. 1969;6[suppl 1]:554.)
The β cell senses glucose through its metabolism (Figure 17–5). Indeed, agents such as 2-deoxyglucose that inhibit the metabolism of glucose block the release of insulin. Glucose enters the pancreatic β cell by passive diffusion, facilitated by membrane proteins termed glucose transporters (see later). Because the transporters function in both directions, and the β cell has an excess of glucose transporters, the glucose concentration inside the β cell is in equilibrium with the extracellular glucose concentration. The low-affinity enzyme glucokinase catalizes the subsequent, and rate-limiting, step in glucose metabolism by the pancreatic β cell, the phosphorylation of glucose to glucose-6-phosphate. Glucose catabolism in the β cell causes a rise in the intracellular ATP-ADP ratio. Acting through the sulfonylurea receptor (SUR1), the nucleotide-sensing subunit of the ATP-sensitive potassium channels on the surface of the β cell, the rise in ATP-ADP ratio closes the potassium channels and depolarizes the cell, thereby activating the voltage-sensitive calcium channels and allowing the entry of calcium ions into the cell.
Figure 17–5
A simplified outline of glucose-sensing and regulated insulin secretion from the β cell. The blue arrows indicate stimulation, and the red lines indicate inhibition. Glucose enters the β cell through facultative glucose transporters, is phosphorylated to glucose-6–phosphate by glucokinse, and enters glycolysis. This results in the production of pyruvate, which enters the mitochondria, is converted to acetyl-CoA, and feeds the tricarboxylic acid (TCA) cycle and oxidative phosphorylation to produce ATP. When ATP levels rise or sulfonylureas bind to the regulatory subunit (SUR1/ABCC8) of the ATP-sensitive K+ channels, the channel subunit (Kir6.2/KCNJ11) closes. This block of the K+ current depolarizes the cell, allowing the voltage-gated calcium channels to open. The entry of calcium drives the fusion of insulin granules with the cell surface membrane and exocytosis of insulin. Glucose metabolism and extracellular signals modulate this pathway through release of Ca2+ from intracellular stores and changes in diacylglycerol (DAG), cAMP, and other intracellular signaling pathways.
Insulin release requires calcium ion signaling. In addition to the voltage-dependent entry of extracellular Ca2+ into the β cell as described earlier, glucose also retards Ca2+ efflux from the β cell and releases Ca2+ from intracellular compartments (predominantly the endoplasmic reticulum) into the cytosol. Some nonglucose stimuli of insulin release also function through increases in cytoplasmic Ca2+. The sulfonylurea and meglitinide (such as repaglinide) medications act by closing the ATP-sensitive potassium channels. Secretagogues such as acetylcholine that act through G protein–coupled receptors of the Gαq class stimulate the release of intracellular Ca2+ stored in the endoplasmic reticulum by activating phospholipase C and releasing the intracellular signaling molecule inositol 1,4,5-triphosphate (IP3).
Glucose metabolism in the β cell also generates additional signals that amplify the secretory response to elevations in cytoplasmic Ca2+ concentration. The exact mechanisms of these amplifying signals remains unknown but involve multiple pathways and include increases in the intracellular signaling molecules diacylglycerol and cAMP. Secretagogues such as the gut hormones glucagon-like peptide-1 (GLP-1) and gastric inhibitory polypeptide (also known as glucose-dependent insulinotropic peptide, GIP) that act via G protein–coupled receptors of the Gαs class also stimulate insulin secretion through elevations in cAMP.
Other factors involved in the regulation of insulin secretion are summarized in Table 17–2. These factors can be divided into three categories: direct stimulants, which directly raise cytoplasmic calcium ion concentrations and thus can act in the absence of stimulatory glucose concentrations; amplifiers, which potentiate the response of the β cell to glucose; and inhibitors. Many of the amplifiers are incretins: gastrointestinal hormones that are released in response to the ingestion of meals and stimulate insulin secretion. The action of the incretins explains the observation that orally ingested glucose provokes a greater insulin secretory response than does the same amount of intravenously administered glucose.
| Stimulants of Insulin Release | Glucose Amino acids: jeucine Neural: vagal stimulation, acetylcholine Drugs: sulfonylureas, meglitinides |
| Amplifiers of Glucose-Induced Insulin Release | Enteric hormones: Glucagon-like peptide 1 (7-37) (GLP1) Gastric inhibitory peptide (GIP) Cholecystokinin, gastrin Secretin Neural: β-adrenergic effect of catecholamines Amino acids: arginine Drugs: GLP1 agonists |
| Inhibitors of Insulin Release | Neural: α-adrenergic effect of catecholamines Humoral: somatostatin Drugs: diazoxide, thiazides, β-blockers, clonidine, phenytoin, vinblastine, colchicine |
Insulin action begins with the binding of insulin to a receptor on the surface of the target cell membrane. Most cells of the body have specific cell surface insulin receptors. In fat, liver, and muscle cells, binding of insulin to these receptors is associated with the biologic response of these tissues to the hormone. These receptors bind insulin rapidly, with high specificity and with an affinity high enough to bind picomolar amounts.
Insulin receptors, members of the growth factor receptor family (see Chapter 1), are membrane glycoproteins composed of two protein subunits encoded by a single gene. The larger alpha subunit (MW 135,000) resides entirely extracellularly, where it binds the insulin molecule. The alpha subunit is tethered by disulfide linkage to the smaller beta subunit (MW 95,000). The beta subunit crosses the membrane, and its cytoplasmic domain contains a tyrosine kinase activity that initiates specific intracellular signaling pathways.
Downstream Signaling. On binding of insulin to the alpha subunit, the beta subunit activates itself by autophosphorylation. The activated beta subunit then recruits additional proteins to the complex and phosphorylates a network of intracellular substrates, including insulin receptor substrate-1 (IRS-1), insulin receptor substrate-2 (IRS-2), and others (Figure 17–6). These activated substrates each lead to subsequent recruitment and activation of additional kinases, phosphatases, and other signaling molecules in a complex pathway that generally contains two arms: the mitogenic pathway, which mediates the growth effects of insulin and the metabolic pathway, which regulates nutrient metabolism.
Figure 17–6
A simplified outline of insulin signaling. A minimal diagram of the mitogenic and metabolic arms of the insulin-signaling pathway is shown. GLUT 4, glucose transporter 4; Grb-2, growth factor receptor–binding protein 2; GS, glycogen synthase (P indicates the inactive phosphorylated form); GSK-3, glycogen synthase kinase 3; IRS, insulin receptor substrate (four different proteins); MAP kinase, mitogen-activated protein kinase; mTOR, mammalian target of rapamycin; PDK, phospholipid-dependent kinase; PI3 kinase, phosphatidylinositol 3 kinase; PKB/Akt, protein kinase B/AKR mouse tumor 8 kinase; PP-1, glycogen-associated protein phosphatase-1; Ras, rat sarcoma protein; SHC, Src and collagen homology protein; SOS, son-of-sevenless related protein; TK, tyrosine kinase).
In the metabolic signaling pathway, activation of phosphatidylinositol-3-kinase leads to the activation of serine/threonine kinase Akt. Akt activation drives the movement of glucose transporter (GLUT) 4–containing vesicles to the cell membrane, increases glycogen and lipid synthesis, and stimulates protein synthesis through the activation of mTOR. In the mitogenic signaling pathway, activation of Ras initiates a cascade of activating phosphorylations via the MAP kinase pathway, leading to cell growth and proliferation.
Transcriptional regulation. In addition, the insulin–signaling pathway regulates the activity of several nuclear transcription factors that in turn control the expression of genes involved in metabolism and growth. These include members of the forkedhead family of transcription factors, including Foxo1, which is inactivated by phosphorylation by Akt downstream of insulin signaling. Foxo1 coordinates the expression of gene networks involved in nutrient metabolism in multiple tissues, generally activating genes involved in the response to fasting. In this process, Foxo1 works with several other transcriptional regulators including the lipogenic transcription factor SREBP1c, members of the PPAR family of nuclear receptors and the PPAR coactivator PGC1α (Figure 17–7). Foxo1 also inhibits β cell proliferation and survival.
Figure 17–7
Regulation and function of Foxo1. The blue arrows indicate stimulation, and the red lines indicate inhibition. Processes activated by Foxo1 are labeled in blue, while the processes inhibited by Foxo1 are shown in red. (ACC, acetyl-CoA carboxylase; ACLY, ATP-citrate lyase; AKT, AKR mouse tumor 8 kinase; FAS, fatty acid synthase; G6P, glucose-6-phosphatase; GK, glucokinase; LPK, liver pyruvate kinase; MTTP, microsomal triglyceride transfer protein; PDH, pyruvate dehydrogenase; PEPCK, phosphoenolpyruvate carboxykinase; PGC1α, peroxisome proliferator-activated receptor gamma coactivator-1; SREBP1c, sterol regulatory element-binding protein 1c).
The three members of the PPAR family of nuclear hormone receptors play pleiotropic roles in regulating genes involved in metabolism in many tissues. They may function as targets of insulin signaling, modulators of insulin signaling, or both. Despite overlap in the tissue expression and gene targets of the three PPARs, some general conclusions can be drawn about the function of each. PPARα regulates genes involved in fatty acid catabolism and gluconeogenesis and is most highly expressed in brown fat, heart, liver, kidney, and intestine. PPARβ/Δ is broadly expressed and activates gene programs involved in fatty acid oxidation. PPARγ is most highly expressed in adipose tissue, intestine, and immune cells, but also at lower levels in many other tissues. PPARγ drives white adipocyte differentiation and lipid storage and inhibits production of many of the pro-resistance adipokines and pro-inflammatory cytokines in adipose tissue (see section on insulin resistance later). In macrophages, PPARγ acts to promote their alternative activation to the anti-inflammatory M2 state, rather than the pro-inflammatory M1 state.
The PPARs bind to DNA as heterodimers with the 9-cis–retinoic acid receptor (RXR), and recruit a variety of coactivators and corepressors. PGC1α was originally identified as a coactivator interacting with PPARγ, but the interaction is not exclusive. On different genes PPARγ works with different coactivators, and PGC1α interacts with the other PPARs and many other transcription factors. In collaboration with a variety of different transcription factors in various tissues, PGC1α orchestrates the expression of a set of genes involved in metabolism. PGC1α itself is highly regulated by several signaling pathways including insulin signaling, which inhibits PGC1α activity via phosphorylation by AKT.
A number of natural and synthetic lipids and related compounds can act as PPAR ligands, but the endogenous ligands acting in vivo remain a mystery. The fibrate class of lipid-lowering drugs, used clinically to lower circulating triglyceride levels, act as PPARα ligands. The thiazolidinedione class of insulin-sensitizing drugs, used for the treatment of type 2 diabetes (see later), act as PPARγ ligands.
Deactivation of Insulin Signaling. Once activated by binding to insulin, the insulin receptor and downstream signaling cascades to rapidly deactivate again by several mechanisms. Insulin can simply disengage from the receptor, or the receptor can be internalized and degraded. The receptor and its tyrosine–phosphorylated substrates can be deactivated by specific protein tyrosine phosphatases such as PTP1b. In addition, inhibitory SOCS (suppressor of cytokine signaling) proteins block interactions between the phosphorylated receptor and interacting IRS proteins, direct the ubiquitination and degradation of the IRS proteins, and terminate the activation of downstream components of the signaling pathway. Finally, serine phosphorylation of the insulin receptor and its active substrates by several different serine/threonine kinases, including components of the insulin-signaling pathway such as AKT, blocks insulin signaling. Many of these mechanisms may play a role in the development of insulin resistance (see later).
The major function of insulin is to promote storage of ingested nutrients. Although insulin directly or indirectly affects the function of almost every tissue in the body, the discussion here will be limited to a brief overview of the effects of insulin on the major tissues specialized for energy metabolism: liver, muscle, adipose tissue, and brain. In addition, the paracrine effects of insulin will be discussed briefly.
The effects of the products of endocrine cells on surrounding cells are termed paracrine effects, in contrast to actions that take place at sites distant from the secreting cells, which are termed endocrine effects (see Chapter 1). Paracrine effects of the β and Δ cells on the nearby α cells (see Figure 17–1) are of considerable importance in the endocrine pancreas. Insulin directly inhibits α cell secretion of glucagon. In addition, somatostatin, which Δ cells release in response to most of the same stimuli that provoke insulin release, also inhibits glucagon secretion.
Because glucose stimulates only β and Δ cells (whose products then inhibit α cells) whereas amino acids stimulate glucagon as well as insulin, the type and amounts of islet hormones released during a meal depend on the ratio of ingested carbohydrate to protein. The higher the carbohydrate content of a meal, the lower the amount of glucagon released by any amino acids absorbed. In contrast, a predominantly protein meal results in relatively greater glucagon secretion, because amino acids are less effective at stimulating insulin release in the absence of concurrent hyperglycemia but are potent stimulators of α cells.
| Tissue | Effect of Insulin |
|---|---|
| Liver | Catabolic Pathways Inhibits glycogenolysis Inhibits conversion of fatty acids and amino acids to keto acids Inhibits conversion of amino acids to glucose Anabolic Pathways Promotes glucose storage as glycogen (induces glucokinase and glycogen synthase, inhibits phosphorylase) Increases triglyceride synthesis and VLDL formation |
| Muscle | Protein Synthesis Increases amino acid transport Increases ribosomal protein synthesis Glycogen Synthesis Increases glucose transport Induces glycogen synthethase Inhibits phosphorylase |
| Adipose | Triglyceride Storage |
| Tissue | Lipoprotein lipase is induced by insulin to hydro lyze triglycerides in circulating lipoproteins for delivery of fatty acids to the adipocytes Glucose transport into cell provides glycerol phosphate to permit esterification of fatty acids supplied by lipoprotein transport Intracellular lipase is inhibited by insulin |
| Brain | Decreased appetite Increased energy expenditure |
Liver—The first major organ reached by insulin via the bloodstream is the liver. Insulin exerts its action on the liver in two major ways:
Insulin promotes anabolism—Insulin promotes glycogen synthesis and storage while inhibiting glycogen breakdown. These effects are mediated by changes in the activity of enzymes in the glycogen synthesis pathway (see below). The liver has a maximum storage capacity of 100 to 110 g of glycogen, or approximately 440 kcal of energy.
Insulin increases both protein and triglyceride synthesis and very low density lipoprotein (VLDL) formation by the liver. It also inhibits gluconeogenesis and promotes glycolysis through its effects on the function and expression of key enzymes of both pathways.
Insulin inhibits catabolism—Insulin acts to reverse the catabolic events of the postabsorptive state by inhibiting hepatic glycogenolysis, ketogenesis, and gluconeogenesis.
Muscle—Insulin promotes protein synthesis in muscle by increasing amino acid transport, as well as by stimulating ribosomal protein synthesis. In addition, insulin promotes glycogen synthesis to replace glycogen stores expended by muscle activity. This is accomplished by increasing glucose transport into the muscle cell, enhancing the activity of glycogen synthase, and inhibiting the activity of glycogen phosphorylase. Approximately 500 to 600 g of glycogen are stored in the muscle tissue of a 70-kg man, but because of the lack of glucose 6-phosphatase in this tissue, it cannot be used as a source of blood glucose, except for a small amount produced when the debranching enzyme releases unphosphorylated glucose from branch points in the glycogen polymer, and the glucose indirectly produced via the liver from lactate generated by muscle.
Adipose tissue—Fat, in the form of triglyceride, is the most efficient means of storing energy. It provides 9 kcal/g of stored substrate, as opposed to the 4 kcal/g generally provided by protein or carbohydrate. In the typical 70-kg man, the energy content of adipose tissue is about 100,000 kcal.
Insulin acts to promote triglyceride storage in adipocytes by a number of mechanisms. (1) It induces the production of lipoprotein lipase in adipose tissue (this is the lipoprotein lipase that is bound to endothelial cells in adipose tissue and other vascular beds), which leads to hydrolysis of triglycerides from circulating lipoproteins, thereby yielding fatty acids for uptake by adipocytes. (2) By increasing glucose transport into fat cells, insulin increases the availability of α-glycerol phosphate, a substance used in the esterification of free fatty acids into triglycerides. (3) Insulin inhibits intracellular lipolysis of stored triglyceride by inhibiting intracellular lipase (also called hormone-sensitive lipase). This reduction of fatty acid flux to the liver is a key regulatory factor in the action of insulin to lower hepatic gluconeogenesis and ketogenesis.
Central nervous system—Although the brain is traditionally not considered an insulin-sensitive tissue, and overall glucose utilization by the brain is not acutely regulated by insulin, key regions of the brain can respond to insulin. Insulin signaling via PI3 kinase in key cells in the hypothalamus functions with leptin signaling to decrease appetite and increase energy expenditure (see Chapter 20).
Insulin, along with the counter-regulatory hormones and other circulating enhancers and inhibitors of their actions, coordinates nutrient metabolism in response to the overall needs of the organism. At the level of the individual cell, however, additional mechanisms sense and respond to the local energy state. Among these mechanisms, adenosine monophosphate protein kinase (AMPK) plays a central role. When energy availability falls, the drop in cellular ATP concentration and rise in AMP trigger a conformational change in the trimeric AMPK complex and the subsequent activation of the catalytic domain by the serine/threonine kinase LBK1/STK11. AMPK then drives the production of ATP by activating catabolic pathways and inhibiting synthetic pathways in the cell (Figure 17–8). In muscle, in response to the rise in AMP during exercise, AMPK increases fatty acid oxidation and insulin-independent glucose uptake while inhibiting mTOR and protein synthesis. In the long term, AMPK also drives mitochondrial biogenesis. In liver cells, AMPK blocks fatty acid and triglyceride synthesis while activating fatty acid oxidation, and also inhibits the gluconeogenic program by blocking cAMP activation of gene expression and inhibiting Foxo1/PGC1α-driven expression of the gluconeogenic genes. In brain, AMPK also functions as an energy sensor and plays a role in the regulation of appetite and energy expenditure by the hypothalamus. AMPK has also been implicated in the regulation of insulin secretion by β cells.
Figure 17–8
Regulation and function of AMPK. Proteins that are directly phosphorylated by AMPK are shown in bold font. The blue arrows indicate stimulation, and the red lines indicate inhibition. Processes activated by AMPK are labeled in blue, while the processes inhibited by AMPK are shown in red. (ACC, acetyl-CoA carboxylase; AKT, AKR mouse tumor 8 kinase; CamKK, calcium/calmodulin-dependent protein kinase kinase; eEF2, eukaryotic translation elongation factor 2; FAS, fatty acid synthase; G6P, glucose-6-phosphatase; GPAT, glycerol-3-phosphate acyltransferase, mitochondrial; HK, hexokinase; HMGR, HMG-CoA reductase; LKB1, liver kinase B1; MCD, malonyl-CoA decarboxylase; mTOR, mammalian target of rapamycin; PEPCK, phosphoenolpyruvate carboxykinase; PFK2, 6-phosphofructo-2-kinase/fructose-2,6–bisphosphatase; PGC1α, peroxisome proliferator-activated receptor gamma coactivator-1; PKA, protein kinase A; PP2C, protein phosphatase 2C; SREBP1c, sterol regulatory element–binding protein 1c; Tak1, TGF-beta-activated kinase 1; transducer of regulated cAMP response element-binding protein 2; TSC1/2, tuberous sclerosis 1).
While predominantly an intracellular energy sensor, AMPK increases the sensitivity of cells to insulin, although the mechanisms remain uncertain. AMPK also responds to extracellular signals, and contributes to the regulation of metabolism by many of the adipokines and cytokines (see later) as well as cannabinoids. The biguanide drugs, including metformin, which is used in the treatment of type 2 diabetes, activate AMPK by reducing mitochondrial production of ATP and raising intracellular levels of AMP, and thereby lower blood glucose levels by inhibiting gluconeogenesis.
Glucose oxidation provides energy for most cells and is critical for brain function. Because cell membranes are impermeable to hydrophilic molecules such as glucose, all cells require carrier proteins to transport glucose across the lipid bilayers into the cytosol. Whereas the intestine and kidney have an energy-dependent Na+-glucose cotransporter, all other cells utilize non-energy-dependent transporters that facilitate diffusion of glucose from a higher concentration to a lower concentration across cell membranes. Facilitative glucose transporters (GLUTs) comprise a large family including at least 13 members, although some of the recently identified members of the family have not yet been shown to transport glucose. The first four members of the family are the best characterized, and they have distinct affinities for glucose and distinct patterns of expression.
GLUT 1 is present in all human tissues. It mediates basal glucose uptake, because it has a very high affinity for glucose and, therefore, can transport glucose at the relatively low concentrations found in the fasted state. For this reason, its presence on the surface of the endothelial cells of the brain vascular system (blood–brain barrier) ensures adequate transport of plasma glucose into the central nervous system.
GLUT 3, which is also found in all tissues, is the major glucose transporter on neurons. It also has a very high affinity for glucose and is responsible for transferring glucose into neuronal cells at the lower concentrations found in the central nervous system.
In contrast, GLUT 2 has a lower affinity for glucose and thus increases glucose transport when plasma glucose levels rise, such as postprandially. It is a major transporter of glucose in hepatic, intestinal, and renal tubular cells. The low affinity of GLUT 2 for glucose reduces hepatic uptake of glucose during fasting, while its ability to transport glucose equally efficiently in both directions assists in the export of glucose from hepatocytes. GLUT 2 is also expressed on the surface of the β cells in rodents, but it is not detected at significant levels on human β cells.
GLUT 4 is found in two major insulin target tissues: skeletal muscle and adipose tissue. It is sequestered mainly within an intracellular compartment of these cells and thus does not function as a glucose transporter until insulin signaling causes translocation of GLUT 4 to the cell membrane, where it facilitates glucose entry into these tissues after a meal (see Figure 17–6). In muscle, exercise also drives GLUT 4 translocation to the cell surface by activating AMPK.
Islet amyolid polypeptide (IAPP), or amylin, is a 37 amino acid peptide produced and stored with insulin in pancreatic β cells but only at a low ratio of approximately one molecule of IAPP to 100 of insulin. β Cells cosecrete IAPP with insulin in response to glucose and other β cell secretagogues. Although it plays a role in regulating gut physiology by decreasing gastric emptying and gut motility after meals, the full physiologic functions of IAPP remain uncertain. A soluble analog of IAPP called pramlintide has been approved for use in patients with type 1 diabetes and insulin-treated type 2 diabetes (see later).
IAPP produces amyloid deposits in pancreatic islets of most patients with type 2 diabetes of long duration. These amyloid deposits are insoluble fibrillar proteins generated from IAPP oligomers that encroach on and may even occur within pancreatic β cells. Islets of nondiabetic elderly persons may contain less extensive amyloid deposits. Whether amyloid fibrils and deposition contributes to the islet dysfunction and β cell loss seen in type 2 diabetes or is simply a consequence of disordered and hyperstimulated islet function remains an unresolved question.
Pancreatic glucagon, along with several other biologically active peptides, derives from the large proglucagon peptide encoded by the preproglucagon gene located on human chromosome 2. Tissue-specific proteases (the prohormone convertases) cleave different sets of peptide products from the proglucagon molecule in the endocrine l-cells of the gut and the α cells in the islet (Figure 17–9). The activity of prohormone convertase 2 in α cells generates the glucagon peptide, along with the amino–terminal glicentin-related peptide, a small central hexapeptide, and a large carboxyl-terminal fragment.
Glucagon consists of 29 amino acids in a single-chain polypeptide with a molecular weight of 3485. In healthy humans, the average fasting plasma immunoreactive glucagon level is 75 pg/mL (25 pmol/L). Only 30% to 40% of this is actually pancreatic glucagon, the remainder being a heterogeneous composite of higher-molecular-weight molecules with glucagon immunoreactivity such as proglucagon, glicentin, and oxyntomodulin. Circulating glucagon has a half-life of 3 to 6 minutes due to removal by the liver and kidney.
In contrast to its stimulation of insulin secretion, glucose inhibits glucagon secretion. Conflicting data surround the question of whether glucose directly inhibits secretion from the α cell or whether it only acts via release of insulin and somatostatin from the β and Δ cells, both of which inhibit the α cell directly. In addition, because β cells release gamma-aminobutyric acid (GABA) and α cells express inhibitory GABA receptors, GABA also may participate in the inhibition of α cells during β cell stimulation.
Many amino acids stimulate glucagon release, although they differ in their ability to do so. Some, such as arginine, release both glucagon and insulin; others (eg, alanine) stimulate primarily glucagon release. Leucine, an effective stimulant of insulin release, does not stimulate glucagon. Other substances that promote glucagon release include catecholamines, gastrointestinal hormones (cholecystokinin [CCK], gastrin, and gastric inhibitory polypeptide [GIP]), and glucocorticoids. Both sympathetic and parasympathetic (vagal) stimulation promote glucagon release, especially in response to hypoglycemia. High levels of circulating fatty acids suppress glucagon secretion.
In contrast to insulin, which promotes energy storage in a variety of tissues in response to feeding, glucagon provides a humoral mechanism for delivering energy from the liver to the other tissues between meals. The ratio of insulin to glucagon affects key target tissues by regulating the expression and activity of key enzymes controlling nutrient metabolism and, thereby, controlling the flux of these nutrients into or out of storage.
The liver, because of its connection to the pancreas via the portal vein, represents the major target organ for glucagon, with portal vein glucagon concentrations reaching as high as 300 to 500 pg/mL (100-166 pmol/L) during fasting. It is unclear whether physiologic levels of glucagon affect tissues other than the liver. Glucagon signals through the glucagon receptor, a G protein–coupled receptor (GPCR) of the Gαs class found predominantly on the surface of hepatocytes. Binding of glucagon to its receptor in the liver activates adenylyl cyclase and the generation of cAMP, which in turn mediates the phosphorylation or dephosphorylation of key enzymes regulating nutrient metabolism. In addition, like insulin, glucagon receptor signaling modifies the activity of a set of cAMP responsive transcriptional regulators that in turn control the expression of the genes encoding these same enzymes.
Glucagon signaling in the liver stimulates the breakdown of stored glycogen, maintains hepatic output of glucose from amino acid precursors (gluconeogenesis), and promotes hepatic output of ketone bodies from fatty acid precursors (ketogenesis). Glucagon facilitates the uptake of the gluconeogenic substrate alanine by liver, and directs fatty acids away from reesterification to triglycerides and toward ketogenic pathways. In sum, glucagon signaling results in the net release of readily available energy stores from the liver in the form of glucose and ketones.
In the intestinal l-cells, found predominantly in the distal ileum and colon, prohormone convertase 1 generates a different set of peptides from the proglucagon molecule, including glicentin, glicentin-related polypeptide (GRPP), oxyntomodulin, and the two glucagon-like peptides GLP-1 and GLP-2 (see Figure 17–9). Several biological activities have been attributed to glicentin and oxyntomodulin based on studies using high concentrations of the peptides, but all these actions can be explained by low-affinity interactions with the receptors for glucagon, GLP-1 and GLP-2. Specific receptors for glicentin and oxyntomodulin have not been identified, and it remains uncertain whether these peptides play any biological role at physiologic concentrations. GRPP also has no clearly established biological activity. The other two gut–derived glucagon-related peptides, GLP-1 and GLP-2, however, play important roles in nutrient metabolism and gastrointestinal physiology (Table 17–4).
| Target Tissue | Glucagon | GLP-1 | GLP-2 | GIP |
|---|---|---|---|---|
| Islet | Stimulates insulin secretion | Stimulates insulin and somatostatin secretion Inhibits glucagon secretion (indirectly) Increases β cell mass by inhibiting β cell death and inducing β cell proliferation | Stimulates insulin, somatostatin, and glucagon secretion Inhibits glucagon secretion (indirectly) Increases β cell mass by inhibiting β cell death and inducing β cell proliferation | |
| Liver | Stimulates glycogenolysis, glucogenesis, fatty acid oxidation, and ketogenesis Inhibits glycogen synthesis and fatty acid synthesis | |||
| Stomach | Inhibits gastric acid secretion Inhibits gastric emptying | Inhibits gastric acid secretion and gastric emptying | ||
| Intestine | Stimulates mucosal growth and nutrient absorption Inhibits motility | |||
| Adipose tissue | Stimulates adipogenesis, lipogenesis, and adipokine production | |||
| Brain (hypothalamus) | Inhibits appetite |
There are two active forms of GLP-1: GLP-1(7-36) amide, and GLP-1(7-37). The intestinal l-cells secrete GLP-1 in response to meals, through dietary glucose and lipids and parasympathetic stimulation. The l-cells sense dietary fat in the gut lumen in part through the GPR119 receptor, which binds the long chain fatty acid derivative oleoylethanolamide. GPR119 is also expressed on the surface of the β cells. GLP-1 binds to the GLP-1 receptor, a GPCR similar to the glucagon receptor. The ubiquitous protease dipeptidyl peptidase 4 (DPP-4) rapidly inactivates circulating GLP-1 (half-life <2 min) by removing the two amino-terminal amino acids. Pancreatic islets are major targets of GLP-1 action. GLP-1 directly stimulates the production and secretion of insulin and somatostatin, and thereby indirectly inhibits the secretion of glucagon. In addition, GLP-1 protects the β cells from destruction and stimulates β cell growth. Other targets of GLP-1 include the stomach, where the peptide inhibits gastric emptying and gastric acid secretion; the brain, where it inhibits appetite and induces weight loss; and the heart, where it has some protective effects.
Along with GLP-1, intestinal l-cells cosecrete GLP-2 in response to eating; and like GLP-1, GLP-2 binds to a specific GPCR closely related to the glucagon and GLP-1 receptors. DPP-4 also inactivates GLP-2. GLP-2 signaling predominantly targets the intestine, where it stimulates mucosal growth and nutrient absorption and inhibits motility.
The K cells in the duodenum and jejunum produce a related 42 amino acid incretin peptide, GIP, that has both functional and sequential similarity to GLP-1, but is the product of a distinct gene and binds to a distinct receptor, GIPR, which also belongs to the family of glucagon-related Gαs-linked receptors. The K cells secrete GIP in response to glucose—via the same pathway used by the β cell (see Figure 17–5)—and lipids. Interestingly, the GIP prepropeptide is also expressed in α cells, but prohormone convertase 2 in α cells produces a shorter peptide, GIP1-30, which lacks the 12 carboxyl amino acids present in intestinal GIP1–42. The two forms of GIP appear to function identically. GIP signaling through its receptor has similar effects to those of GLP-1 on the stomach and β cells. α Cells also express the GIP receptor, through which GIP directly stimulates glucagon secretion; but GIP concomitantly suppresses glucagon secretion indirectly through its stimulation of insulin secretion. The GIP receptor is also expressed in adipose tissue and bone. In adipose tissue, GIP plays an important role in the differentiation of new adipocytes, and also drives lipogenesis and adipokine production in mature adipocytes. In bone, GIP stimulates the osteoblasts and increases bone density.
The pancreatic Δ cells transcribe the gene for somatostatin on the long arm of chromosome 3. It codes for a 116 amino acid peptide, preprosomatostatin, from whose carboxyl end is cleaved the hormone somatostatin, a 14 amino acid cyclic polypeptide with a molecular weight of 1640 (Figure 17–10). First identified in the hypothalamus, it owes its name to its ability to inhibit the release of growth hormone (GH; pituitary somatotropin). Since that time, somatostatin has been found in a number of tissues, including many areas of the brain and peripheral nervous system, the endocrine D cells in the epithelial lining of the stomach and intestine, and the Δ cells in the pancreatic islets. In neurons, gastric D cells and the islet, somatostatin-14 predominates, but approximately 5% to 10% of the somatostatin-like immunoreactivity in the brain consists of a 28 amino acid peptide, somatostatin-28. Somatostatin-28 consists of an amino terminal region of 14 amino acids and a carboxyl terminal segment containing somatostatin-14. In small intestine, the larger molecule predominates, with 70% to 75% of the hormone in the 28 amino acid form and only 25% to 30% as somatostatin-14. Somatostatin-28 is 10 times more potent than somatostatin-14 in inhibiting growth hormone and insulin secretion, whereas somatostatin-14 is more effective in inhibiting glucagon release.
Most known stimulators of insulin release also promote somatostatin release from Δ cells. This includes glucose, arginine, gastrointestinal hormones, and sulfonylureas. The importance of circulating somatostatin is unclear; the major action of this peptide appears to be paracrine regulation of the pancreatic islet and the gastrointestinal tract. Physiologic levels of somatostatin in humans seldom exceed 80 pg/mL (49 pmol/L). The metabolic clearance of exogenously infused somatostatin in humans is extremely rapid; the half-life of the hormone is less than 3 minutes.
Molecular cloning has identified five somatostatin receptors (SSTR1-5), all of which are GPCRs. They vary in size from 364 to 418 amino acids (with 105 amino acids invariant) and function in the central nervous system and a wide variety of peripheral tissues, including the pituitary gland, the small intestine, and the pancreas. All five receptors belong to the Gαi class and inhibit the activity of adenylate cyclase, thereby lowering intracellular levels of cAMP and inhibiting cAMP-activated secretion. In addition, however, each of the different somatostatin receptors interacts with additional distinct downstream effectors that modify the cellular consequences of receptor activation. Binding of ligand to SSTR5 on β cells mediates the inhibition of insulin secretion, whereas inhibition of GH release from pituitary somatotrophs as well as glucagon release from α cells of the pancreas works through SSTR2. This explains why an analog of somatostatin, octreotide, which has a much greater affinity for SSTR2 than for SSTR5, is effective in correcting GH excess without having much effect on carbohydrate tolerance when used to treat acromegaly.
Somatostatin acts in several ways to restrain the movement of nutrients from the intestinal tract into the circulation. It prolongs gastric emptying time, decreases gastric acid and gastrin production, diminishes pancreatic exocrine secretion, decreases splanchnic blood flow, and retards xylose absorption.
PP is found in PP cells located chiefly in islets in the posterior portion of the head of the pancreas. Similar to the other islet hormones, PP derives from a larger prepropeptide of 85 amino acids that is cleaved to a single 36 amino acid peptide with a molecular weight of 4200. Circulating levels of the peptide increase in response to a mixed meal; however, intravenous infusion of glucose or lipid does not produce such a rise, and intravenous amino acids induce only a small increase. In contrast, vagotomy abolishes the response to an ingested meal, demonstrating that PP secretion responds predominantly to neural, rather than nutrient signals.
In healthy subjects, basal levels of PP average 24 ± 4 pmol/L and may become elevated owing to a variety of factors including old age, alcohol abuse, diarrhea, chronic renal failure, hypoglycemia, or inflammatory disorders. Values above 300 pmol/L are found in most patients with pancreatic endocrine tumors such as glucagonoma or vasoactive intestinal polypeptide-secreting tumor and in all patients with tumors of the pancreatic PP cell. As many as 20% of patients with insulinoma and one-third of those with gastrinomas also have plasma concentrations of PP that are greater than 300 pmol/L.
Although it has been implicated in the regulation of exocrine pancreatic secretion and gall bladder contraction, the physiologic actions of PP remain uncertain.
The peptide hormone ghrelin was originally identified in extracts from the stomach based on its ability to bind to and activate the growth hormone secretagogue receptor (GHSR) and stimulate growth hormone release from the pituitary. The P/D1 endocrine cells in the gastric mucosa and the ε cells in the islet make ghrelin, as do a few cells in the heart, lung, kidney, immune system, hypothalamus, and pituitary. The human GHRELIN gene comprises four exons, and the major splice product encodes the 117 amino acid preproghrelin peptide. Processing in the ε cells yields the active form of ghrelin: a 28 amino acid peptide (amino acids 24-51 of preproghrelin) with the serine in position 3 modified by the attachment of an octanoyl side chain. Full biological activity requires the n-octanoyl modification. In addition, protease cleavage generates a second peptide, obestatin (amino acids 76-98 of preproghrelin) of less certain biological function.
Initially identified as a stimulator of growth hormone secretion, ghrelin signals through its receptor, the previously identified GHSR, which is a GPCR found in a variety of tissues, including the hypothalamus, pituitary, intestine, and islet. Ghrelin signaling stimulates growth hormone secretion directly through its receptor on pituitary somatotrophs, and also through its stimulation of hypothalamic GHRH secretion. In addition, Ghrelin induces gastric emptying and acid secretion and regulates appetite and energy balance via neurons in the arcuate nucleus of the hypothalamus (see Chapter 20). The role of ghrelin signaling in the pancreas, and the relative contribution of islet-derived ghrelin to the overall actions of ghrelin remains unresolved.
Diabetes Mellitus
Clinical diabetes mellitus is a syndrome of disordered metabolism with inappropriate hyperglycemia due to an absolute or relative deficiency of insulin. There may also be a defect in insulin action (insulin resistance).
Diabetes is classified into four main groups based on known pathological and etiologic mechanisms—type 1, type 2, other specific types, and gestational diabetes (Table 17–5). Type 1 diabetes (previously referred to as juvenile-onset or insulin dependent diabetes mellitus [IDDM]) results from pancreatic islet β cell destruction most commonly by an autoimmune process. These patients are prone to developing ketoacidosis and require insulin replacement. Type 2 diabetes (previously referred to as adult-onset or non-insulin-dependent diabetes mellitus [NIDDM]), the most prevalent form of diabetes, is a heterogeneous disorder most commonly associated with insulin resistance in the presence of an associated impairment in compensatory insulin secretion.
| Type 1 diabetesa (β cell destruction, usually leading to absolute insulin deficiency) |
| A. Immune-mediated, type 1a |
| B. Idiopathic, type 1b |
| II. Type 2 diabetesa (may range from predominantly insulin resistance with relative insulin deficiency to a predominantly secretory defect with minimal insulin resistance) |
| III. Other specific types |
| A. Autosomal dominant genetic defects of pancreatic β cells |
| 1. Maturity onset diabetes of the young (MODY) |
| 2. Insulin gene (INS) |
| 3. ATP-sensitive potassium channel (KCNJ11 and ABBC8) |
| B. Other genetic defects of pancreatic β cells |
| 1. Autosomal recessive genetic defects |
| 2. Mitochrondrial DNA |
| 3. Ketosis-prone diabetes (KPD) |
| C. Genetic defects in insulin action |
| 1. Insulin receptor mutations |
| 2. Lipoatrophic diabetes |
| D. Neonatal diabetes |
| 1. Transient |
| 2. Permanent |
| E. Diseases of the exocrine pancreas |
| 1. Pancreatitis |
| 2. Trauma, pancreatectomy |
| 3. Neoplasia |
| 4. Cystic fibrosis |
| 5. Hemochromatosis |
| 6. Fibrocalculous pancreatopathy |
| F. Endocrinopathies |
| 1. Acromegaly |
| 2. Cushing syndrome |
| 3. Glucagonoma |
| 4. Pheochromocytoma |
| 5. Hyperthyroidism |
| 6. Somatostatinoma |
| 7. Aldosteronoma |
| G. Drug- or chemical-induced |
| 1. β cell toxicity: vacor, pentamidine, cyclosporine |
| 2. β cell autoimmunity: α-interferon |
| 3. β cell dysfunction: thiazide and loop diuretics, diazoxide, α agonists, β blockers, phenytoin, opiates |
| 4. Insulin resistance: glucocorticoids, progesterone, nicotinic acid, thyroid hormone, β blockers, atypical antipsychotic drugs, antiretroviral protease inhibitors |
| H. Infections |
| 1. Congenital rubella |
| 2. Other viruses: cytomegalovirus, coxsackievirus B, adenovirus, mumps |
| I. Uncommon forms of immune-mediated diabetes |
| 1. Stiff-person syndrome |
| 2. Immunodysregulation polyendocrinopathy enteropathy,X-linked (IPEX) |
| 3. Autoimmune polyendocrinopathy syndrome type 1 |
| 4. Anti-insulin receptor antibodies |
| 5. Ataxia telangiectasia syndrome (antireceptor antibodies) |
| 6. POEMS syndrome |
| J. Other genetic syndromes sometimes associated with diabetes |
| 1. Chromosomal defects: Down, Klinefelter, and Turner syndromes |
| 2. Neuromuscular syndromes: Friedreich ataxia, Huntington chorea, myotonic dystrophy, porphyria, and others |
| 3. Obesity syndromes: Laurence-Moon-Biedl, Bardet-Biedl, Prader-Willi syndromes, and others |
| 4. Wolfram syndrome |
| IV. Gestational diabetes mellitus (GDM) |
Type 1 diabetes is immune-mediated in more than 95% of cases (type 1a) and idiopathic in less than 5% (type 1b). The rate of pancreatic β cell destruction may vary, but in most cases the process is prolonged, extending over months or years, since evidence for an immune response can be detected long in advance of hyperglycemia in patients that eventually develop type 1 diabetes. It is a catabolic disorder in which circulating insulin is virtually absent, plasma glucagon is elevated, and the pancreatic β cells fail to respond to all known insulinogenic stimuli. In the absence of insulin, the three main target tissues of insulin (liver, muscle, and fat) not only fail to appropriately take up absorbed nutrients but continue to deliver glucose, amino acids, and fatty acids into the bloodstream from their respective storage depots. Furthermore, alterations in fat metabolism lead to the production and accumulation of ketones. This inappropriate persistence of the fasted state postprandially can be reversed by the administration of insulin.
The incidence of type 1 diabetes varies widely in different populations. Scandinavia and northern Europe have the highest incidence of type 1 diabetes: the yearly incidence per 100,000 youngsters 14 years of age or less is as high as 40 in Finland, 31 in Sweden, 22 in Norway, 27 in Scotland, and 20 in England. The incidence of type 1 diabetes generally decreases across the rest of Europe to 11 in Greece and 9 in France. Surprisingly, the island of Sardinia has as high an incidence as Finland, even though in the rest of Italy, including the island of Sicily, the incidence is only 11 per 100,000 per year. The United States averages 16 per 100,000. The lowest incidence of type 1 diabetes worldwide is less than 1 per 100,000 per year in China and parts of South America.
Worldwide incidence of type 1 diabetes continues to increase steadily. In Finland, the incidence has more than tripled since 1953, when it was 12/100,000/year, with an average increase of 2.4% per year. The EURODIAB study group reported recently 0.6 % to 9.3 % annual increases in incidence of type 1 diabetes in children younger than 15 years in various European countries. The most rapid increases have occurred in low-prevalence countries and in younger patients. Changes in environmental factors most likely explain this increased incidence.
Latent autoimmune diabetes of adulthood (LADA): Type 1 diabetes can present at any age, although peaks in incidence occur before school age and again at around puberty. Older adults often present with a more indolent onset that sometimes leads to misdiagnosis and has led to the use of the term latent autoimmune diabetes of adulthood (LADA) to distinguish these patients. These initially unrecognized patients may retain enough β cell function at the outset to avoid ketosis, but develop increasing dependence on insulin therapy over time as their β cell mass diminishes. Islet cell antibody surveys among northern Europeans indicate that up to 15% of patients previously diagnosed with type 2 diabetes may actually have LADA.
Most patients with type 1 diabetes at diagnosis have circulating antibodies against β cell proteins: islet cell antibodies (ICA), insulin autoantibodies (IAA), and antibodies to glutamic acid decarboxylase 65 (GAD), tyrosine phosphatase IA2 (ICA512), and zinc transporter 8 (ZnT8) (Table 17–6). These autoreative antibodies can often be detected well before the onset of frank hyperglycemia, even decades earlier, providing evidence that the autoimmune process may be prolonged. After diagnosis, autoantibody levels often decline with increasing duration of the disease. Also, once patients are treated with insulin, low levels of IAA develop, even in patients that do not have an autoimmune etiology for their diabetes.
| Sensitivity | Specificity | |
|---|---|---|
| Glutamic acid decarboxylase (GAD65) | 70%-90% | 99% |
| Insulin (IAA) | 40%-70% | 99% |
| Tyrosine phosphatase IA2 (ICA512) | 50%-70% | 99% |
| Zinc transporter 8 (ZnT8) | 50%-70% | 99% |
Although useful for diagnosing and predicting type 1 diabetes, antibodies against β cell proteins do not directly cause the destruction of β cells in type 1 diabetes. Instead, it is the cellular immune system, the T lymphocytes, that infiltrate the islets (a process called insulitis) and destroy the β cells. At the time of diagnosis, the islets of patients with type 1 diabetes are extensively infiltrated with both helper and cytotoxic T lymphocytes.
Normally, the thymus deletes autoreactive T cells during development so that the immune system becomes tolerant of self–antigens. In addition, certain specialized T cells, the regulatory T cells, further prevent attacks against healthy tissues by retraining the activity of any autoreactive cytotoxic and helper T cells that escape the thymus. Type 1 diabetes results from a breakdown in these processes of self-tolerance in the immune system.
Type 1b diabetes: Approximately 5% of patients with the clinical features of type 1 diabetes lack serum evidence of auto-immunity. Some of these individuals have high risk HLA haplotypes (see later) and may have T-cell–mediated β cell destruction in the absence of measurable levels of the known autoantibodies. Others in this group have low-risk HLA haplotypes, and appear to have a nonautoimmune cause for loss of β cell function. Such nonautoimmune type 1 diabetes has been referred to as type 1b diabetes, but a variety of terms has been used. This probably represents a heterogeneous group of disorders that lead to profound β cell dysfunction or loss, absolute insulin deficiency and a syndrome clinically similar to autoimmune type 1a diabetes. Under the accepted classification system, as specific disorders within this subgroup become defined and the genetic or environmental causes are identified, these disorders become reclassified within the group of “Other Specific Types of Diabetes.”
Included within this group are patients that present with a course of relapsing diabetic ketoacidosis with intervening normoglycemia that eventually progresses to permanent insulin-deficient diabetes. This disorder, ketosis prone diabetes (KPD, see later), has also been referred to as type 1b diabetes, and may result from unknown environmental insults combined with genetic defects in the β cell.
Autoimmune diabetes and stiff person syndrome: GAD antibodies, the first identified in type 1 diabetes, remain among the most clinically useful. Human pancreatic β cells produce GAD65, which functions as an enzyme that catalyzes the synthesis of GABA from glutamate. GAD65 and the closely related isoform GAD67 are also found in central nervous system inhibitory neurons that secrete GABA. Some patients with GAD antibodies develop a rare neurologic condition, stiff person syndrome, caused by the depletion of GABA in the central nervous system and characterized by progressive rigidity and fluctuating muscle spasms. Approximately half of the patients with stiff person syndrome develop type 1 diabetes.
The vast majority of patients with type 1 diabetes do not develop symptoms of stiff person syndrome, despite the presence of GAD antibodies. The rare patients that develop the syndrome usually have much higher titers of GAD antibodies than typical patients with type 1 diabetes alone.
Family members of patients with type1 diabetes have an increased lifetime risk of developing type 1 diabetes. The offspring of a mother with type 1 diabetes have a risk of 3%, whereas the risk is 6% for children of affected fathers. The risk in siblings of affected individuals is related to the number of human leukocyte antigen (HLA) haplotypes (see later) that the sibling shares. If one haplotype is shared, the risk is 6% and if two haplotypes are shared, the risk increases to 12% to 25%. For monozygotic twins, the concordance rate reaches 25% to 50%. Although these data demonstrate a strong genetic contribution to the risk of type 1 diabetes, genetics plays an even larger role in type 2 diabetes, and environment also clearly contributes substantially to the risk of type 1 diabetes.
Genes in the major histocompatibility (MHC) locus on the short arm of chromosome 6 explain at least half of the familial aggregation of type 1 diabetes. Within the MHC locus lie a number of closely packed genes involved in the function and regulation of the immune response. Although a number of genes within the MHC locus have been linked to the risk of developing type 1 diabetes, the most important of these are the genes encoding the HLA class II molecules DQ and DR. The professional antigen-presenting cells—dendritic cells, macrophages and B lymphocytes—use the class II molecules on their cell surface to present peptide antigens to T lymphocytes through the T-cell receptor. T cells activated by antigen-presenting cells carry out the β cell destruction that leads to type 1 diabetes. Although exact mechanisms remain uncertain, the variations in the amino acid sequence of individual HLA class II molecules may impact their ability to present specific self-peptides to T cells either in the process of central or peripheral tolerization or later during the development of the autoimmune response, thereby contributing to the risk of developing type 1 diabetes.
The DR haplotypes DR3 and DR4 are major susceptibility risk factors for type 1 diabetes. As many as 95% of type 1 diabetic patients have a DR3 or a DR4 haplotype—or both—compared with 45% to 50% of Caucasian nondiabetic controls. Individuals who express both a DR3 and a DR4 allele carry the highest risk for type 1 diabetes in the United States.
The high-risk DR genes are generally in linkage disequilibrium with DQ genes that themselves confer high risk, particularly DQA1*0501, DQB1*0201 (coupled with DR3), and DQA1*0301, DQB1*0302 (coupled with DR4). DQ alleles are associated not only with risk for type 1 diabetes but also with dominant protection, often in linkage with HLA-DR2. The most protective of these—and a quite common allele—is DQA1*0102, DQB1*0602. It occurs in over 20% of individuals in the United States but in less than 1% of children who develop type 1 diabetes.
An independent genetic link to chromosome 11 has also been identified in type 1 diabetes. Studies of a polymorphic DNA locus flanking the 5′ region of the insulin gene on chromosome 11 revealed a small but statistically significant linkage between type 1 diabetes and this genetic locus in a Caucasian population with type 1 diabetes. This polymorphic locus, which consists of a variable number of tandem repeats (VNTRs) with two common sizes in Caucasians, small (26-63 repeats) or large (140-243 repeats), does not encode a protein. An intriguing proposal to explain how the VNTR might influence susceptibility to type 1 diabetes was based on findings that insulin gene transcription is facilitated in the fetal thymus gland by the presence of the large allele of the VNTR locus flanking the insulin gene. The large VNTR allele might produce a dominant protective effect by promoting negative selection (deletion) by the thymus of insulin-specific T lymphocytes that play a critical role in the immune destruction of pancreatic β cells.
The established genetic association with the MHC region of chromosome 6 contributes much more (about 50%) to the genetic susceptibility to type 1 diabetes than does this locus flanking the insulin gene on chromosome 11, which contributes about 10%. Both candidate gene studies and genome-wide association studies (GWAS) have identified a number of additional risk loci that make smaller contributions to the genetic risk of type 1 diabetes. Many of the genes linked to these additional loci also play important roles in the function and regulation of the immune response.
Mutations in two genes involved in T-cell tolerance cause rare syndromes of type 1 diabetes together with other autoimmune diseases. In the autosomal recessive disease autoimmune polyglandular syndrome type 1 (APS1; see Chapter 2), homozygous mutations in the gene encoding the autoimmune regulator (AIRE) prevent the expression of certain self-proteins in the thymus, thus allowing mature autoreactive T cells to leave the thymus. In addition to other autoimmune diseases and mucocutaneous candidiasis, approximately 20% of patients with APS1 develop type 1 diabetes. The second gene, FOXP3, found on the X chromosome, encodes a transcription factor required for the formation of regulatory T cells. Mutations in FOXP3 cause immunodysregulation polyendocrinopathy enteropathy X-linked (IPEX) syndrome. IPEX presents in male patients with very early onset type 1 diabetes, often neonatal, combined with other autoimmune endocrinopathies, autoimmune skin disorders, diarrhea secondary to autoimmune enteropathy, and frequent severe infections.
While genetic inheritance may play an important role in causing type 1 diabetes, the monozygotic twin studies demonstrate that other causes, stochastic or environmental, are at least as important. Most individuals with type 1 diabetes do not have other family members with the disease. Environmental factors associated with increased risk of type 1 diabetes include viruses (mumps, congenital rubella, Coxsackie virus B4), toxic chemical agents such as vacor (a nitrophenylurea rat poison), and other destructive cytotoxins such as hydrogen cyanide from spoiled tapioca or cassava root. How these environmental insults lead to type 1 diabetes is unknown; they may directly damage β cells in some cases, or may act as initiators or accelerators of the autoimmune attack on the β cells. In some cases, molecular mimicry, wherein the immune system mistakenly targets β cell proteins that share homologies with certain viral or other foreign peptides may play a role.
Epidemiological studies have demonstrated an association between breast-feeding in the first 6 months of life and protection from type 1 diabetes. While it has been suggested that proteins in cow’s milk may be the culprits, the strongest evidence supports the idea that human breast milk may reduce the risk of autoimmune disease.
Accumulating evidence shows that in the process of modernizing and improving public health, the risk of type 1 diabetes has increased, possibly due to the removal of some protective factors. Type 1 diabetes is almost unheard of in many third-world countries, and has its highest incidence in countries with the best public health systems, such as the Scandinavian countries. In addition, the incidence of the disease has been steadily increasing over the past century in western and westernizing countries and is especially high among the more affluent. This has led to the suggestion that a dirty environment, one with more infections (especially more parasitic diseases) and more antigen exposure, may reduce the risk of type 1 disease.
Type 2 diabetes mellitus—previously called non-insulin–dependent diabetes or adult-onset diabetes mellitus—results from relative insulin deficiency, in contrast to the absolute insulin deficiency of patients with type 1 diabetes. Type 2 diabetes is a heterogeneous disorder and probably represents a large number of different primary genetic and environmental insults leading to relative insulin deficiency—a mismatch between insulin production and insulin requirements. Clinically, patients with type 2 diabetes can range from those with severe insulin resistance and minimal insulin secretory defects to those with a primary defect in insulin secretion.
Type 2 diabetes accounts for 80% to 90% of cases of diabetes in the United States. These patients commonly present as adults with some degree of obesity, although increasing rates of obesity are leading to earlier onset of the disease in adolescents and children. At onset, most patients with type 2 diabetes do not require insulin to survive, but over time their insulin secretory capacity tends to deteriorate, and many eventually need insulin treatment to achieve optimal glucose control. Ketosis seldom occurs spontaneously, and if present, it is a consequence of severe stress from trauma or infection.
Most patients with type 2 diabetes, irrespective of weight, have some degree of tissue insensitivity to insulin attributable to several interrelated factors (Table 17–7). These include putative (mostly as yet undefined) genetic factors, which are aggravated in time by further enhancers of insulin resistance such as aging, a sedentary lifestyle, and abdominal visceral obesity. Not all patients with obesity and insulin resistance develop hyperglycemia, however. An underlying defect in the ability of the β cells to compensate for the increased demand determines which patients will develop diabetes in the setting of insulin resistance. Furthermore, both the tissue resistance to insulin and the impaired β cell response to glucose appear to be further aggravated by sustained hyperglycemia, which may impede both insulin signaling and β cell function. Treatment that reduces the blood glucose levels toward normal reduces this acquired defect in insulin resistance and may also improve glucose-induced insulin release to some degree, although the long-term decline in β cell function continues.
| Pre-receptor | Insulin autoantibodies Reduced transendothelial transit |
| Primary defect in insulin signaling | Insulin receptor mutations Leprechaunism (complete) Rabson-Mendenhall syndrome (partial) Type A (mild) Defects in other genes involved in insulin signaling Insulin receptor autoantibodies (Type B) Ataxia telangectasia syndrome |
| Secondary to other endocrine disorders | Cushing syndrome Acromegaly Pheochromocytoma Glucagonoma Hyperthyroidism Insulinoma |
| Secondary to other disorders | Visceral obesity Stress (infection, surgery, etc) Uremia Hyperglycemia (mild resistance seen intype 1 diabetes) Liver disease Cytogenetic disorders (Down, Turner, Klinefelter) Neuromuscular disorders (muscular dystrophies, ataxias, muscle inactivity) Congenital lipodystrophies/lipoatrophy Acquired lipodystrophy |
| Secondary to normal physiologic states | Puberty Pregnancy Starvation |
| Secondary to medications | Glucocorticoids Atypical antipsychotic drugs Antiretroviral protease inhibitors Nicotinic acid Thiazide diuretics Oral contraceptive Progesterone β blockers |
Type 2 diabetes frequently goes undiagnosed for many years because the hyperglycemia may develop quite gradually and without initial symptoms. Despite this mild presentation, these patients develop microvascular, and, especially, macrovascular complications. Furthermore, as noted above, patients with type 2 diabetes suffer from a progressive decline in β cell capacity, leading to worsening hyperglycemia over time.
The majority of people with type 2 diabetes have excess adiposity, although the prevalence of obesity in association with type 2 diabetes varies among different racial groups. Sixty to eighty percent of North Americans, Europeans, or Africans with type 2 diabetes and close to 100% of individuals with type 2 disease among Pima Indians or Pacific Islanders from Nauru or Samoa have obesity as defined by body mass index (BMI, see Chapter 20), while as few as 30% of Chinese and Japanese patients with type 2 diabetes are obese. However, many of those individuals with type 2 diabetes who do not meet BMI criteria for obesity have a predominantly abdominal distribution of fat, producing an abnormally high waist to hip ratio. Increases in visceral adiposity correlate with increased insulin resistance.
Insulin resistance can be broadly defined as a decrease in tissue responsiveness to insulin. Clinically it can be assessed directly by measuring the ability of a fixed dose of insulin to promote total body glucose disposal. It can be assessed indirectly by measuring fasting insulin levels. An increase in insulin levels with normal plasma glucose indicates insulin resistance.
As adiposity increases, especially abdominal visceral fat deposits, total body insulin sensitivity decreases. Since adipose tissue only removes a small fraction of plasma glucose, clearly the increased adipose fat stores impact total body insulin sensitivity through effects on other tissues, especially muscle and liver, causing them to decrease insulin-stimulated glucose disposal. The exact means by which fat storage in adipocytes affects the insulin sensitivity of other cells remains uncertain, but experimental evidence suggests several possible mechanisms.
Abnormalities of insulin receptors—in concentration, affinity, or both—affect insulin action. Target tissues downregulate the number of insulin receptors on the cell surface in response to chronically elevated circulating insulin levels, probably by increased intracellular degradation. When insulin levels are low, on the other hand, receptor binding is upregulated. Conditions associated with high insulin levels and lowered insulin binding to the receptor include obesity, high intake of carbohydrates, and chronic exogenous overinsulinization. Conditions associated with low insulin levels and increased insulin binding include exercise and fasting. The insulin receptor itself is probably not the major determinant of insulin sensitivity under most circumstances, however. Clinically relevant insulin resistance most commonly results from defects in postreceptor intracellular signaling pathways.
Adipokines. Adipose tissue can affect the insulin sensitivity of other tissues through the secretion of signaling molecules, adipokines, that inhibit (TNF-α, IL-6, leptin, resistin, and others) or enhance (adiponectin) insulin signaling locally or in distal target tissues (see Chapter 20). Levels of fat storage in adipocytes, along with insulin signaling itself, regulate the production and secretion of many of the adipokines. Some of these mediators of insulin resistance may reduce insulin signaling by blocking access of insulin to target tissues through reduced transendothelial transit. However, most evidence suggests that the secreted adipokines influence insulin signaling in distant tissues through effects on postreceptor intracellular signaling pathways. Potential intracellular effectors include protein tyrosine phosphatases that dephosphorylate the receptor and pathway components, inhibitors such as the SOCS proteins that block receptor–IRS interactions, and serine/threonine kinases that inhibit the receptor and substrates through serine phosphorylation.
Free fatty acids and ectopic lipid storage. The release of fatty acids by the engorged adipocytes (especially visceral adipocytes, from which fatty acids are more readily mobilized) may play a role in the development of insulin resistance as well. Oxidation of fatty acids by muscle and other tissues could inhibit glycolysis and reduce insulin-stimulated glucose removal (the Randle hypothesis, named after its original proponent). Increased fat storage in adipocytes and release of fatty acids may also eventually cause a shift in lipid storage, increasing lipid uptake and storage in nonadipose tissues such as muscle, liver, and β cells. Ectopic lipid storage in these tissues may lead to a decrease in their insulin sensitivity. In addition, free fatty acids may function directly in a signaling role both locally within the adipose tissue and systemically.
Inflammation. In addition to adipocytes, adipose tissue contains a variety of other cell types including inflammatory/immune cells, such as macrophages and lymphocytes. Recent evidence implicates these cells in obesity-induced insulin resistance. As adipocyte lipid stores rise, the increased release of free fatty acids and proinflammatory adipokines recruits macrophages to the adipose tissue and activates them. The activated macrophages then release a variety of molecules (TNF-α, IL-6, nitric oxide, and others) that decrease the insulin sensitivity of the adipocytes and further increase their release of proinflammatory fatty acids and peptides, creating a positive feedback loop that maintains a chronic state of local inflammation and insulin resistance. Release of these adipokines and proinflammatory cytokines, along with the increased release of free fatty acids and the development of ectopic lipid accumulation, promotes the development of inflammation and insulin resistance in the other key insulin-target tissues, such as muscle and liver. Similar mechanisms could also lead to inflammation in the islets and contribute to β cell failure.
PPARγ activity in the adipose tissue generally has beneficial effects on systemic insulin signaling through several mechanisms: (1) Promotion of adipose lipid storage, which thereby decreases ectopic lipid storage in nonadipose tissues; (2) Inhibition of the production of adipokines and proinflammatory cytokines, which promote insulin resistance, by adipocytes; (3) Promotion of the alternative activation of macrophages to the anti-inflammatory M2 state, rather than the proinflammatory M1 state; (4) Inhibition of the release of proinflammatory and proresistance cytokines by macrophages. Although it is expressed at much lower levels in muscle than in adipose tissue, PPARγ in myocytes might also have a direct role in controlling muscle insulin sensitivity; however, these findings remain controversial.
Tissue heterogeneity in insulin resistance. Finally, it must be kept in mind that not all tissues necessarily develop insulin resistance in parallel. The combination of local and systemic contributors to obesity-induced insulin resistance may explain the different levels of insulin resistance in different tissues of the same patient. Even in the same cell, insulin resistance may impact different arms of the insulin-signaling pathway discordantly. This heterogeneity leads to changes in tissue energy storage and insulin sensitivity that could explain unique syndromes associated with insulin resistance like hepatic steatosis and polycystic ovary syndrome.
Other causes of insulin resistance. Visceral obesity is not the only cause of insulin resistance, although it is by far the most common cause in most populations. Other causes of insulin resistance include a variety of genetic and acquired defects that impact the insulin receptors or postreceptor signaling pathways (see Table 17–7).
Clinical consequences of insulin resistance. In addition to the impact on glucose metabolism, severe insulin resistance and the resulting elevation in circulating insulin levels can cause other clinical consequences including acanthosis nigricans, pseudoacromegaly, and hyperandrogenism. Acanthosis nigricans appears to be a consequence of very high circulating insulin levels that cross over to bind to IGF receptors on epidermal and melanin–containing cutaneous cells. This leads to local skin hyperplasia with papillomatosis, hyperkeratosis, and hyperpigmentation. The dark, velvety patches of skin most commonly appear on the back of the neck, axillae, and anticubital fossae. In extreme and prolonged cases of insulin resistance, the secondary increase in signaling through the IGF-1 receptor, or possibly residual signaling through the mitogenic arm of the insulin signaling pathway, can cause pseudoacromegaly, a syndrome with all of the bone and soft tissue changes of acromegaly (see Chapter 4), but no elevation in growth hormone or IGF-1. A similar action of extremely high insulin levels on ovarian hilar cells has been implicated in women with insulin resistance who develop hyperandrogenism and hirsutism associated with menstrual irregularities, enlarged cystic ovaries and infertility (polycystic ovary syndrome).
Although the majority of people with type 2 diabetes have insulin resistance, most people with insulin resistance do not have diabetes because their β cells compensate for the insulin resistance by producing and secreting more insulin. Those individuals with insulin resistance who develop type 2 diabetes have a defect in the compensatory response of their β cells to insulin resistance. Functionally, this defect is revealed by a reduction in first phase insulin secretion and the maximal insulin secretion stimulated by glucose.
While increased insulin secretion per β cell may contribute to the compensatory response to insulin resistance, increases in the number of β cells play a role as well. In the setting of obesity, hyperplasia of pancreatic β cells is often present and probably accounts for the normal or exaggerated insulin responses to glucose and other stimuli seen in obese individuals without type 2 diabetes. Assessment of total β cell mass at autopsy has revealed that β cell mass increases in obesity, but the individuals with type 2 diabetes have decreased β cell mass when compared to nondiabetic individuals with the same BMI.
Several possible defects could contribute to the failure of β cell mass compensation in people with type 2 diabetes. Underlying genetic differences in the pathways that drive β cell expansion appear to limit compensation in individuals with high genetic risk of diabetes. In susceptible individuals with obesity, ectopic fat deposition in the islets, local obesity-induced inflammation in the islets, and local and circulating adipokines and inflammatory cytokines may accelerate β cell loss. As β cell failure progresses, levels of glucose and free fatty acids start to rise, which in turn can cause further β cell toxicity. Increased demand on a decreased β cell mass may cause further damage through ER stress and the increased formation of toxic IAPP oligomers. Then, once diabetes is established, all of these mechanisms may further contribute to the progressive decline in β cell function that characterizes type 2 diabetes.
Patients with visceral obesity and insulin resistance often present with a cluster of abnormalities commonly termed the metabolic syndrome. Hyperglycemia in these patients is frequently associated with hyperinsulinemia, dyslipidemia, and hypertension, which together lead to coronary artery disease and stroke. It has been suggested that this aggregation results from a genetic defect producing insulin resistance, particularly when obesity aggravates the degree of insulin resistance. In this model, impaired action of insulin predisposes to hyperglycemia, which in turn induces hyperinsulinemia. If this hyperinsulinemia is of insufficient magnitude to correct the hyperglycemia, type 2 diabetes is manifested. The excessive insulin level could also increase sodium retention by renal tubules, thereby contributing to or causing hypertension. Increased VLDL production in the liver, leading to hypertriglyceridemia (and consequently a decreased high-density lipoprotein [HDL] cholesterol level), has also been attributed to hyperinsulinism. Moreover, it has been proposed that high insulin levels can stimulate endothelial and vascular smooth muscle cell proliferation—by virtue of the hormone’s action on growth factor receptors—to promote atherosclerosis.
Although there is full agreement on an association of these disorders, the mechanism of their interrelationship remains speculative and open to experimental investigation. Controversy persists about whether or not hypertension is caused by the hyperinsulinism that results from insulin resistance. Moreover, patients with hyperinsulinism due to an insulinoma are generally normotensive, and there is no reduction of blood pressure after surgical removal of the insulinoma restores normal insulin levels.
An alternative unifying hypothesis could be that visceral obesity directly induces the other components of this syndrome. Visceral obesity is an independent risk factor for all of the other components of the metabolic syndrome. In addition to the metabolic effects of visceral obesity, the adipokines and inflammatory cytokines generated from overloaded and inflamed adipose tissue may contribute to the pathophysiology of the syndrome. Although the full details of the role of these molecules in causation of the metabolic syndrome remain under investigation, the adipocytes and associated macrophages clearly are not just innocent bystanders but play active roles in the development of systemic insulin resistance, hypertension, and hyperlipidemia. Furthermore, thrombi in atheromatous vessels may be more hazardous in patients with visceral obesity because of an associated increase in plasminogen activator inhibitor-1 (PAI-1), a circulating factor produced by omental and visceral adipocytes that inhibits clot lysis. This model emphasizes the importance of measures such as diet and exercise that reduce visceral adiposity in the management of patients with metabolic syndrome and obese type 2 diabetes.
The main value of grouping these disorders as a syndrome, regardless of its nomenclature, is to remind physicians that the therapeutic goals in these patients must not only correct hyperglycemia but also manage the elevated blood pressure and hyperlipidemia that result in considerable cardiovascular morbidity as well as cardiovascular deaths. In addition, it reminds physicians that when choosing antihypertensive agents or lipid-lowering drugs to manage one of the components of this syndrome, their possible untoward effects on other components of the syndrome should be carefully considered. For example, physicians aware of this syndrome are less likely to prescribe antihypertensive drugs that raise lipids (diuretics, beta- blockers) or that raise blood glucose (diuretics). Likewise, they may refrain from prescribing drugs that correct hyperlipidemia, but increase insulin resistance with aggravation of hyperglycemia (nicotinic acid).
Type 2 diabetes has a strong genetic link. Depending on the population studied, monozygotic twins have lifetime concordance rates for type 2 diabetes exceeding 90%. In contrast, concordance rates for type 1 diabetes in monzygotic twins are 25% to 50%. Most individuals with type 2 diabetes have other family members with the disease, but the inheritance rarely fits Mendelian patterns, supporting the conclusion that multiple genes with varying degrees of penetrance contribute. Because of the heterogeneous nature of type 2 diabetes, and its complex inheritance, efforts to identify the genes that contribute to the disease have had very limited success in the vast majority of affected patients. There has been considerable success, however, in identifying small subsets of patients with unique monogenic forms of the disease. When the etiologic defect has been defined, these patients have been reclassified within a group designated “Other Specific Types of Diabetes” (see Table 17–5).
Efforts to identify the genes involved in polygenic type 2 diabetes have focused on two approaches: candidate gene testing and genome-wide association studies (GWAS). To date candidate gene and GWAS approaches have identified 19 loci with common variants linked to type 2 diabetes. Although statistically significant and validated in additional populations, these loci independently make very small contributions to type 2 diabetes risk. The highest risk of these common variants is found at a locus adjacent to the gene encoding TCF7L2, a transcription factor involved in Wnt signaling and implicated in β cell turnover. Inheritance of the high-risk TCF7L2 allele increases the probability of developing diabetes by 1.5-fold.
Among the genes identified so far, most are involved in β cell function and turnover. When combined with the predominance of β cell genes implicated in mongenic forms of diabetes (see Other Specific Types of Diabetes), these results reinforce the critical role of the β cell in controlling blood glucose and its involvement in the pathophysiology of type 2 diabetes. Hopefully, with the advent of high-throughput whole genome sequencing technologies, the identification of rarer, but higher risk, variants will further expand our understanding of the genetics of type 2 diabetes in the near future.
Despite the critical role of genetics in type 2 diabetes, environment contributes as well, especially in determining the age of onset and severity of the disease. There is generally a low incidence of type 2 diabetes in underdeveloped countries, especially in rural areas. Western countries and westernizing countries suffer from a much higher incidence. Over the past half-century, the incidence of type 2 diabetes has increased rapidly in almost all world populations but especially in emerging third-world countries. This increase correlates with increasing rates of obesity in the same populations and reflects increased access to food with high caloric content and decreased physical activity. This combination inevitably leads to increased adiposity, especially in the more readily mobilized fat stores surrounding the viscera in the abdomen.
One of the most dramatic recent changes in the epidemiology of diabetes has been the growing incidence of type 2 diabetes in children. While rarely seen in children a generation ago, type 2 diabetes is now as common as type 1 diabetes in teenagers in the United States and is seen with increasing frequency, even in younger children. Again, this increase is directly related to increasing visceral adiposity.
MODY: This subgroup of monogenic disorders is characterized by the onset of diabetes in late childhood or before the age of 25 years as a result of a partial defect in glucose-induced insulin release and accounts for up to 5% of diabetes in North American and European populations. A strong family history of early-onset diabetes occurring in one parent and in one-half of the parent’s offspring suggests autosomal dominant transmission. In contrast to most patients with type 2 diabetes, these patients are generally nonobese and lack associated insulin resistance. Instead they exhibit predominantly a defect in glucose-stimulated insulin secretion. However, because they are not ketosis-prone and may initially achieve good glycemic control without insulin therapy, their disease has been called maturity-onset diabetes of the young (MODY). Several distinct types have been described with single-gene defects, and all have been shown to produce a defect in glucose-induced insulin release. MODY 2 results from an abnormal glucokinase enzyme. Most of the other forms of MODY are due to mutations of nuclear transcription factors that regulate the expression of genes in β cells or β cell precursors (Table 17–8).
| Syndrome | Mutated Protein | Gene | Function |
|---|---|---|---|
| MODY 1 | Hepatocyte nuclear factor-4α | HNF4A | Transcription factor |
| MODY 2 | Glucokinase | GCK | Glucose sensor |
| MODY 3 | Hepatocyte nuclear factor-1α | HNF1A | Transcription factor |
| MODY 4 | Pancreatic duodenal homeobox-1 | PDX1 | Transcription factor |
| MODY 5 | Hepatocyte nuclear factor-1β | HPF1A | Transcription factor |
| MODY 6 | NeuroD1 | NEUOROD1 | Transcription factor |
| MODY 7 | Kruppel-like factor 11 | KLF11 | Transcription factor |
| MODY 8 | Carboxyl-ester lipase | CEL | Exocrine enzyme |
| MODY 9 | Paired homeobox 4 | PAX4 | Transcription factor |
| Mutant insulin or proinsulin | Preproinsulin | INS | Hormone |
| KATP mutations | Inward-rectifying K+ channel 6.2 Sulfonylurea receptor 1 | KCNJ11 ABBC8 | Ion channel Ion channel |
MODY 1 includes multiple members of a large pedigree known as the R-W family, descendants of a German couple who immigrated to Michigan in 1861. They were studied prospectively since 1958, and in 1996 the genetic defect was shown to be a nonsense mutation of a nuclear transcription factor found in liver as well as in pancreatic β cells. This gene has been termed hepatocyte nuclear factor 4α (HNF4α) and is found on chromosome 20. Mutations of this gene are among the rarest of the MODY groups, with very few reported in families outside the Michigan pedigree. These patients display a progressive decline in β cell function and eventually develop chronic complications of diabetes including microangiopathy at a rate approaching that of people with type 1 diabetes. They often fare better with insulin therapy.
MODY 2 was first described in French families but has now been found in racial groups from most parts of the world. Multiple different mutations of the glucokinase gene (GCK) on chromosome 7 have been identified and characterized. In pancreatic β cells, glucokinase controls the rate-limiting step in glycolysis and thereby determines the rate of ATP production from glucose and the insulin secretory response to glucose (see Figure 17–5). Reduced glucokinase activity resets the sensitivity of the β cell to glucose so that it requires higher plasma glucose levels to stimulate insulin secretion, resulting in fasting hyperglycemia and mild diabetes. Although some of these mutations can completely block the enzyme’s function, others interfere only slightly with its action. In contrast to all the other forms of MODY, most patients with one mutated GCK allele (heterozygotes) have a benign course with few or no chronic complications and respond well to diet therapy or oral antidiabetic drugs without the need for insulin treatment. On the other hand, rare individuals who inherit two mutated GCK alleles have permanent neonatal diabetes (see later), a nonimmune form of absolute insulin deficiency that presents at birth.
In contrast to the mutations that reduce glucokinase enzyme activity and cause MODY 2, rare mutations in GCK that increase the enzymatic activity of glucokinase can cause increased insulin secretion and hypoglycemia (see Chapter 18), demonstrating the key role of this enzyme in determining the sensitivity of the β cell to glucose.
MODY 3 is caused by mutations of hepatocyte nuclear factor 1α (HNF1α), whose gene is located on chromosome 12. This is the most common form of MODY in European populations, with many different mutations having been reported. Like HNF4α, the HNF1α transcription factor is expressed in pancreatic β cells as well as in liver. Also similar to HNF4α, mutations in HNF1α cause a progressive form of diabetes with declining β cell function that often leads to dependence on insulin therapy and high rates of microvascular complications. Noteworthy, early in the course of the disease, these patients may display an exaggerated response to sulfonylureas.
Together, HNF1α and HNF4α, along with several other β cell transcription factors including PDX1 (discussed later), form an interacting network of transcription factors. This transcriptional network regulates genes involved in multiple β cell functions, including glucose-sensing and insulin secretion. Target genes include GCK, as well as genes implicated in the formation, maturation and expansion of β cells. Impairment in β cell formation and regeneration may explain the progressive nature of the MODY transcription factor syndromes and reinforces the importance of β cell mass in preventing hyperglycemia.
MODY 4 results from mutation of a pancreatic nuclear transcription factor known as pancreatic and duodenal homeobox-1 (PDX1), whose gene is on chromosome 13. It mediates insulin gene transcription and regulates expression of other β cell-specific genes including GCK. When both alleles of this gene are nonfunctioning, agenesis of the entire pancreas results; but in the presence of a heterozygous mutation of PDX1, a mild form of MODY has been described in which affected individuals developed diabetes at a later age (mean onset at 35 years) than occurs with the other forms of MODY, in whom onset generally occurs before the age of 25 years.
MODY 5 was initially reported in a Japanese family with a mutation of HNF1β, a hepatic nuclear transcription factor closely related in structure and molecular function to HNF1α. The two HNF1 factors, however, are expressed by different cells. HNF1β is expressed early in the development of the liver, pancreas, kidneys, and genitourinary system, and is not found in mature β cells.
Mutations in this gene cause a moderately severe form of MODY with progression to insulin treatment and severe diabetic complications in those affected. Consistent with its expression pattern early in development, HNF1β mutations also frequently cause reduction in the overall size of the pancreas, decreased insulin production, and congenital defects in the kidney and urogenital tract. Patients may also suffer from varying degrees of cholestatic jaundice, hyperuricemia, nephropathy, and hypomagnesemia secondary to renal magnesium wasting.
MODY 6, a milder form of MODY similar to MODY 4, results from mutations in the gene encoding the islet transcription factor NeuroD1. Like PDX1, NeuroD1 plays an important role in the expression of insulin and other β cell genes, and in the formation and maintenance of β cells.
Other MODY genes: The six MODY genes listed above explain the majority of cases of MODY in patients of European ancestry, but less than half of those in non-European populations. Several rare variants in other genes have been implicated in autosomal dominant diabetes in a few families (see Table 17–8); however, a consensus has not yet been reached that these families fit the criteria for MODY and that the reported variants cause the disorder. The causative genes in most non-Europeans with MODY remain unknown.
The identification of mutations in multiple genes encoding pancreatic transcription factors in patients with MODY has led to the screening of other genes encoding pancreatic transcription factors in patients with diabetes. Heterozygous mutations in genes encoding several transcription factors, including Isl1, Pax6, and Pax4, have been identified in patients with later onset diabetes. The association of diabetes with heterozygous mutations in so many β cell genes highlights the critical importance of optimal β cell function in metabolic regulation. Even modest defects in glucose-induced insulin secretion can result in hyperglycemia.
Insulin mutations: Sequencing of the insulin gene more than 30 years ago led to the first descriptions of heterozygous mutations in the coding sequence of the insulin gene that produce abnormal circulating forms of insulin. Most of these initial cases presented with high circulating levels of insulin, but normal insulin sensitivity and normal glucose levels. Because the abnormal insulins in these cases bind to receptors poorly, they have very low biologic activity and are cleared at a slower rate, leading to accumulation in the blood at higher levels than normal insulin and a subnormal molar ratio of C peptide to immunoreactive insulin. They typically are not associated with hyperglycemia.
However, a mutation in the insulin B chain in one family was associated with decreased circulating levels of both the mutant and normal insulins, and diabetes. Subsequent extensive sequencing of the INS gene has identified several other mutant insulins that produce a similar heterozygous form of diabetes. Modeling of these dominant insulin mutations in mice demonstrates that they lead to the accumulation of aberrantly folded proteins in the endoplasmic reticulum, activation of the unfolded protein response in the ER, and β cell apoptosis. Patients with diabetes secondary to INS gene mutations usually present at a younger age than most patients with MODY, often developing the disease as neonates (see later). Because of the profound β cell loss, these patients follow a disease course similar to type 1 diabetes with absolute insulin deficiency and ketosis, and they require insulin therapy.
This syndrome highlights the sensitivity of the β cells to ER stress, which may explain why β cells often fail when presented with the increased insulin demands associated with insulin resistance, the toxicity of IAPP oligomers, or mutations in genes involved in the unfolded protein response pathway (see later).
Mutations in the subunits of the ATP-sensitive potassium channel: β cells sense rising blood glucose concentrations by increasing the production of ATP from glucose. The rising intracellular ATP levels cause the closure of ATP-sensitive potassium channels on the cell surface, which depolarizes the cell and sets off a cascade of events that leads to the secretion of insulin (Figure 17–5). Rare dominant activating mutations in either of the two units of the channel, SUR1 and Kir6.2 (gene names ABCC8 and KCNJ11, respectively), can cause the channels to remain open and prevent glucose-induced depolarization and insulin secretion. Children heterozygous for these mutations present with early-onset diabetes, commonly as neonates, and may have associated neurologic deficits implying a role for these channels in the central nervous system. Depending on the exact mutation, some of these children can still respond to treatment with sulfonylureas, which may also ameliorate the neurologic symptoms.
Autosomal recessive genetic defects: Although less common than the autosomal dominant β cell disorders, mutations in several genes causing autosomal recessive syndromes with defects in β cell function have been identified in patients with diabetes (Table 17–9). Due to the severity of the β cell defect, many of these present with neonatal diabetes. This group of disorders includes homozygous mutations in the MODY genes GCK and PDX1. Homozygous mutations in GCK cause a much more severe syndrome than the mild glucose-sensing defect seen in MODY 2. Patients with homozygous GCK mutations present at birth with severe hyperglycemia and require insulin therapy.
| Function | Protein | Gene | Associated Defects |
|---|---|---|---|
| Glucose sensing | Glucokinase | GCK | |
| Transcription factor | Pancreatic duodenal homeobox-1 Pancreatic transcription factor 1a Neurogenenin3 Regulatory factor X-box 6 GLI Similar-3 | PDX1 PTF1A NEUROG3 RFX6 GLIS3 | Pancreatic agenesis Pancreatic and cerebellar agenesis Absence of gut endocrine cells, malabsorption Mitchell-Riley syndrome: absence of gut endocrine and islet α, β, and δ cells, pancreatic and gall bladder hypoplasia, intestinal atresia, malabsorption Hypothyroidism, cholestasis, polycystic kidneys, hypoplastic pancreas |
| Unfolded protein response | Eukaryotic translation initiation factor 2-α kinase 3/PKR-like ER kinase (PERK) Wolfram syndrome protein 1 (WFS1) | EIF2AK3 WFS1 | Wolcott-Rallison syndrome: epiphyseal dysplasia and growth retardation; variable hepatic, renal, cardiac, and pancreatic exocrine defects Wolfram syndrome: diabetes insipidus, diabetes mellitus, optic atrophy and deafness (DIDMOAD) |
| Thiamine transport | Solute carrier family 19 (thiamine transporter), member 2 | SLC19A2 | Thiamine-responsive megaloblastic anemia: anemia, deafness |
In patients with mutations in both alleles of PDX1, the pancreas fails to form, and they have pancreatic exocrine deficiency as well as diabetes. Homozygous mutations in several other pancreatic transcription factor genes have been described as well, including PTF1A, NEUROG3, RFX6, and GLIS3. Like PDX1, homozygous mutation of PTF1A causes diabetes and pancreatic agenesis, but it also causes cerebellar atrophy as well. The transcription factor Neurog3 drives the formation of the endocrine cells in both the pancreas and gut. In addition to diabetes onset prior to puberty, infants born with homozygous NEUROG3 mutations have severe malabsorption associated with a lack of gut endocrine cells from birth.
Homozygous mutations in RFX6, which encodes a transcription factor that functions downstream of NEUROG3 and upstream of PDX1 in β cell development, cause Mitchell–Riley syndrome in which neonates present with diabetes in association with complete absence of all islet cell types except PP cells, hypoplasia of the pancreas and gall bladder, intestinal atresia, and severe malabsorption.
The zinc finger transcription factor GLIS3 is expressed broadly in many tissues and plays a role in the transcription of the insulin gene. Homozygous mutations in GLIS3 cause congenital hypothyroidism in addition to neonatal diabetes.
In the autosomal recessive Wolcott-Rallison syndrome, affected children present with neonatal diabetes, epiphyseal dysplasia, and growth retardation together with a variety of progressive hepatic, renal, cardiac, and pancreatic exocrine defects and developmental delay. The causative gene, EIF2AK3, encodes a kinase (PKR-like ER kinase [PERK]) activated by the presence of unfolded proteins in the ER. PERK controls one of the three parallel arms of the unfolded protein response; inositol-requiring enzyme 1 (IRE1) and activating transcription factor 6 (ATF6) activate the other two arms. Together these three molecules activate signaling pathways that protect the cell from ER stress but lead to apoptosis when these protective mechanisms fail. Mice lacking PERK have an inadequate response to ER stress, which leads to accelerated β cell apoptosis. With the high load of insulin production in the ER, β cells are uniquely sensitive to ER stress, and this sensitivity probably underlies the damage caused by mutant insulins, IAPP oligomers, and Wolfram syndrome as well.
Wolfram syndrome is an autosomal recessive neurodegenerative disorder first evident in childhood. Patients present with diabetes insipidus, diabetes mellitus, optic atrophy, and deafness—hence the acronym DIDMOAD. Diabetes mellitus usually develops in the first decade together with the optic atrophy, followed by central diabetes insipidus and sensorineural deafness during the second decade in 60% to 75% of patients. Ureterohydronephrosis, neurogenic bladder, cerebellar ataxia, peripheral neuropathy, and psychiatric illness develop later in many patients. The diabetes mellitus is nonimmune and not linked to specific HLA antigens, but on autopsy these patients have selective loss of β cells in the pancreas. Genetic studies mapped the causative mutations to a gene called WFS1, which encodes a 100.3-kDa transmembrane protein localized to the endoplasmic reticulum membranes of all cells. WFS1 is expressed at particularly high levels in β cells. Studies in mice have shown that the WFS1 protein forms part of the unfolded protein response downstream of PERK and IRE1 and helps protect the β cells from ER stress and apoptosis, especially during periods of high insulin demand.
Children with thiamine-responsive megaloblastic anemia syndrome carry mutations in the high-affinity thiamine transporter SLC19A2 found on cell and mitochondrial membranes. They develop megalobastic anemia, diabetes, and sensorineuronal deafness. The diabetes usually presents in the first decade of life. In the absence of SLC19A2, cells and mitochondria can still transport thiamine through lower affinity transporters, and both the anemia and the diabetes respond to pharmacologic treatment with thiamine. However, all patients eventually require insulin replacement despite thiamine therapy. It remains unclear how partial defects in cellular and mitochondrial thiamine transport cause β cell failure.
Mitochondrial DNA mutations: Because sperm do not contain mitochondria, only the mother transmits mitochondrial genes to her offspring. Diabetes due to a mutation of mitochondrial DNA that impairs the transfer of leucine into mitochondrial proteins has now been described in a large number of families, and results from impaired β cell function. The incidence of this disorder is as high as 1% to 3% in patients with diabetes in Japan and Korea, but lower in European populations. Most patients have a mild form of maternally transmitted diabetes with insulin deficiency that responds to oral hypoglycemic agents; however, some patients have a more severe clinical picture similar to type 1a diabetes. As many as 63% of patients with this subtype of diabetes have hearing loss and a smaller proportion (15%) have a syndrome of myopathy, encephalopathy, lactic acidosis, and stroke-like episodes.
First described in young adult African American males from the Flatbush neighborhood in New York City, but since described in a number of populations of both African and non-African ancestry, these patients typically present with diabetic ketoacidosis and absolute insulin deficiency, followed by extended clinical remission off insulin. When tested during remission, however, maximal insulin secretory capacity remains markedly reduced, and these patients follow a relapsing course of DKA and hyperglycemia with eventual permanent insulin-deficient diabetes. These patients do not have islet cell autoantibodies or increased frequencies of HLA haplotypes associated with risk of autoimmune type 1a diabetes. Although there is often a family history of similar diabetes, the inheritance is not clearly Mendelian. Although KPD patients have been distinguished based on the history of relapsing β cell dysfunction, it remains controversial as to whether KPD represents a clinical entity distinct from other forms of nonautoimmune type 1b diabetes.
In a study of KPD patients of West African ancestry, linkage was established with coding variants in the PAX4 gene. PAX4 encodes for a transcription factor that functions downstream of NEUROG3 in the formation of β cells. Fourteen to twenty-one percent of individuals of West African ancestry carry a coding variant that substitutes tryptophan for arginine at position 133 in Pax4 and reduces its ability to repress transcription of target genes. Interestingly, the R133W variant is unique to people of West African ancestry. The R133W allele is approximately twice as frequent in individuals with KPD, and all individuals homozygous for R133W have KPD. An additional Pax4 coding variant with reduced ability to bind to DNA was identified in one patient with KPD. Different coding variants in PAX4 have also been identified in Thai families with MODY (MODY 9) and in Japanese patients (both heterozygous and homozygous) with early onset insulin-deficient diabetes similar to KPD. Taken together, these data suggest that coding variants in the PAX4 gene predispose to insulin-deficient diabetes, but the clinical phenotype may depend on the exact nature of the variant and interactions with other genes and environmental factors.
These are rare and unusual causes of diabetes that result from mutations of the insulin receptor or from other genetically determined postreceptor abnormalities of insulin action. Metabolic abnormalities associated with these disorders may range from hyperinsulinemia and modest hyperglycemia to severe diabetes. Many individuals have acanthosis nigricans, polycystic ovaries with hyperandrogenism, and, in exceptional cases, pseudoacromegaly (see earlier).
Familial forms of insulin resistance associated with acanthosis nigricans have been termed type A insulin resistance, and are often associated with heterozygous mutations in the insulin receptor or homozygous mutations that retain some insulin-signaling capacity. Because of the capacity of the β cell to compensate for insulin resistance, these patients often do not present with hyperglycemia, but have severely elevated levels of circulating insulin.
If both copies of the insulin receptor gene carry mutations that nearly or completely abrogate signaling, the affected children present at birth with a syndrome known as Leprechaunism (or Donohue syndrome) that includes growth retardation, multiple developmental defects, lipoatrophy, severely elevated insulin levels, and hyperglycemia that does not respond to insulin therapy. These patients generally do not survive beyond a few weeks. Patients with Rabson-Mendenhall syndrome also have homozygous or compound heterozygous mutations in the insulin receptor, but with some small amount of residual signaling that results in a slightly less severe syndrome associated with abnormalities in the nails, teeth, and pineal gland. They may survive into adolescence.
Familial forms of type A insulin resistance without mutations in the insulin receptor have been described, and some of these may result from mutations in downstream components of the insulin-signaling cascade, although to date few such mutations have been found in humans. Variants in IRS1 have been identified in patients with diabetes, but also occur in people with normal insulin sensitivity. Rare coding mutations in the genes encoding the p85α subunit of PI3 kinase, in AKT2, and in PPARγ have been associated with severe insulin resistance in a very small number of patients. The one patient with homozygous mutation of AKT2 also had mild atrophy of subcutaneous limb adipose tissue.
Congenital and acquired forms of lipodystrophy can cause severe insulin resistance. Except in newborns with lipoatrophy secondary to complete loss of insulin receptors (Leprechaunism), alterations in the structure and function of the insulin receptor cannot be demonstrated in patients with insulin-resistant lipodystrophic diabetes, suggesting that the cause of the insulin resistance in these patients must reside in postreceptor pathways. Replacement of the adipokines leptin and adiponectin can reverse insulin resistance in mouse models of severe lipoatrophy, and leptin has been helpful in human cases of generalized lipodystrophy, demonstrating the importance of the adipocyte in regulating insulin function. Also, the loss of adipose storage depots in lipoatrophy leads to very high levels of circulating triglyceride-rich lipoprotein particles and increased deposition of fat in nonadipose tissues such as liver and muscle, which may contribute to dysfunction and insulin resistance in these tissues. The increase in ectopic fat deposition leads to profound hepatic steatosis in affected patients and can progress to cirrhosis and liver failure.
The congenital syndromes can be divided into generalized and partial lipodystrophies with or without dystrophic features in other tissues. The generalized syndromes are often identified in neonates, have severe insulin resistance at diagnosis and rapidly develop hyperglycemia, acanthosis nigricans, hyperandrogenism, and pseudoacromegaly. Recessive mutations causing generalized congenital lipodystrophy have been identified in three genes encoding proteins involved in the formation of lipid droplets (seipin and caveolin-1) and triglyceride (1-acylglycerol-3–phosphate-O-acyltransferase 2 [AGPAT2]).
Two syndromes of familial partial lipodystrophy without associated dysmorphic defects have been described in which the lipoatrophy usually first appears late in childhood, but may be proceeded by evidence of insulin resistance. The type 1 syndrome consists of atrophy of limb, gluteal and subcutaneous abdominal fat with sparing or increases of the abdominal visceral, upper trunk, head, and neck fat. In the type 2 syndrome, truncal and visceral fat are also affected and only vulval and head and neck depots are spared.
To date no genetic causes of the type 1 syndrome have been identified. In the type 2 syndrome, dominant mutations have been found in LMNA, the gene encoding the nuclear intermediate filament lamin A/C. In addition, one individual with the type 2 syndrome has been identified with a homozygous nonsense mutation in the gene encoding the lipid droplet protein CIDEC, and one individual was identified with a homozygous truncation of the gene encoding lipase maturation factor 1, a protein required for the maturation of both lipoprotein lipase and hepatic lipase.
Consistent with its known role in adipocytes differentiation, dominant mutations in the gene encoding PPARγ have also been described in patients with familial partial lipodystrophy and insulin resistance. These patients have a pattern of lipoatrophy similar to the type 2 syndrome with LMNA mutations, but with less severe subcutaneous fat loss, and have been labeled type 3 familial partial lipodystrophy.
Several syndromes of lipodystrophy associated with other dysmorphic features have been described. Autosomal recessive mutations in ZMPSTE24, which encodes a metalloproteinase that cleaves prolamin A to produce mature lamin A, cause generalized lipodystrophy associated with mandibulo-acral dysplasia. In patients with partial lipodystrophy combined with mandibulo-acral dysplasia, autosomal recessive mutations have been identified in LMNA, but these mutations are distinct from those that cause familial partial lipodystrophy type 2. Remarkably, yet a different set of mutations in LMNA cause the autosomal recessive syndrome Hutchinson–Gilford progeria, which includes severe early onset generalized lipodystrophy. Additional distinct mutations in LMNA cause several other congenital dysmorphic syndromes, including muscular dystrophies, familial dilated cardiomyopathy, and Charcot-Marie-Tooth disease.
Acquired forms of partial and generalized lipodystrophy with insulin resistance and diabetes can develop secondary to infections, autoimmunity, paraneoplastic syndromes, collagen vascular disorders, drugs, or unknown causes. One common form is seen in patients with HIV infection following treatment with protease inhibitors.
Neonatal diabetes, defined as diabetes diagnosed before 6 months of age, is rare, occurring in fewer than 1 in 200,000 live births. Children with neonatal diabetes often present with decreased birth weight (intrauterine growth retardation, IUGR) and decreased fat stores in addition to hyperglycemia. Most commonly these children have reduced circulating insulin and C-peptide levels caused by inherited β cells defects, although rare inherited defects in insulin signaling can also present in neonates. In approximately half of cases, neonatal diabetes is transient: the diabetes goes into remission (normoglycemia with no therapy) before 18 months of age, although it usually returns at puberty. In the remainder of cases, the diabetes is permanent.
Transient neonatal diabetes (TNDM): Defects in imprinting underlie most cases of TNDM. The most common genetic defect is paternal uniparental isodysomy (replacement of the maternal copy of the region with the paternal copy) of an imprinted region at chromosome 6q24. In this region, the maternal copy of the chromosome is normally silenced by methylation. Simple duplication of the paternal copy of this region, or mutations in ZFP57, a zinc-finger protein required globally for the methylation of imprinted regions, can give the same TNDM phenotype. The affected region of 6q24 contains two genes of uncertain function, but one of them, ZAC, has been identified as a tumor suppressor gene and may activate the expression of an inhibitor of cell proliferation. An increase in hypomethylated copies of ZAC may lead to the inhibition of β cell proliferation and inadequate β cell mass.
Some autosomal dominant activating mutations in KCNJ11 and ABCC8, the genes encoding the two subunits of the ATP-sensitive potassium channels in β cells (Figure 17–5) and listed among autosomal dominant forms of heritable diabetes (see earlier) can cause TNDM. Autosomal dominant mutations in the MODY 5 gene, HNF1B, can also cause TNDM.
Permanent neonatal diabetes (PNDM): Autosomal dominant activating mutations in KCNJ11 and ABCC8 can also cause PNDM. Some of the autosomal dominant insulin mutations that cause rapid β cell apoptosis will result in permanent diabetes in neonates. In addition, most of the syndromes caused by autosomal recessive genetic defects in β cells (see Table 17–9) present in neonates. These include mutations in the MODY genes GCK and PDX1, the transcription factor genes PTF1A, GLIS3, and RFX6, and the Wolcott–Rallison syndrome gene EIF2AK3. The IPEX syndrome (see Genetics of Type 1 Diabetes above), caused by mutations in FOXP3, can also present with accelerated autoimmune type 1 diabetes in neonates. Finally, mutations that cause complete, or nearly complete, loss of insulin signaling (Leprechaunism) also present with PNDM.
Several other syndromes of neonatal diabetes of unknown etiology associated with a variety of other developmental defects have been described. With the advent of rapid whole genome sequencing, the genetic defects that cause these syndromes, as well as later onset diabetes, may soon be identified, providing further insights into the pathogenesis of diabetes and identifying potential therapeutic targets.
Any process that diffusely damages or substantially displaces the pancreas can cause diabetes, although individuals with a predisposition to type 2 diabetes are probably more susceptible to developing diabetes with lesser degrees of pancreatic involvement. Because glucagon-secreting α cells are also damaged or removed by these processes, less insulin is usually required for replacement—as compared with most other forms of diabetes that leave α cells intact.
Acquired causes include pancreatitis, trauma, infection, pancreatic carcinoma, and pancreatectomy. Fibrocalculous pancreatopathy, a form of acquired pancreatitis with extensive fibrosis and ductal calculi seen commonly in tropical regions, may result from both dietary and genetic contributors, although the exact cause remains obscure. Like chronic pancreatitis from a variety of causes, fibrocalculous involvement of the pancreas may be accompanied by abdominal pain radiating to the back and associated with pancreatic calcifications on x-ray. When extensive enough, hemochromatosis and cystic fibrosis can also displace β cells and reduce insulin secretion. Autosomal dominant mutations in carboxyl-ester lipase (CEL), an exocrine enzyme, cause accelerated exocrine pancreatic damage and diabetes at a young age, and have been designated as MODY 8 (see Table 17–8).
Excess production of certain hormones—GH (acromegaly), glucocorticoids (Cushing syndrome or disease), catecholamines (pheochromocytoma), thyroid hormone (thyrotoxicosis), glucagon (glucagonoma), or pancreatic somatostatin (somatostatinoma)—can produce relative insulin deficiency and diabetes by a number of mechanisms. In all but the last instance (somatostatinoma), peripheral responsiveness to insulin is impaired. In addition, excess of catecholamines or somatostatin decreases insulin release from β cells. Diabetes mainly occurs in individuals with underlying defects in insulin secretion, and hyperglycemia typically resolves when the hormone excess is corrected.
Many drugs are associated with carbohydrate intolerance or frank diabetes mellitus. Some act by interfering with insulin release from the β cells (thiazides, phenytoin, cyclosporine), some by inducing insulin resistance (glucocorticoids, oral contraceptive pills, niacin, and antiviral protease inhibitors), and some by causing β cell destruction (intravenous pentamidine). Patients receiving β interferon have been reported to develop diabetes associated with β cell antibodies and in certain instances severe insulin deficiency. Atypical antipsychotic medications can provoke substantial weight gain and insulin resistance, but the high reported incidence of diabetic ketoacidosis in patients on these drugs suggests that they may also impair β cell function.
Adrenergic drugs impact glucose metabolism in complex and often opposing ways because of differing effects on insulin secretion, glucagon secretion, hepatic glucose output, peripheral insulin sensitivity, and weight gain. In clinical practice, the first generation, nonselective β-blockers such as propanolol tend to modestly increase glucose levels, at least in part due to increases in insulin resistance, but potentially by decreasing insulin secretion as well. The second generation, selective β1 blockers also tend to increase blood glucose, but the third generation drugs with combined α and β blockade have minimal effects on blood glucose. In contrast, nonselective α agonist and α2 agonists tend to raise blood glucose, probably due to their combined effects on insulin secretion and hepatic glucose output. However, although β blockers and α2 agonists like clonidine, as well as calcium channel blockers, inhibit glucose-induced insulin release from in vitro preparations of pancreatic β cells, these drugs have minimal or modest effects on blood glucose control at the levels used in standard antihypertensive therapy in humans.
Finally it must be kept in mind that the most common toxin causing diabetes is ethanol. Chronic alcoholic pancreatitis with secondary loss of β cells accounts for approximately 1% of diabetes in the United States.
Certain viruses have been associated with direct pancreatic β cell destruction in animals. Diabetes is also known to develop frequently in humans who had congenital rubella, although most of these patients have HLA and immune markers characteristic of type 1 diabetes. In addition, coxsackievirus B, cytomegalovirus, adenovirus, and mumps have been implicated in inducing certain cases of diabetes.
A severe form of insulin resistance has been reported in patients who developed high titers of antibodies that bind to the insulin receptor and block the action of insulin in its target tissues. As in other states of extreme insulin resistance, these patients often have acanthosis nigricans. In the past, this form of immune-mediated diabetes was termed type B insulin resistance. Most commonly these antibodies are of idiopathic origin, but they have also been described in monoclonal gamopathies and multiple myeloma and in patients with ataxia telangectasia syndrome.
Several syndromes of altered immune function with multiple endocrine gland involvement have been described. The APS1 and IPEX syndromes are described in the section on the genetics of type 1 diabetes and in Chapter 2. Patients with POEMS, a syndrome of plasma cell dyscrasia associated with polyneuropathy, organomegaly, endocrinopathy, monoclonal gammopathy, and skin changes, have an increased incidence of diabetes as well as other endocrine disorders. The cause of the diabetes in these patients has not been established.
More than 50 distinct genetic syndromes involve an increased incidence of diabetes mellitus. These include the chromosomal abnormalities of Down syndrome, Klinefelter syndrome, and Turner syndrome. In addition, a number of complex syndromes associated with neuromuscular pathologies (Freidriech ataxia, Huntington chorea, porphyria, muscular dystrophies) or severe obesity (Laurence-Moon-Biedl, Bardet-Biedl, and Prader-Willi syndromes) have been associated with diabetes.
The principal clinical features of the two major types of diabetes mellitus are listed for comparison in Table 17–10.
| Diabetes Type 1 | Diabetes Type 2 | |
|---|---|---|
| Polyuria and thirst | ++ | + |
| Weakness or fatigue | ++ | + |
| Polyphagia with weight loss | ++ | − |
| Recurrent blurred vision | + | ++ |
| Vulvovaginitis or pruritus | + | ++ |
| Peripheral neuropathy | + | ++ |
| Nocturnal enuresis | ++ | − |
| Often asymptomatic | − | ++ |
Patients with type 1 diabetes present with symptoms and signs related to hyperglycemia and hyperketonemia. The severity of the insulin deficiency and the acuteness with which the catabolic state develops determine the intensity of the osmotic and ketotic excess.
Increased urination is a consequence of osmotic diuresis secondary to sustained hyperglycemia. This results in a loss of glucose as well as free water and electrolytes in the urine. Nocturnal enuresis due to polyuria may signal the onset of diabetes in very young children. Thirst is a consequence of the hyperosmolar state, as is blurred vision, which often develops as the lenses and retinas are exposed to hyperosmolar fluids.
Weight loss, despite normal or increased appetite, is a common feature of type 1 diabetes when it develops subacutely over a period of weeks. The weight loss is initially due to depletion of water, glycogen, and triglyceride stores. Chronic weight loss due to reduced muscle mass occurs as amino acids are diverted to form glucose and ketone bodies.
Lowered plasma volume produces dizziness and weakness due to postural hypotension when sitting or standing. Total body potassium loss and the general catabolism of muscle protein contribute to the weakness.
Paresthesias may be present at the time of diagnosis of type 1 diabetes, particularly when the onset is subacute. They reflect a temporary dysfunction of peripheral sensory nerves and usually clear, as insulin replacement restores glycemic levels closer to normal; thus, their presence suggests neurotoxicity from sustained hyperglycemia.
When insulin deficiency is severe and of acute onset, the above symptoms progress in an accelerated manner. Ketoacidosis exacerbates the dehydration and hyperosmolality by producing anorexia, nausea, and vomiting, thus interfering with oral fluid replacement. As plasma osmolality exceeds 330 mOsm/kg (normal, 285-295 mOsm/kg), impaired consciousness ensues. With progression of acidosis to a pH of 7.1 or less, deep breathing with a rapid ventilatory rate (Kussmaul respiration) occurs as the body attempts to eliminate carbonic acid. With worsening acidosis (to pH 7.0 or less), the cardiovascular system may be unable to maintain compensatory vasoconstriction; severe circulatory collapse may result.
The patient’s level of consciousness can vary depending on the degree of hyperosmolality. When insulin deficiency develops relatively slowly and sufficient water intake is maintained to permit renal excretion of glucose and appropriate dilution of extracellular sodium chloride concentration, patients remain relatively alert and physical findings may be minimal. When vomiting occurs in response to worsening ketoacidosis, dehydration progresses and compensatory mechanisms become inadequate to keep plasma osmolality below 330 mOsm/kg. Under these circumstances, stupor or even coma may occur. Evidence of dehydration in a stuporous patient, with rapid deep breathing and the fruity breath odor of acetone, suggests the diagnosis of diabetic ketoacidosis.
Postural hypotension indicates a depleted plasma volume; hypotension in the recumbent position is a serious prognostic sign. Loss of subcutaneous fat and muscle wasting are features of more slowly developing insulin deficiency. In occasional patients with slow, insidious onset of insulin deficiency, subcutaneous fat may be considerably depleted. An enlarged liver, eruptive xanthomas on the flexor surface of the limbs and on the buttocks, and lipemia retinalis indicate that chronic insulin deficiency has resulted in chylomicronemia, with elevated circulating triglycerides, usually to over 2000 mg/dL (Chapter 19).
Patients with type 2 diabetes usually have less severe insulin deficiency than type 1 patients and the symptoms and signs at presentation reflect this difference.
Many patients with type 2 diabetes have an insidious onset of hyperglycemia and may be relatively asymptomatic initially. The diagnosis may be made only after glycosuria or hyperglycemia is noted during routine laboratory studies. Chronic skin infections are common. Generalized pruritus and symptoms of candidal vaginitis are frequently the initial complaints of women with type 2 diabetes. Men may complain of an itchy rash of the prepuce. Some patients can remain undiagnosed for many years and the initial presentation may be due to complications such as visual disturbance due to retinopathy or foot pain or infection due to a peripheral neuropathy. Patients with a more severe insulin deficiency have the classical symptoms of polyuria, thirst, blurred vision, paresthesias, and fatigue. This is especially true in individuals who consume large amounts of carbohydrate-rich fluids in response to the thirst.
Many patients are obese or overweight. Even those patients who are not significantly overweight often have a characteristic fat distribution with more fat in the upper part of the body (particularly the abdomen, chest, neck, and face) and relatively less fat on the appendages, which may be quite muscular (the metabolically obese). This centripetal fat distribution has been termed android and is characterized by a high waist circumference. It differs from the more centrifugal gynecoid form of obesity, in which fat is localized more in the hips and thighs and less in the upper parts of the trunk. A larger waist circumference increases the risk for diabetes for any given body mass index (BMI). Thus in patients with the metabolic syndrome, a waist circumference >40 in (102 cm) in men and >35 in (88 cm) in women is associated with an increased risk of diabetes. MRI and CT scans reveal that these patients with increased waist circumference have accumulation of fat in the omental and mesenteric distributions. This visceral fat correlates with insulin resistance, whereas fat predominantly in subcutaneous tissues of the abdomen has little, if any, association with insulin insensitivity.
Some patients, especially the obese, may have acanthosis nigricans—hyperpigmented, hyperkeratotic skin in the axilla, groin, and back of neck. This sign is associated with significant insulin resistance. Hypertension may be present especially in the obese patient. Eruptive xanthomata on the flexor surface of the limbs and on the buttocks and lipemia retinalis due to hyperchylomicronemia can occur in patients with uncontrolled type 2 diabetes who also have a familial form of hypertriglyceridemia. In women, candidal vaginitis with a reddened, inflamed vulvar area and a profuse whitish discharge may herald the presence of diabetes. In men, candidal infection of the penis may lead to reddish appearance of the penis and/or prepuce with eroded white papules and a white discharge. The occasional patient who has had undiagnosed diabetes for some time may present with retinopathy or peripheral neuropathy.
Patients can also present in hyperglycemic hyperosmolar coma—profoundly dehydrated, hypotensive, lethargic, or comatose without Kussmaul respirations.
Tests of urine glucose and ketone bodies, as well as whole blood or plasma glucose measured in samples obtained under basal conditions and after glucose administration, are very important in evaluation of the patient with diabetes. Tests for glycosylated hemoglobin have proved useful in both initial evaluation and in assessment of the effectiveness of therapeutic management. In certain circumstances, measurements of insulin or C-peptide levels and levels of other hormones involved in carbohydrate homeostasis (eg, glucagon, GH) may be useful. In view of the increased risk of atherosclerosis in patients with diabetes, determination of serum cholesterol, HDL—cholesterol, triglycerides, and LDL-cholesterol may be helpful.
Several problems are associated with using urine glucose as an index of blood glucose, regardless of the method employed. First of all, the glucose concentration in bladder urine reflects the blood glucose at the time the urine was formed. Therefore, the first voided specimen in the morning contains glucose that was excreted throughout the night and does not reflect the morning blood glucose at all. Some improvement in the correlation of urine glucose to blood glucose can be obtained if the patient double voids—that is, empties the bladder completely, discards that sample, and then urinates again about one-half hour later, testing only the second specimen for glucose content. However, difficulty in completely emptying the bladder (large residual volumes), problems in understanding the instructions, and the inconvenience impair the usefulness of this test. Self-monitoring of blood glucose has replaced urine glucose testing in most patients with diabetes (particularly those receiving insulin therapy).
Several commercial products are available for determining the presence and amount of glucose in urine. The older and more cumbersome bedside assessment of glycosuria with Clinitest tablets has generally been replaced by the dipstick method, which is rapid, convenient, and glucose specific. This method consists of paper strips (Clinistix, Tes-Tape) impregnated with enzymes (glucose oxidase and hydrogen peroxidase) and a chromogenic dye that is colorless in the reduced state. Enzymatic generation of hydrogen peroxide oxidizes the dye to produce colors whose intensity depends on the glucose concentration. These dipsticks are sensitive to as little as 0.1% glucose (100 mg/dL) but do not react with the smaller amounts of glucose normally present in nondiabetic urine. The strips are subject to deterioration if exposed to air, moisture, and extreme heat and must be kept in tightly closed containers except when in use. False-negative results may be obtained in the presence of alkaptonuria and when certain substances such as salicylic acid or ascorbic acid are ingested in excess. All these false-negative results occur because of the interference of strong reducing agents with oxidation of the chromogen.
Although glycosuria reflects hyperglycemia in more than 90% of patients, two major classes of nondiabetic glycosuria must be considered:
Disorders associated with abnormalities in renal glucose handling include Fanconi syndrome, a group of disorders characterized by combined renal wasting of multiple solutes including amino acids, uric acid, phosphate, and bicarbonate as well as glucose and caused by both genetic and acquired defects of the proximal renal tubule. Familial renal glycosuria, a benign inherited disorder manifest only by persistent glycosuria in the setting of euglycemia is caused by mutations in SGLT2, the sodium-glucose cotransporter responsible for the bulk of glucose reabsorption in the proximal tubule.
In addition, glycosuria is relatively common in pregnancy as a consequence of the increased load of glucose presented to the tubules by the elevated glomerular filtration rate during pregnancy. As many as 50% of pregnant women normally have demonstrable sugar in the urine, especially after the first trimester.
Occasionally, a sugar other than glucose is excreted in the urine. Lactosuria during the late stages of pregnancy and the period of lactation is the most common example. Much rarer are other conditions in which inborn errors of metabolism allow fructose, galactose, or a pentose (1-xylose) to be excreted in the urine. Testing the urine with glucose-specific strips helps differentiate true glucosuria from other glycosurias.
Urinary albumin can now be detected in microgram concentrations using high-performance liquid chromatography or immunoassay methodology that is more sensitive than previous available tests. Conventional 24-hour urine collections, in addition to being inconvenient for patients, also show wide variability of albumin excretion, because several factors such as sustained upright posture, dietary protein, and exercise tend to increase albumin excretion rates. For these reasons, it is preferable to measure the albumin-creatinine ratio in an early morning spot urine collected on awakening—prior to breakfast or exercise—and brought in by the patient for laboratory analysis. A ratio of albumin (μg/L) to creatinine (mg/L) of less than 30 is normal, and a ratio of 30 to 300 indicates abnormal microalbuminuria. Values greater than 300 are referred to as macroalbuminuria.
The minimal detection limit of protein on a standard urine dipstick is 10 to 20 mg/dL. If the dipstick is positive then it is likely that the patient has microalbuminuria and this should be specifically tested. The information from a spot urine sample is adequate for diagnosis and treatment and it is not usually necessary to perform a 24-hour urine collection for protein loss and creatinine clearance.
Venous glucose samples should be collected in tubes containing sodium fluoride, which inhibits enolase and prevents glycolysis in the blood sample that would artifactually lower the measured glucose level. In the absence of fluoride, the rate of disappearance of glucose in the presence of blood cells has been reported to average 10 mg/dL/h—the rate increases with glucose concentration, temperature, and white blood cell count. Fluoride takes about 1 hour to effectively stop glycolysis. Therefore, the rate of decline during the first hour is the same in tubes with or without fluoride. A very high white blood cell count will lower glucose levels even in the presence of fluoride. Ideally the blood should be collected in a sodium fluoride/potassium oxalate tube, placed on ice and the plasma separated from the cells within 60 minutes.
Plasma or serum from venous blood samples has the advantage over whole blood of providing values for glucose that are independent of hematocrit and reflect levels in the interstitial spaces to which body tissues are exposed. For these reasons—and because plasma and serum lend themselves to automated analytic procedures—they are used in most laboratories. The glucose concentration is 10% to 15% higher in plasma or serum than in whole blood because structural components of blood cells are absent. Whole blood glucose determinations are seldom used in clinical laboratories, but are used by patients using home blood glucose monitors.
Glucose levels can be measured in the laboratory using enzymatic methods (such as glucose oxidase or hexokinase), condensation methods (such as o-toluidine), or reducing methods. The reducing methods take advantage of the reducing properties of glucose to change the redox state of a metal ion; however, the method is nonspecific and any strong reducing agent can cross-react to yield spuriously elevated glucose values. In condensation methods, the aldehyde group of glucose undergoes condensation with aromatic compounds to yield a colored product. In the most commonly used condensation reaction, o-toluidine reacts with glucose to form a glucosamine that has an intense green color. The colour is measured spectrophotometrically to estimate the glucose concentration. o-Toluidine, however, has the drawback of being highly corrosive and toxic. In the enzymatic method, glucose oxidase reacts with glucose, water, and oxygen to form gluconic acid and hydrogen peroxide. The hydrogen peroxide can then be used to oxidize a chromogen or the consumption of oxygen measured to estimate the amount of glucose present. Current laboratories use enzymatic methods to determine glucose levels.
The range of normal fasting plasma or serum glucose is 70 to 100 mg/dL (3.9-5.5 mmol/L). A plasma glucose level of 126 mg/dL (7.0 mmol/L) or higher on more than one occasion after at least 8 hours of fasting is diagnostic of diabetes mellitus (Table 17–11). Fasting plasma glucose levels of 100 mg/dL (5.6 mmol/L) to 125 mg/dL (6.9 mmol/L) are associated with increased risk for diabetes (impaired fasting glucose).
| Normal Glucose Tolerance | Prediabetes | Diabetes Mellitusa | |
|---|---|---|---|
| Fasting plasma glucose (mg/dL)b | <100 | 100-125 (impaired fasting glucose) | ≥126 |
| 2 h after glucose load (mg/dL)c | <140 | ≥140-199 (impaired glucose tolerance) | ≥200 |
| HbA1c (%)a | <5.7 | 5.7-6.4 | ≥6.5 |
| Symptoms and random glucose level (mg/dL) | − | − | ≥200 |
Related posts:

Stay updated, free articles. Join our Telegram channel

Full access? Get Clinical Tree


