Chapter 1
Nutritional Assessment, Dietary Requirements, Feed Supplementation
Vanessa Shaw and Helen McCarthy
Introduction
This text provides a practical approach to the dietary management of a range of paediatric disorders. The therapies outlined in Parts 2 and 3 describe the dietetic interventions and nutritional requirements of the infant, child and young person in a clinical setting, illustrating how normal dietary constituents are used alongside special dietetic products to allow for the continued growth of the child whilst controlling the progression and symptoms of disease. Nutrition for the healthy child and nutritional care in the community is addressed in Part 4.
The following principles are relevant to the treatment of all infants, children and young people and provide the basis for many of the therapies described later in the text.
Assessment of nutritional status
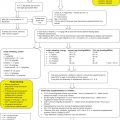
Assessment and monitoring of nutritional status should be included in any dietary regimen, audit procedure or research project where a modified diet has a role. Although the terms are used interchangeably in the literature, nutrition screening is a simple and rapid means of identifying individuals at nutritional risk which can be undertaken by a range of healthcare professionals, whereas nutrition assessment is a more detailed and lengthy means for nutrition experts, i.e. dietitians, to quantify nutritional status.
Nutrition screening
While nutrition screening tools can be used to identify all aspects of malnutrition (excess, deficiency or imbalance in macro and micro nutrients), they are generally used to identify protein energy undernutrition [1]. Despite the recommendations from benchmark standards and national and international guidelines that screening for nutrition risk be an integral component of clinical care for all [2–5], the development of nutrition screening tools for use with children has lagged behind work in the adult world. However, in recent years a number of child specific nutrition screening tools have been developed. Internationally the Nutrition Risk Score (Paris tool), the Subjective Global Nutrition Assessment (SGNA) and the Strongkids tool are available [6–8]. Each of these has strengths and limitations in terms of validity and reliability of the tool, the time taken to complete, and the level of skill required by individuals applying the tool.
Within the UK two child specific tools have been developed: the Screening Tool for the Assessment of Malnutrition in Paediatrics (STAMP) and the Paediatric Yorkhill Malnutrition Score (PYMS) [9, 10]. Both of these tools have been evaluated in practice and comprise a number of elements that are scored to give a final risk score (Table 1.1). The reliability of each of these tools has been published, along with a number of other studies evaluating their use in a variety of clinical settings and conditions [11–13]. The main limitation of these evaluation studies is that they rely on the dietetic assessment of nutritional status as the ‘gold standard’ and the findings of studies comparing the tools to date have been equivocal. There is an ongoing multicentre Europe-wide study under the auspices of the European Society of Paediatric Gastroenterology, Hepatology and Nutrition (ESPGHAN) to evaluate a range of the tools available. Results have not yet been published, but it is hoped that this will form the scientific basis for future developments in this area [14].
Table 1.1 Child specific screening tools developed and evaluated in the UK
| STAMP | PYMS | |
| Criteria utilised | Diagnosis | Diagnosis |
| Dietary intake | Dietary intake | |
| Anthropometrics: | Weight loss | |
| weight and height | Anthropometrics: | |
| centile | BMI | |
| Scored | High/medium/ low risk | High/medium/ low risk |
| Criterion validity | ||
| Agreement with full nutritional assessment* | 54% | 46% |
| Positive predictive value† | 55% | 47% |
| Negative predictive value†† | 95% | 95% |
| Training | 30 minutes | 60 minutes |
| Used by | Any trained healthcare professional | Registered nurses |
STAMP, Screening Tool for the Assessment of Malnutrition in Paediatrics; PYMS, Paediatric Yorkhill Malnutrition Score; BMI, body mass index.
* Children identified as being at nutritional risk by tool and full nutritional assessment.
† The proportion of children identified as at risk by the tool who are actually at risk.
†† The proportion of children identified as not at risk by the tool who are actually not at risk.
Nutritional assessment
Nutritional assessment comprises anthropometric, clinical and dietary assessment, all of which should be used to provide as full a picture of the nutritional status of the individual as possible; no one method will give an overall picture of nutritional status. Within these areas there are several assessment techniques, some of which should be used routinely in all centres, whilst others are better suited to specialist clinical areas or research. This chapter provides a brief overview of the common techniques and sources of further information.
Anthropometry
Measurement of weight and height (or length) is critical as the basis for calculating dietary requirements as well as monitoring the effects of dietary intervention. It is important that all measurements are taken using standardised techniques and calibrated equipment. Ideally staff taking measurements should receive some training on how to do this accurately. There are a variety of online resources to support training in anthropometric measurement of children.
Weight
Measurement of weight is an easy and routine procedure that should be done using a calibrated digital scale. Ideally infants should be weighed naked and children wearing just a dry nappy or pants; however, this is often not possible or appropriate. In these situations it is important to record if the infant is weighed wearing a clean dry nappy, and the amount and type of clothing worn by older children. A higher degree of accuracy is required for the assessment of sick children than for routine measurements in the community. Frequent weight monitoring is important for the sick infant or child, and local policies for weighing and measuring hospitalised infants and children should be in place. Recommendations for the routine measurement of healthy infants where there are no concerns about growth are given in Table 1.2 [15]. If there are concerns about weight gain that is too slow or too rapid, measurement of weight should be carried out more frequently.
Table 1.2 Recommendations for routine measurements for healthy infants and children
| Weight | Length/height | Head circumference |
| Birth | Birth | Birth or neonatal period |
| 2 months | 6−8 weeks if birth weight <2.5 kg or if other cause for concern | 6−8 weeks |
| 3 months | ||
| 4 months | ||
| 8 months | ||
| Additional weights at parent’s request; not more frequently than 2 weekly <6 months, monthly 6−12 months | No other routine measurement of length/height | No other routine measurement of head circumference |
| 12−15 months | ||
| School entry | School entry |
Source: Adapted from Health for all Children [15].
Height
Height or length measurement requires a stadiometer or length board. Measurement of length using a tape measure is too inaccurate to be of use for longitudinal monitoring of growth, although an approximate length may be useful as a single measure. Under the age of 2 years supine length is measured; standing height is usually measured over this age or whenever the child can stand straight and unsupported. When the method of measurement changes from length to height there is likely to be a drop in stature; this is accounted for in the UK-WHO growth charts (p. 6). Measurement of length is difficult and requires careful positioning of the infant; positioning of the child is also important when measuring standing height. It is recommended to have two observers involved in measuring an infant or young child. It is good practice for sick infants to be measured monthly and older children at clinic appointments or on admission to hospital. Healthy infants should have a length measurement at birth but further routine stature checks are not recommended until the preschool check [15]. Whenever there are concerns about growth or weight gain a height measurement should be made more often.
Proxy measurements for length/height
In some cases it is difficult to obtain length or height measurements, e.g. in very sick or preterm infants and in older children with scoliosis. A number of proxy measurements can be used which are useful to monitor whether longitudinal growth is progressing in an individual, but there are no recognised centile charts as yet and indices such as body mass index (BMI) cannot be calculated. In younger adults arm span is approximately equivalent to height, but body proportions depend upon age and while there is some evidence that there is a correlation in older children and adolescents, this measurement may be of limited usefulness in children. Ulna length has been demonstrated to act as a good proxy for stature in adults although evidence in children is limited [16]. Measurements of lower leg length or knee−heel length have been used and are a useful proxy for growth [17]. Total leg length is rarely measured outside specialist growth clinics and is calculated as the difference between measured sitting height and standing height. A number of other measures have been used in children with cerebral palsy as a proxy for height (p. 780), but numbers are too small for reference standards to be established [18]. Formulas for calculating stature in children from proxy measurements are available [19].
Head circumference
Head circumference is generally considered a useful measurement in children under the age of 2 years. After this age head growth slows and is a less useful indicator of somatic growth. A number of genetic and acquired conditions, such as cerebral palsy, will affect head growth and measurement of head circumference will not be a useful indicator of nutritional status in these conditions. Head circumference is measured using a narrow, flexible, non-stretch tape. Accuracy is dependent on the skill of the observer and, as such, training and practice in this technique is a requirement.
Supplementary measurements
While the measurement of weight and length or height forms the basis of routine anthropometric assessment, there are a number of supplementary measurements which can be used. These include the proxy measurements for stature already mentioned and mid upper arm circumference (MUAC). This is a useful measurement in children under the age of 5 years, as MUAC increases fairly rapidly up until this age. Increases in MUAC are less likely to be affected by oedema than body weight; they can also provide a useful method of assessing changes in children with solid tumours and liver disease. There are age related standards for infants and children [19, 20]. Measurement of waist circumference and the index of waist to height can be helpful in the identification and monitoring of overweight and obesity [21–23]. Research has shown links with dyslipidaemias, insulin resistance and blood pressure although the evidence for benefit using waist circumference centiles over BMI centiles is limited [23].
When monitoring interventions, particularly those addressing undernutrition, it is important to determine if changes in weight are due to increases in fat mass or lean muscle mass. In order to fully differentiate between lean and fat, measurement of skinfold thickness (SFT) can be used. This can be unpleasant for young children and is not used as a routine anthropometric measurement in clinical practice, but it can provide valuable data in research studies. The equipment and technique are identical to those used in adults and the measurement is subject to the same high rates of inter-observer and intra-observer error. Reference data for infants and children are available [20] and arm muscle and arm fat area can be calculated. Full details on skinfold measurements and their interpretation has been published elsewhere [19, 24].
Modern technologies can provide information on body composition. Bioelectric impedance analysis is easily undertaken in a clinical setting using foot to foot or hand to foot techniques. However, while studies have reported validity of this method of determining body composition in healthy populations of young children, validity in sick children and infants has yet to be fully established [25, 26]. More invasive technologies for assessing body composition include dual-energy x-ray absorptiometry and air displacement plethysmography. These tend to be restricted to research assessments of body composition and further information can be found elsewhere [19].
Interpreting anthropometric measurements
Anthropometric measurements alone confer limited information on growth, nutritional status and health and require the use of growth reference data and conversion to indices for interpretation.
Growth charts
Measurements should be regularly plotted on a relevant growth chart. In the UK the growth standards are the UK-WHO Growth Charts 0−4 years and the UK Growth Charts 2−18 years [27]. The charts for preschool children incorporate data from the WHO multicentre growth study, a longitudinal study of optimal growth in breast fed singleton births from six countries across the world [28]. Every child in the UK is issued with a growth centile chart as part of the personal child health record that is held by parents and completed by healthcare professionals whenever the child is weighed or measured.
Accuracy is crucial when plotting growth charts, and therefore training is essential as a number of different professionals may be plotting on a single chart and errors could result in the misdiagnosis or non-identification of nutritional and growth problems. When assessing a child in relation to the growth charts a number of factors need to be accounted for including gestational age at birth and parental height. The growth charts give clear guidance on correction for prematurity and the estimation of the child’s adult height.
It can be difficult to assess progress or decide upon targets where a measurement falls outside the nine centile lines (<0.4th centile or >99.6th centile). The Neonatal and Infant Close Monitoring growth charts [27] show −3, −4 and −5 standard deviation lines to allow assessment of very small infants up to the age of 2 years. ‘Thrive lines’ have also been developed to aid interpretation of infants with either slow or rapid weight gain. The 5% thrive lines define the slowest rate of normal weight velocity in healthy infants. If an infant is growing at a rate parallel to or slower than a 5% thrive line, weight gain is abnormally slow. The 95% thrive lines define the most rapid rate of normal weight gain in healthy infants and weight gain that parallels or is faster than the 95% thrive line is abnormally rapid [28]. There are a range of resources available to support training on the plotting and interpretation of growth charts on the Royal College of Paediatrics and Child Health website.
Some medical conditions have a significant effect on growth and where sufficient data exist separate growth charts have been developed, e.g. Down’s syndrome, Turner syndrome, sickle cell disease, achondroplasia.
Body mass index
A BMI measurement can be calculated from weight and height measurements: BMI = weight (kg)/height (m2). This provides an indication of relative fatness or thinness. In children the amount and distribution of body fat is dependent on age and sex. BMI is now routinely used to identify and monitor overweight and obesity in children, on an individual and population basis, in the clinical and research environments [29]. There are limitations, however, to the use of BMI in children:
- It is not recommended in children <2 years of age as during this period BMI changes rapidly and weight gain rather than BMI has been shown to be more indicative of future overweight and obesity [30].
- In chronic undernutrition there is stunting as well as low weight for age and thus undernutrition may be masked by using BMI.
- Although BMI is a relative index of weight to height it does not provide information about body composition; it cannot be used to distinguish between fat mass and lean mass.
Paediatric BMI charts have been developed and can be used to indicate how heavy a child is relevant to its height and age [31]. The UK growth charts have a quick reference guide to estimate BMI centile on the basis of the child’s weight and height centiles.
Anthropometric indices and the classification of nutrition status
The World Health Organization (WHO) and research publications frequently report standard deviation (SD) score or z-score for length/height, weight and BMI. This involves converting the measurement or index into a finite proportion of a reference or standard measurement, the calculation giving a numerical score indicating how far away from the 50th centile for age the child’s measurements/index falls. For the UK growth charts each centile space equates to 0.67SD; therefore a child on the 2nd centile will have a z-score of −2SD and a child on the 98th centile will have a z-score of +2SD; a measurement that falls exactly on the 50th centile will have a z-score of 0SD. Calculation of z-scores by hand is extremely laborious, but a computer software program is available (www.childgrowthfoundation.org) that will enable calculation of z-scores from height, weight, BMI, gender and age data. The z-score can also used when comparing groups of children when a comparison of the measurements themselves would not be useful.
The WHO defines moderate malnutrition and obesity in children in terms of z-score for weight as −2SD and +2SD respectively [28].
The calculation of height for age, height age and weight for height are useful when assessing nutritional status initially or when monitoring progress in children who are short for their chronological age. Table 1.3 shows examples of calculations for these indices. The Waterlow classification [32] may be of use when assessing children in the UK with severe failure to thrive. An adaptation of the classification is shown in Table 1.4. Calculation of height age is necessary when determining nutrient requirements for children who are much smaller (or larger) than their chronological age.
Table 1.3 Height for age, height age and weight for height
| Worked example: 6-year-old girl with cerebral palsy | |
| referred with severe feeding problems | |
| Visit 1 | Decimal age = 6.2 years |
| Height = 93 cm (<0.4th centile) | |
| Weight = 10 kg (<0.4th centile) | |
| 50th centile for height for a girl aged 6.2 years = 117 cm | |
Height for age =  = 79.5% height for age = 79.5% height for age | |
| Height age is the age at which 93 cm (measured height) falls on 50th centile = 2.7 years | |
| 50th centile for weight for 2.7 years = 14 kg | |
Weight for height =  = 71% weight for height = 71% weight for height | |
| Visit 2 | Decimal age = 6.8 years |
| (after intervention) | Height = 95.5 cm (<0.4th centile) |
| Weight = 12 kg (<0.4th centile) | |
| 50th centile for height for a girl aged 6.8 years = 121 cm | |
Height for age =  = 79% height for age = 79% height for age | |
| Height age = 3.1 years | |
| 50th centile for weight for age 3.1 years = 14.5 kg | |
Weight for height =  = 82.7% weight for height = 82.7% weight for height | |
| Conclusions: the girl has shown catch-up weight gain. | |
| Weight for height has increased from 71% to 83%. She has | |
| continued to grow in height, but has not had any catch-up | |
| height. Her height continues to be about 79% of that | |
| expected for her chronological age | |
Table 1.4 Classification of malnutrition
| Acute malnutrition (wasting) | Chronic malnutrition (stunting ± wasting) |
| Weight for height | Height for age |
| 80%−90% standard – | 90%−95% standard – |
| grade 1 | grade 1 |
| 70%−80% standard – | 85%−90% standard – |
| grade 2 | grade 2 |
| <70% standard – grade 3 | <80% standard – grade 3 |
Source: Adapted from Waterlow [32].
Clinical assessment
Clinical assessment of the child involves a medical history and a physical examination. The medical history will identify medical, social or environmental factors that may be risk factors for the development of nutritional problems. Such factors may include parental knowledge and finance available for food purchase, underlying disease, treatments, investigations and medications. Clinical signs of poor nutrition, revealed in the physical examination, only appear at a late stage in the development of a deficiency disease and absence of clinical signs should not be taken as indicating that a deficiency is not present.
Typical physical signs associated with poor nutrition which have been described in children in western countries are summarised in Table 1.5. Physical signs represent very general changes and may not be due to nutrient deficiencies alone. Other indications such as poor weight gain and/or low dietary intake are needed in order to reinforce suspicions, and biochemical and haematological tests should be carriedo ut to confirm the diagnosis. These include the analysis of levels of nutrients or nutrient dependent metabolites in body fluids or tissues, or measuring functional impairment of a nutrient dependent metabolic process. The most commonly used tissue for investigation is the blood. Whole blood, plasma, serum or blood cells can be used, depending on the test. Tests may be static, e.g. levels of zinc in plasma, or may be functional, e.g. the measurement of the activity of glutathione peroxidase, a selenium dependent enzyme, as a measure of selenium status.
Table 1.5 Physical signs of nutritional problems
| Assessment | Clinical sign | Possible nutrient(s) |
| Hair | Thin, sparse | Protein and energy, |
| Colour change – ‘flag sign’ | zinc, copper | |
| Easily plucked | ||
| Skin | Dry, flaky | Essential fatty acids |
| B vitamins | ||
| Rough, ‘sandpaper’ texture | Vitamin A | |
| Petechiae, bruising | Vitamin C | |
| Eyes | Pale conjunctiva | Iron |
| Xerosis | Vitamin A | |
| Keratomalacia | ||
| Lips | Angular stomatitis | B vitamins |
| Cheilosis | ||
| Tongue | Colour changes | B vitamins |
| Teeth | Mottling of enamel | Fluorosis |
| (excess fluoride) | ||
| Gums | Spongy, bleed easily | Vitamin C |
| Face | Thyroid enlargement | Iodine |
| Nails | Spoon shape, koilonychia | Iron, zinc, copper |
| Subcutaneous | Oedema | Protein, sodium |
| tissue | Over-hydration | |
| Depleted subcutaneous fat | Energy | |
| Muscles | Wasting | Protein, energy, zinc |
| Bones | Craniotabes | Vitamin D |
| Parietal and frontal bossing | ||
| Epiphyseal enlargement | ||
| Beading of ribs |
Although an objective measurement is obtained from a blood test there are a number of factors that can affect the validity of such biochemical or haematological investigations:
- Age specific normal ranges need to be established for the individual centre unless the laboratory participates in a regional or national quality control scheme.
- Recent food intake and time of sampling can affect levels and it may be necessary to take a fasting blood sample for some nutrients.
- Physiological processes such as infection, disease or drugs may alter normal levels.
- Contamination from exogenous materials such as equipment or endogenous sources such as sweat or interstitial fluid is important for nutrients such as trace elements, and care must be taken to choose the correct sampling procedure.
A summary of some biochemical and haematological measurements is given in Table 1.6.
Table 1.6 Biochemical and haematological tests
| Nutrient | Test | Normal values in children | Comments |
| Biochemical tests | |||
| Protein | Total plasma protein | 55−80 g/L | Low levels reflect long term not acute depletion |
| Albumin | 30−45 g/L | ||
| Caeruloplasmin | 0.18−0.46 g/L | Low levels indicate acute protein depletion, | |
| Retinol binding protein | 2.6−7.6 g/L | but are acute phase proteins which increase during infection | |
| Thiamin | Erythrocyte transketolase | 1−1.15 | High activity coefficient (>1.15) indicates thiamin deficiency |
| activity coefficient | |||
| Vitamin B12 | Plasma B12 value | 263−1336 pmol/L | Low levels indicate deficiency |
| Riboflavin | Erythrocyte glutathione reductase activity coefficient | 1.0−1.3 | High activity coefficient (>1.3) indicates riboflavin deficiency |
| Vitamin C | Plasma ascorbate level | 8.8−124 µmol/L | Low levels indicate deficiency |
| Vitamin A | Plasma retinol level | 0.54−1.56 µmol/L | Low level indicates deficiency |
| Vitamin D | Plasma 25-hydroxy-colecalciferol level | 30−110 nmol/L | Low level indicates deficiency |
| Vitamin E | Plasma tocopherol level | α-tocopherol | Low levels indicate deficiency |
| 10.9−28.1 µmol/L | |||
| Copper | Plasma level | 70−140 µmol/L | Low levels indicate deficiency |
| Selenium | Plasma level | 0.76−1.07 µmol/L | Low levels indicate deficiency |
| Glutathione peroxidase | >1.77 µmol/L | Low levels indicate deficiency | |
| activity | |||
| Zinc | Plasma level | 10−18 µmol/L | Low levels indicate deficiency |
| Haematology tests | |||
| Folic acid | Plasma folate | 7−48 nmol/L | Low levels indicate deficiency |
| Red cell folate | 429−1749 nmol/L | Low levels indicate deficiency | |
| Haemoglobin | Whole blood | 104−140 g/L | Levels <110 g/L indicate iron deficiency |
| Red cell distribution width | Whole blood | <16% | High values indicate iron deficiency |
| Mean corpuscular volume | Whole blood | 70−86 fL | Small volume (microcytosis) indicates iron deficiency |
| Large volume (macrocytosis) indicates folate or B12 deficiency | |||
| Mean cell haemoglobin | Whole blood | 22.7−29.6 pg | Low values indicate iron deficiency |
| Percentage hypochromic cells | Whole blood | <2.5% | High values (>2.5%) indicate iron deficiency |
| Zinc protoporphyrin | Red cell | 32−102 µmol/mol haem | High levels indicate iron deficiency |
| Ferritin | Plasma level | 5−70 µg/L | Low levels indicate depletion of iron stores. Ferritin is an acute phase protein and increases during infection |
Urine is often used for adult investigations, but many tests require the collection of a 24 hour urine sample and this is difficult in babies and children. The usefulness of a single urine sample for nutritional tests is limited and needs to be compared with a standard metabolite, usually creatinine. However, creatinine excretion itself is age dependent and this needs to be taken into consideration. Stool samples can be useful in determining reasons for malabsorption if suspected. Hair and nails have been used to assess trace element and heavy metal status in populations, but a number of environmental and physiological factors affect levels and these tissues are not routinely used in the UK. Tissues that store certain nutrients, such as the liver and bone, also provide useful materials for investigation, but sampling is too invasive for routine clinical use.
A more detailed overview of clinical assessment can be found elsewhere [19].
Dietary intake
For children over the age of 2 years food intake is assessed in the same way as for adults: using a recall diet history; a quantitative food diary or food record chart at home or on the ward, recorded over a number of days; a weighed food intake over a number of days; or a food frequency questionnaire. These methods are not mutually exclusive and combinations are often used to provide the greatest depth of information. There are benefits and limitations to each of these methods and these are summarised in Table 1.7 [19, 33].
Table 1.7 Strengths and limitations of dietary assessment methodologies for individuals
| Method | Strength | Limitation |
| 24 hour recall |