Major features
Minor features
Café au lait spots and skin freckling
Macrocephaly
Peripheral neurofibromas
Short stature as growth hormone deficiency found in NF1 patients that do not even have hypothalamic lesions
Lisch nodules (iris hamartomas)
Hypsarrhythmia
Plexiform neurofibromas
Intellectual difficulties (e.g., learning difficulties)
CNS tumors (optic gliomas, spinal neurofibromas)
Epilepsy
Distinctive osseous lesions (ribbon ribs, sphenoid wing dysplasia, pseudarthroses, or thinning of long bone cortex)
Hypertension – may be due to aortic coarctation, renal artery stenosis, or pheochromocytoma
- 1.
Six or more café au lait spots (greatest diameter >5 mm if prepubertal, >15 mm if postpubertal)
- 2.
Two or more neurofibromas of any type or one or more plexiform neurofibromas
- 3.
Freckling in the axilla or inguinal regions (Crowe’s sign)
- 4.
Two or more Lisch nodules (iris hamartomas)
- 5.
An optic pathway tumor
- 6.
A distinctive osseous lesion such as sphenoid wing dysplasia or thinning of the cortex of the long bones with or without pseudarthroses
- 7.
First-degree relative (parent, sibling, or offspring) with NF1 by the aforementioned criteria
There is an increased incidence of specific CNS neoplasms in patients with NF1 (Korf 2000; Rosser and Packer 2002). The most common NF1-associated tumors are optic gliomas, especially chiasmatic gliomas, the majority of which are diagnosed in childhood (Turgut et al. 1991; Balestri et al. 1993). Studies suggest that up to 30 % of patients with optic pathway glioma have stigmata of NF1 (Dutton 1994) and 5–25 % of patients with NF1 have signs of optic pathway glioma (Listernick et al. 2007), suggesting that many NF1 patients are asymptomatic and, therefore, might never be diagnosed. If symptomatic, these tumors may present with decreased visual acuity, visual field defects, proptosis, and precocious puberty due to hypothalamic compression. To date, there is no consensus regarding the frequency of follow-up MRIs required, and it can vary from every 3 to 24 months (Listernick et al. 2007). Some studies argue that assessing the visual system is sufficient to follow these patients and that MRI studies are not indicated in patients with no clinical signs of disease progression (Listernick and Charrow 2004; Listernick et al. 2007).
In addition to optic gliomas, NF1 is associated with an increased incidence of parenchymal gliomas, particularly in the brainstem, cerebellar peduncles, globus pallidus, and midbrain. The biologic behavior of brainstem gliomas in patients with NF1 differs significantly from that of lesions with similar appearance in patients without NF1 (Pollack et al. 1996; Listernick et al. 1999). In general, patients with NF1 and brainstem gliomas have better outcomes than nonaffected children (Sevick et al. 1992; Listernick et al. 1994). A recent study identified 23 patients out of 125 with NF1 (18.4 %) who presented with brainstem mass lesions. Reported outcome was favorable; 17/23 untreated and 6/23 treated patients were alive with stable or decreased disease burden on MRI at median follow-up of 67 and 102 months, respectively. Only one previously untreated patient experienced disease progression (Ullrich et al. 2007). Brainstem tumors should not be confused with nonspecific white matter changes, which are frequently found on MRI in patients with NF1 and are of unknown clinical significance (Sevick et al. 1992; van Engelen et al. 2008). These unidentified bright objects are normally not associated with mass effect, edema, or contrast enhancement and tend to decrease in size over time. Besides astrocytomas, CNS neoplasms that occur at higher rates in NF1 patients are ependymomas, meningiomas, and medulloblastomas.
NF1 patients develop not only CNS lesions but also peripheral nervous system tumors. Neurofibromas and schwannomas arise most commonly from major peripheral nerves particularly radial and ulnar nerves. The incidence of symptomatic neurofibromas in NF1 patients is 4 %, and the incidence of asymptomatic but radiographically evident tumors is >25 %. Malignant transformation leads to malignant peripheral nerve sheath tumors. These tumors occur in less than 5 % of children with NF1, but are the leading cause of mortality in adults with NF1 (Rasmussen et al. 2001). Malignant peripheral nerve sheath tumors (MPNST) are chemoresistant sarcomas associated with poor 5-year survival rates despite aggressive therapy. The impact of NF1 diagnosis on the prognosis of MPNST is controversial (LaFemina et al. 2013; Kolberg et al. 2013; Porter et al. 2009). The clinical signs associated with malignant transformation are rapid growth and/or pain. FDG-PET is increasingly relied upon to identify lesions suspicious for malignant transformation (Benz et al. 2010; Tsai et al. 2012). Surgical resection remains the mainstay of therapy. The other indication for surgical resection is a large tumor that creates a cosmetic problem. Patients with NF1 are also at risk for non-CNS tumors, including Wilm’s tumor, rhabdomyosarcoma, leukemia, melanoma, medullary thyroid carcinoma, and pheochromocytoma.
12.2.4 Natural History and Prognosis
NF1 is a progressive disease that can affect almost any organ (Rasmussen et al. 2001; Korf 2002), and overall survival is less than that of the general population (Sorensen et al. 1986; Evans et al. 2011; Duong et al. 2011); however, outcomes remain highly variable even within individual families. The causes of death in NF1 patients include malignant peripheral nerve sheath tumors, CNS tumors, and systemic conditions such as hypertension due to the associated vasculopathies leading to renal artery stenosis. Patients with NF1 are 34 times more likely to have malignant connective tissue or soft tissue neoplasms than non-NF1 individuals (Rasmussen et al. 2001). In population-based cohorts that include children with NF1, a ~4000–8000-fold increased risk of death from MPNST is seen when compared to the non-NF1 population (Evans et al. 2011).
12.2.5 Laboratory Studies
A wide variety of mutations in the NF1 gene have been identified. Current molecular technology is able to identify NF1 mutations in greater than 95 % of cases (Messiaen et al. 2000). Next-generation sequencing has been successfully deployed in the molecular diagnosis of NF1 patients and may facilitate genotyping NF1 mosaic patients as well as identification of second-hit mutations in NF1-associated tumor specimens (Pasmant et al. 2015). However, to date, the majority of cases are identified on a clinical basis, and therefore genetic testing should be reserved for when there is uncertainty in the clinical diagnosis. Prenatal diagnosis is also available for couples with a positive family history of NF1.
12.2.6 Imaging Studies
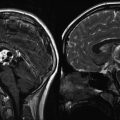
With MR brain imaging, optic nerve gliomas are easily visible with enlargement of the optic nerve(s), chiasm, and/or optic tract (Fig. 12.1). Asymptomatic optic gliomas are present in up to 20 % of NF1 patients. The extent of involvement is often underestimated with T1-weighted images, while T2-weighted images provide better representation of the involved areas. Contrast enhancement can occur and may be heterogeneous or homogeneous. Brainstem gliomas are relatively common (Aoki et al. 1989; Balestri et al. 1993; Mukonoweshuro et al. 1999; Kornreich et al. 2001; Fischbein et al. 2000). Parenchymal tumors (usually astrocytomas) have a predilection for the thalami and basal ganglia and appear as T2 prolonging mass lesions with variable post-gadolinium enhancement.
Fig. 12.1
Optic pathway gliomas associated with NF1. (a) The T1-weighted axial images show asymmetry of the optic chiasm with the left optic nerve being larger than the right. The mass did not enhance following gadolinium administration. (b) A sagittal T1-weighted image shows the thickened chiasm directly above the pituitary gland
Nonenhancing foci of T2 prolongation within deep gray nuclei and the white matter have a poorly understood underlying etiology (Billiet et al. 2014) and can be difficult to distinguish from suspected low-grade brainstem gliomas on MR imaging in the setting of NF1 (Hervey-Jumper et al. 2013). Their natural history is reflective of an indolent process with reports of spontaneous regression. These are most common in the globus pallidus, followed by the cerebellum and brainstem, internal capsules, centrum semiovale, and corpus callosum and occur in up to 60 % of NF1 patients (Fig. 12.2). The T2-weighted signal characteristics are variable.
Fig. 12.2
White matter lesions associated with NF1. These lesions are best seen on T2-weighted images. (a) In this axial image, there are bilateral lesions (larger on the patient’s left side) within the basal ganglia that do not produce much mass effect. These lesions do not enhance following gadolinium administration. (b) Similar lesions may be seen in the posterior fossa. Here, the area of T2 prolongation extends from the cerebellar peduncle toward the pons
MRI remains a mainstay modality for detection and surveillance of peripheral neurofibromas in NF1 patients. Recent reports suggest a promising role of whole-body MRI for rapid, comprehensive, and quantitative assessment of neurofibroma tumor burden (Plotkin et al. 2012). FDG-PET imaging has shown promise in differentiating MPNST from non-degenerated neurofibromas in the setting of NF1 (Benz et al. 2010; Tsai et al. 2012).
12.2.7 Treatment
Patients with NF1 should have a thorough annual physical examination including visual field testing. Although the value of screening imaging studies is not proven, most patients at some point undergo a screening MRI of the brain and spine. Even if a mass is identified, treatment focuses on symptomatic lesions (Turgut et al. 1991; Pollack et al. 1996). Most optic pathway gliomas associated with NF1 are asymptomatic, and some have been noted to regress spontaneously (Parsa et al. 2001). Pathologically, these tumors are mainly pilocytic astrocytomas, classified as WHO grade I, with more indolent clinical courses than in non-NF1 patients. The role of surgery in patients with optic pathway gliomas remains controversial. Consensus for surgical intervention exists for single-nerve lesions, which cause disfiguring symptoms for patients. Surgery might also be beneficial if there are signs of increased intracranial pressure, mass effect, or hydrocephalus (Medlock et al. 1997; Astrup 2003). Rapidly growing tumors, more frequently located in the hypothalamus and chiasm, benefit from early surgical resection to preserve vision and reduce mass effect (Listernick et al. 2007).
Radiation therapy is discouraged in patients with NF1, mainly due to the development of neurovascular, endocrine and neuropsychological side effects as well as the high risk of developing secondary malignancies (Madden et al. 2014; Grill et al. 1999; Sharif et al. 2006). In a prospective trial of conformal radiation therapy for pediatric low-grade glioma that included 13 patients with NF1, the presence of NF1 was associated with lower baseline intellectual function as compared to non-NF1 patients and with a greater decline in behavioral assessment scores following radiation treatment (Merchant et al. 2009). With respect to secondary malignancy risk, one study showed that three out of five patients with NF1 and optic pathway glioma, who were treated with radiation therapy for disease progression, developed a secondary CNS tumor, whereas none of the patients with sporadic tumors developed a secondary tumor (Singhal et al. 2002). Similarly, in another study of neurofibromatosis patients treated with radiotherapy, local control was achieved with irradiation in three of five low-grade glioma patients, while two patients progressed to high-grade glioma in the radiation field (Wentworth et al. 2009). By contrast, a prospective study of radiation or chemotherapy for progressive pediatric low-grade glioma reported no untoward radiation-associated acute or late effects in ten NF1 patients who had received radiation therapy with a median follow-up of 5.2 years for this subgroup. Only three of these patients demonstrated post-radiation tumor progression (Hernaiz Driever and von Hornstein 2010).
Slow enlargement of optic pathway gliomas clearly demonstrated on serial imaging studies and accompanied by symptoms can be managed by systemic chemotherapy. A recent expert consensus statement recommends nonsurgical treatment of hypothalamic–chiasmatic low-grade gliomas if visual function is threatened or if symptomatic progression is documented. Surgical intervention was not recommended as frontline therapy in the majority of cases (Walker et al. 2013). A retrospective multicenter study of visual outcomes after chemotherapy in 115 patients with NF1-associated optic pathway glioma revealed improved and stable visual acuity after chemotherapy in 32 % and 40 % of patients, respectively (Fisher et al. 2012). A large phase II study found that 22 NF1 patients with low-grade gliomas who were treated with chemotherapy had better overall survival than non-NF1 patients (Gururangan et al. 2002). Patients were treated if they met one or more of the following criteria: (a) >25 % increase in the size of the tumor (Fig. 12.3a, b), (b) papilledema, (c) loss of vision, (d) increase in proptosis, or (e) increase in the diameter of the optic nerve >2 mm. An increased response rate following chemotherapy in NF1-associated pediatric low-grade gliomas as compared to sporadic pediatric low-grade gliomas was also observed in the long-term follow-up results of the large HIT-LGG-1996 protocol in Europe (Gnekow et al. 2012) and in preliminary results of the COG protocol A9952 (Kalamarides et al. 2012). It is yet unclear, however, whether the overall favorable prognosis of these lesions in the setting of NF1 is attributable predominantly to increased chemosensitivity versus an intrinsically indolent natural history.
Fig. 12.3
Large optic pathway glioma in a patient with NF1. This 3-year-old-girl presented with visual loss and was noted to have an extremely large optic glioma as seen on axial (a) and coronal (b) T1-weighted images following contrast administration. The optic chiasm and nerves cannot be differentiated from the tumor. Because of the degree of visual loss, the patient underwent biopsy to confirm the diagnosis and then was started on chemotherapy
Usually, protocols tailored for low-grade astrocytic tumors are used (see Chap. 1). There have been early reports of promising activity of bevacizumab associated with long-term survival in NF1-associated high-grade glioma (Theeler et al. 2014). Surgery is often required for plexiform neurofibromas that have become disfiguring or painful, and multiple targeted biologic-based approaches have been investigated in recent early phase trials. Unfortunately, many rationally selected agents failed translation from animal models to phase I and phase II trials in the setting of NF1 (Agarwal et al. 2014). However, there have been preliminary signs of promise in phase II trials of the farnesyltransferase inhibitor tipifarnib (Widemann et al. 2014a) and the c-Kit inhibitor imatinib (Robertson et al. 2012) in the treatment of NF1-associated neurofibromas. Encouraging preliminary results have also been seen in a trial of the MEK inhibitor selumetinib in NF1-associated inoperable plexiform neurofibromas (Widemann et al. 2014b). See http://www.ctf.org for ongoing NF1 patient trials.
12.3 Neurofibromatosis Type 2
12.3.1 Epidemiology
NF2 is inherited in an autosomal dominant manner with an incidence of 1:37,000 and has no gender predilection (Mautner et al. 1993; Parry et al. 1994). Generally NF2 patients become symptomatic at puberty or thereafter, but age of onset is highly variable. The mean age of onset of symptoms is approximately 17 years, usually with tinnitus and/or acute hearing loss due to vestibular tumors.
12.3.2 Molecular Biology and Cytogenetics
The NF2 gene is located on chromosome 22q12, and the protein consists of 595 amino acids. It was identified in 1993 in two different laboratories and named merlin and schwannomin (Rouleau et al. 1993; Bianchi et al. 1994). The name merlin refers to a high degree of homology with a family of F-actin-binding proteins including moesin, ezrin, and radixin (De Vitis et al. 1996a, b).
Merlin localizes at the cell membrane and acts as a membrane-cytoskeletal linker. It can revert Ras-induced malignant phenotypes, indicating that the NF2 gene product has a tumor suppressor activity. More recently, merlin has been shown to control a broad cellular proliferation signaling program through inhibition of the CRL4DCAF1 E3 ubiquitin ligase and modulation of the Hippo signaling pathway by a variety of mechanisms (Cooper and Giancotti 2014; Karajannis and Ferner 2015). Multiple canonical downstream growth signaling pathways including Rac-PAK, PI3K-Akt, FAK-Src, and EGFR-Ras-Erk appear to be negatively regulated by active merlin. Mechanistic links between these canonical pathways and upstream events in the setting of merlin inactivation remain to be fully elucidated.
Despite considerable efforts, it also remains unclear if any of the known merlin-regulated signaling pathways are keys to the development of NF2-associated tumors (Scoles 2008). Mutations leading to the loss of merlin expression are the most common gene defect in meningiomas. A total of 50–60 % of all spontaneous meningiomas and NF2-associated meningiomas have mutations in the NF2 gene. Schwannomas are caused by loss of merlin expression, whereas only 29–38 % of ependymomas show alteration in merlin expression (Lamszus et al. 2001; Rajaram et al. 2005). Mutations of the NF2 gene occur not only in neoplasms associated with NF2 but also in 30 % of melanomas and 41 % of mesotheliomas (De Vitis et al. 1996a, b). It remains unclear why NF2 mutations predispose to the formation of bilateral vestibular schwannomas.
Recently, a third disorder within neurofibromatosis was distinguished as schwannomatosis. This disorder is characterized by the presence of schwannomas of cranial nerves other than the vestibular nerve. This disorder has been associated with two genes on chromosome 22 near the NF2 locus, SMARCB1, and LZTR1 (Paganini et al. 2015).
12.3.3 Diagnostic Criteria and Clinical Features
Clinical criteria are used to diagnose NF2 (Table 12.2). Bilateral vestibular schwannomas, which are characteristic lesions in patients with NF2, usually present with tinnitus and/or hearing loss (Uppal and Coatesworth 2003). These tumors are found in 96 % of NF2 patients: bilateral in 90 %, and unilateral in 6 %. Vestibular schwannomas were formerly called acoustic neuromas, an inaccurate term because they arise from Schwann cells and typically involve the vestibular rather than the acoustic (cochlear) branch of the eighth cranial nerve. NF2 patients exhibit an overall predilection for tumors of the meninges and Schwann cells and may also present with facial nerve, trigeminal nerve, and multiple spinal nerve schwannomas, as well as meningiomas and retinal hamartomas. Symptoms at time of presentation include hearing loss, tinnitus, and disequilibrium from vestibular schwannomas. NF2 patients under 10 years of age present most commonly with visual deficits or rapidly growing skin tumors.
Table 12.2
NF2 diagnostic criteria
Primary criteria | Additional criteria |
|---|---|
Bilateral eighth cranial nerve masses (vestibular schwannomas) seen with imaging techniques | Unilateral vestibular schwannoma and any two of glioma, meningioma, neurofibroma, schwannoma, or posterior subcapsular lenticular opacities |
Family history of NF2 and unilateral vestibular schwannoma or any two of glioma, neurofibroma, meningioma, schwannoma, or posterior subcapsular lenticular opacities | Multiple (2 or more) meningiomas and unilateral vestibular schwannoma or any two of the following schwannoma, glioma, neurofibroma, or cataract |
NF2 patients develop other central neurofibromas including paraspinal tumors that may compress the spinal cord and present with myelopathy. These lesions are surprisingly common (67–90 %) in patients with NF2 and are a source of major morbidity and mortality (Mautner et al. 1995; Dow et al. 2005). Additional lesions associated with NF2 include posterior subcapsular cataracts (63 %), retinal hamartomas, optic nerve sheath meningiomas, meningiomas, ependymomas (usually spinal cord), gliomas, and trigeminal schwannomas (Mautner et al. 1996).
12.3.4 Natural History and Prognosis
The mean age of onset of symptoms is 17 years, while the mean age of NF2 diagnosis is 22 years. Relentless progression of vestibular schwannomas and other tumors may lead to loss of vision, paresis, and eventual death from brainstem compression (Parry et al. 1994). Overall, NF2 patients have been demonstrated to have a decreased life expectancy as compared to the general population (Wilding et al. 2012). However, the prognosis for NF2 patients is variable, as a spectrum of phenotypes exists. The type of mutation in the NF2 gene influences the disease severity. Constitutional nonsense and frameshift mutations that cause protein truncation confer a poorer phenotype (Baser et al. 2004; Selvanathan et al. 2010). Early detection offers distinct advantages to the patients as hearing preservation remains a challenge. The diagnosis of NF2 increases the likelihood of developing CNS tumors (schwannomas, meningiomas, gliomas, and neuromas) that may involve the brain, cranial nerves, or spinal cord.
12.3.5 Laboratory Studies
Laboratory diagnosis relies on the presence of DNA mutation in the NF2 gene and requires linkage studies from DNA derived from at least two affected family members.
12.3.6 Imaging Studies
Schwannomas on CT head scanning are round or ovoid extra-axial masses. They are iso- to mildly hypodense on noncontrast CT scan, unless cystic or hemorrhagic. Meningiomas are dural-based, extra-axial masses, often with an associated dural tail. They are typically isodense to brain on nonenhanced CT scan (Aoki et al. 1989; Mautner et al. 1996; Fischbein et al. 2000).
On MR imaging, schwannomas are iso- to mildly hypointense compared to brain parenchyma on T1-weighted images. They are iso- to hyperintense to brain parenchyma on T2-weighted images. Intense homogeneous enhancement after contrast administration is typically seen (Fig. 12.4a), although areas of cystic change or hemorrhage may lead to heterogeneous enhancement. Large lesions may cause brainstem compression and/or hydrocephalus. The multilobulated-appearing vestibular schwannomas often seen in NF2 have recently been shown to consist of mixed cell populations bearing a variety of somatic NF2 mutations, suggestive of a collision between several distinct tumor clones, which may account for their relative resistance to treatment (Dewan et al. 2015).
Fig. 12.4
NF2 tumors. (a) Typical appearance of bilateral vestibular schwannomas in a teenage girl. On this fat-suppressed T-weighted axial image, the tumors are clearly seen arising from the internal acoustic meatuses on either side. (b) This patient has much larger bilateral schwannomas although convexity and falcine meningiomas are also visualized
12.3.7 Treatment
The best approach to the management of schwannomas remains controversial, although expert consensus recommendations have been published (Blakeley et al. 2011). Hearing loss in the setting of vestibular schwannomas generally progresses slowly, and if the lesions are small and asymptomatic, patients can be followed by serial imaging studies. A natural history study performed on a large, newly diagnosed NF2 patient cohort with vestibular schwannomas showed rates of hearing decline of 5 % at 1 year, 13 % at 2 years, and 16 % at 3 years. Rates of radiographic tumor progression in this population were higher: 31 % at 1 year, 64 % at 2 years, and 79 % at 3 years (Plotkin et al. 2014). Any progression of symptoms such as hearing loss may be considered failure of conservative management. By contrast, large lesions >3 cm are approached with frontline surgery, and those with brainstem compression may require urgent surgical intervention (Blakeley et al. 2011).
Vestibular schwannoma surgery is challenging and often is performed by multidisciplinary teams of neurosurgeons and neuro-otologists. Several surgical approaches have been described including translabyrinthine, middle cranial fossa, and suboccipital, each with its own advantages and potential risks. Ipsilateral facial nerve damage has been reported in 17 % of patients undergoing removal of vestibular schwannomas greater than 2.5 cm (Grey et al. 1996). This complication can have significant impact on patient quality of life.
Recently, radiosurgery has become more popular in the management of vestibular schwannomas. The main goal of radiosurgery is tumor control, which appears to be decreased in the setting of NF2 as compared to patients with sporadic vestibular schwannomas. In one large retrospective single institutional series of NF2-associated vestibular schwannomas treated with radiosurgery, 8-year local control was 50 % and 3-year hearing preservation was 40 % (Rowe et al. 2008), though subsequent, smaller, series have reported more favorable tumor control outcomes (e.g., Mallory et al. 2014). While secondary malignancies and malignant transformation of vestibular schwannomas following radiosurgery are rare, the majority of described cases have been in the setting of preexisting NF2, suggesting that these patients are at an increased risk of radiation-induced cancer induction (Balasubramaniam et al. 2007).
The therapeutic landscape in NF2-associated lesions has recently been transformed by successes in early trials of targeted biologic therapies based on our evolving understanding of schwannoma biology and the signaling consequences of merlin loss. Schwannomas are known to express high levels of the pro-angiogenic signaling factor VEGF (Caye-Thomasen et al. 2003). In a pilot trial of the anti-VEGF antibody bevacizumab in ten NF2 patients with progressive vestibular schwannoma who were not candidates for standard therapy, six patients exhibited radiographic tumor responses, and four of seven hearing-evaluable patients had objective improvement in hearing (Plotkin and Stemmer-Rachamimov 2009). Similarly promising tumor and hearing response rates were seen in a larger bevacizumab-treated NF2 cohort with longer-term follow-up; however, continuous therapy was required for sustained responses (Plotkin et al. 2012). Unfortunately, in NF2-associated meningiomas, bevacizumab responses were transient and much less frequent, implicating signaling pathways other than VEGF in the growth of these entities (Nunes et al. 2013). Based on the finding that the EGFR signaling pathway was negatively regulated by NF2 (Curto et al. 2007), a recent phase II trial of the EGFR/ErbB2 inhibitor lapatinib in children and adults with NF2-associated vestibular schwannomas revealed volumetric responses in 24 % of patients and hearing responses in 31 % of patients with a median time to overall progression of 14 months (Karajannis et al. 2012). mTOR signaling was also shown to be dysregulated in preclinical models of NF2; however, a recent phase II study of the mTOR inhibitor everolimus in NF2-associated vestibular schwannoma was negative (Karajannis et al. 2014). At this time, more clinical experience is warranted to better define the most effective treatment(s) and key criteria for initiating therapy. Multiple rationally informed clinical trials of a variety of targeted agents in NF2 including lapatinib, axitinib, everolimus, and bevacizumab are ongoing (Karajannis and Ferner 2015).
12.4 Tuberous Sclerosis Complex
12.4.1 Epidemiology
Tuberous sclerosis complex (TSC), previously known as Bourneville’s disease, is an autosomal dominant disorder with a growing incidence currently estimated to be 1:6000 to 1:9000 due to improved diagnostic tests (Roach and Sparagana 2004). There is no race or gender predilection, and onset of symptoms varies from infancy to late childhood (Roach et al. 1998; Sparagana and Roach 2000).
12.4.2 Molecular Biology and Genetics
TSC is genetically heterogeneous with two implicated genes: TSC1 on chromosome 9q34 encodes hamartin, a 130 kDa tumor suppressor protein, and TSC2 on chromosome 16p13 encodes tuberin, a 200 kDa tumor suppressor protein. Both proteins form a ubiquitous intracellular complex called the TSC complex, which is involved in many cell regulatory processes.
Through the GTPase-activating function of tuberin, the TSC tumor suppressor complex drives the small GTPase, termed Ras homolog enhanced in brain (Rheb), into the inactive guanosine diphosphate-bound state. Rheb in the guanosine triphosphate-bound active state is a positive effector of mammalian target of rapamycin (mTOR). Mutations in either hamartin or tuberin drive Rheb into the guanosine triphosphate-bound state, which results in constitutive mTOR signaling. mTOR appears to mediate many of its effects on cell growth through the phosphorylation of the ribosomal protein S6 kinases (S6Ks) and the repressors of protein synthesis initiation factor eIF4E, the 4EBPs. The S6Ks act to increase cell growth and protein synthesis, whereas the 4EBPs serve to inhibit these processes. mTOR interacts with the S6Ks and 4EBPs through an associated protein, raptor.
Mutation of tuberin or hamartin leads to constitutive activation of mTOR, which results in the hamartomatous lesions in the brain, kidney, heart, lung, CNS, and other organs of the body. More aggressive tumors, such as angiomyolipomas, can also arise. Such mutations are commonly found in patients with TSC, but up to one third of clinically diagnosed patients have no discernable mutation (Jones et al. 2000). This might be in part due to somatic mosaicism. Reasons for the clinical variability associated with identical mutations remain elusive. Recent reports suggest that patients with mutations in TSC1 gene are less severely affected than patients with mutations in the TSC2 gene, a finding that provides some help when counseling parents (Jansen et al. 2008; van Eeghen et al. 2012).
12.4.3 Diagnostic Criteria and Clinical Features
TSC is characterized by seizures, behavioral problems, mental retardation, and development of benign tumors (hamartomas) in multiple organs. The classic TSC triad consists of seizures, mental retardation, and adenoma sebaceum (Hanno and Beck 1987; Curatolo 1996; Roach et al. 1998). Adenoma sebaceum are pathologically best characterized as facial angiofibromas. The CNS lesions seen with TSC include cortical tubers, subependymal nodules, and subependymal giant cell astrocytomas (SEGA). Cortical tubers present a hallmark for the disease. They form during development and represent a disorder of neural proliferation. Recently updated diagnostic guidelines rely upon molecular testing and a variety of clinical criteria to establish the diagnosis of TSC (Table 12.3). A definite diagnosis of TSC requires identification of a pathogenic mutation in TSC1 or TSC2 or a combination of either two major features or one major feature and two minor features. For a probable diagnosis of TSC, one major feature or two or more minor features must be present.
Genetic diagnostic criteria: | |
The identification of either a TSC1 or TSC2 pathogenic mutation in DNA from normal tissue is sufficient to make a definite diagnosis of tuberous sclerosis complex (TSC). A pathogenic mutation is defined as a mutation that clearly inactivates the function of the TSC1 or TSC2 proteins (e.g., out-of-frame indel or nonsense mutation), prevents protein synthesis (e.g., large genomic deletion), or is a missense mutation whose effect on protein function has been established by functional assessment (www.lovd.nl/TSC1, www.lovd/TSC2, and Hoogeveen-Westerveld et al. 2012, 2013). Other TSC1 or TSC2 variants whose effect on function is less certain do not meet these criteria and are not sufficient to make a definite diagnosis of TSC. Note that 10–25 % of TSC patients have no mutation identified by conventional genetic testing, and a normal result does not exclude TSC or have any effect on the use of clinical diagnostic criteria to diagnose TSC | |
Clinical diagnostic criteria: | |
Major features | Minor features |
1. Hypomelanotic macules (≥3, at least 5 mm diameter) | 1. “Confetti” skin lesions |
2. Angiofibroma (≥3) or fibrous cephalic plaque | 2. Dental enamel pits (≥3) |
3. Ungual fibromas (≥2) | 3. Intraoral fibromas (≥2) |
4. Shagreen patch | 4. Retinal achromic patch |
5. Multiple retinal hamartomas | 5. Multiple renal cysts |
6. Cortical dysplasiasa | 6. Nonrenal hamartomas |
7. Subependymal nodules | |
8. Subependymal giant cell astrocytoma | |
9. Cardiac rhabdomyoma | |
10. Lymphangioleiomyomatosis (LAM)b | |
11. Angiomyolipomas (≥2)b | |
Epilepsy is the most common neurological symptom associated with TSC, present in 60–90 % of cases, and often beginning in the first year of life (Jozwiak et al. 2000; Thiele 2004). In one analysis of 105 patients diagnosed with TSC, 47 % had abnormal cognitive function that was associated with refractory seizures and mutations in the TSC2 gene (Winterkorn et al. 2007). Patients with tuberous sclerosis complex face a high risk of neuropsychiatric impairments: for example, the prevalence of autism spectrum disorders in TSC has recently been estimated to be as high as 25–50 % (de Vries et al. 2015).
Hypomelanotic lesions, ash-leaf macule depigmented nevi resembling vitiligo, may be noted at birth and can be seen in more than half of TSC patients before 2 years of age. These are best visualized with ultraviolet light (Wood lamp). Ash-leaf spots are seen in up to 90 % of patients with TSC. Facial angiofibromas (adenoma sebaceum) skin lesions consist of vascular and connective tissue elements. The red papular rash typically extends over the nose and down the nasolabial folds toward the chin, cheeks, and malar regions. Skin lesions gradually enlarge, manifesting ultimately in 90 or more percent of TSC patients (Northrup and Krueger 2013).
12.4.4 Natural History and Prognosis
The leading cause of morbidity and mortality in TSC patients is caused by neurologic manifestation of the disease followed by renal complications (Franz 2004). Refractory epilepsy is common and leads to poor cognitive outcome (Winterkorn et al. 2007). SEGAs can cause hydrocephalus and require surgical intervention (Cuccia et al. 2003). Additional abnormalities occur in the eyes, skin, kidneys, bones, heart, and lungs. Prognosis varies with the individual manifestations of the disease. Major causes of death in a large TSC Scottish cohort were renal disease, followed by brain tumors, pulmonary lymphangiomyomatosis, status epilepticus, and bronchopneumonia (Shepherd and Stephenson 1992). In severe cases, death occurs in the second decade of life (Curatolo 1996; Webb et al. 1996; Sparagana and Roach 2000).
12.4.5 Laboratory Studies
Molecular genetic testing has become available in clinical practice and may be helpful in young patients who are less than 2 years of age, since many of the clinical signs are not present until later in life. Recently updated consensus diagnostic criteria for TSC now include the identification of a pathogenic TSC1 or TSC2 mutation as sufficient for the formal diagnosis of tuberous sclerosis, independent of clinical findings (Table 12.3, Northrup and Krueger 2013). Various molecular assays reveal the presence of a mutation in 75–90 % of cases (Northrup and Krueger 2013). According to recently updated TSC management guidelines, genetic testing is indicated for genetic counseling purposes or when the diagnosis of TS is suspected but cannot be clinically confirmed (Krueger and Northrup 2013).
12.4.6 Imaging Studies
In addition to the recent adoption of genetic testing to formally establish a diagnosis of TSC, clinical criteria are commonly used as detailed in Table 12.3.
Approximately 95 % of patients with clinical features of TSC have abnormalities on CT scans (Menkes and Maria 2000). Typically, there are hypodense subependymal nodules lining the ventricles (Fig. 12.5a), usually calcified after the first year of life, and 50 % of affected individuals demonstrate calcified cortical hamartomas. SEGAs located at or near the foramen of Monro enhance brightly following contrast administration. Calcified subependymal and cortical nodules are seen in 95 % of individuals with TSC, leaving CT as a simpler diagnostic tool than MRI by obviating the need for general anesthesia in children (Braffman et al. 1990; Menor et al. 1992; Mukonoweshuro et al. 1999; Fischbein et al. 2000).
Fig. 12.5
Tuberous sclerosis complex. (a) Axial CT image of multiple calcified subependymal nodules. Other calcifications are also seen within the cortex. (b) Bilateral cortical tubers of varying sizes and a frontal subependymal giant cell astrocytoma (SEGA) are seen on this T2-weighted image. (c) A postcontrast T1-weighted coronal image from the same patient demonstrates the proximity of the tumor to the foramen of Monro
Brain MRI is preferable for defining the exact number and location of cerebral cortical and subcortical tubers, white matter lesions, and areas of heterotopias (Braffman et al. 1990; Menor et al. 1992; Mukonoweshuro et al. 2001; Fischbein et al. 2000). Tubers or sclerotic white patches involving the gyri or white matter occur mostly in the cerebrum, while cerebellar, brainstem, and spinal cord lesions occur less commonly. Cortical tubers and hamartomas change in appearance as the brain myelinates. They are initially hyperintense on T1-weighted images and hypointense on T2-weighted images, but as brain myelination progresses, this imaging pattern reverses. White matter lesions appear as hyperintense linear bands in cerebrum and cerebellum. In infants, bands are hypointense to unmyelinated white matter on T2-weighted images and are hyperintense to white matter in older children and adults (Fig. 12.5b). SEGAs at or near foramen of Monro display intense postcontrast enhancement, although the pattern can be heterogeneous (Fig. 12.5c). MR spectroscopy can be useful to distinguish them from cortical tubers.
Refinement of MRI techniques and interpretation to identify the location of epileptogenic lesions in TS patients remains an area of active research (Jahodova et al. 2014; Gallagher et al. 2009, 2010; Peters et al. 2013). PET/MRI fusion imaging has been studied to identify epileptogenic tubers with great promise for improving surgical cure rates for intractable epilepsy (Chandra et al. 2006).
12.4.7 Treatment
TSC affects multiple organs, and treatment recommendations vary according to each specific organ manifestation. Recently developed consensus surveillance and management guidelines for TSC patients provide detailed recommendations for diagnosis, surveillance, and treatment of organ site-specific manifestations of TSC (Krueger and Northrup 2013). For diagnosis of CNS abnormalities, all TSC patients are recommended to have an initial MRI of the brain with and without gadolinium contrast to identify tubers, subependymal nodules, and subependymal giant cell astrocytomas. CT or cranial ultrasound are second-line diagnostic modalities. All pediatric patients are recommended to undergo a baseline EEG even in the absence of seizures. A baseline neuropsychiatric assessment and referral for specialized management is also strongly recommended in view of the risk of significant neuropsychiatric manifestations in TSC.
Neurologically asymptomatic patients with TSC should undergo neuroimaging surveillance every 1–3 years until the age of 25 and, if SEGAs are present, continuing into adulthood. Updated treatment recommendations for TSC-associated SEGA have recently been published (Roth et al. 2013). Surgical resection is recommended for acutely symptomatic SEGAs, while growing or asymptomatic SEGAs can be managed by surgical resection or medical therapy with mTOR inhibitors. The efficacy of mTOR inhibition with everolimus in shrinking or stabilizing TS-associated SEGAs has been demonstrated in a randomized phase III trial (Franz et al. 2013) and has revolutionized the management paradigm for such patients. Early results (e.g., Krueger et al. 2010) suggest that mTOR inhibition may reduce seizure frequency in some TS patients; however, the efficacy of this approach awaits larger-scale prospective verification. Everolimus has also been shown to be efficacious in reducing the volume of renal angiomyolipomas in TS patients (Bissler et al. 2013).
Treatment and surveillance recommendations for extracranial manifestations of TS have also been updated at the 2012 International Tuberous Sclerosis Consensus Conference (Krueger and Northrup 2013). An organ site-specific summary of recommendations for newly diagnosed and established tuberous sclerosis patients is provided in Table 12.4.
Table 12.4
Surveillance and management recommendations for newly diagnosed or suspected tuberous sclerosis complex (TSC)
Organ system or specialty area | Recommendation |
|---|---|
Genetics | Obtain three-generation family history to assess for additional family members at risk of TSC |
Offer genetic testing for family counseling or when TSC diagnosis is in question but cannot be clinically confirmed | |
Offer genetic testing and family counseling, if not done previously, in individuals of reproductive age or newly considering having children | |
Brain | Perform magnetic resonance imaging (MRI) of the brain to assess for the presence of tubers, subependymal nodules (SEN), migrational defects, and subependymal giant cell astrocytoma (SEGA) |
Evaluate for TSC-associated neuropsychiatric disorder (TAND) | |
During infancy, educate parents to recognize infantile spasms, even if none have occurred at the time of first diagnosis | |
Obtain baseline routine electroencephalogram (EEG). If abnormal, especially if features of TAND are also present, follow up with a 24-h video EEG to assess for subclinical seizure activity | |
Obtain magnetic resonance imaging (MRI) of the brain every 1–3 years in asymptomatic TSC patients younger than age 25 years to monitor for new occurrence of subependymal giant cell astrocytoma (SEGA). Patients with large or growing SEGA, or with SEGA causing ventricular enlargement but yet are still asymptomatic, should undergo MRI scans more frequently, and the patients and their families should be educated regarding the potential of new symptoms. Patients with asymptomatic SEGA in childhood should continue to be imaged periodically as adults to ensure there is no growth | |
Surgical resection should be performed for acutely symptomatic SEGA. Cerebral spinal fluid diversion (shunt) may also be necessary. Either surgical resection or medical treatment with mammalian target of rapamycin complex (mTOR) inhibitors may be used for growing but otherwise asymptomatic SEGA. In determining the best treatment option, discussion of the complication risks, adverse effects, cost, length of treatment, and potential impact on TSC-associated comorbidities should be included in the decision-making process | |
Perform screening for TSC-associated neuropsychiatric disorders (TAND) features at least annually at each clinical visit. Perform comprehensive formal evaluation for TAND at key developmental time points: infancy (0–3 years), preschool (3–6 years), pre-middle school (6–9 years), adolescence (12–16 years), early adulthood (18–25 years), and as needed thereafter. Management strategies should be based on the TAND profile of each patient and should be based on evidence-based good practice guidelines/practice parameters for individual disorders (e.g., autism spectrum disorder, attention deficit hyperactivity disorder, anxiety disorder). Always consider the need for an individual educational program (IEP). Sudden change in behavior should prompt medical/clinical evaluation to look at potential medical causes (e.g., SEGA, seizures, renal disease) | |
Obtain routine electroencephalograph (EEG) in individuals with known or suspected seizure activity. The frequency of routine EEG should be determined by clinical need rather than a specific defined interval. Prolonged video EEG, 24 h or longer, is appropriate when seizure occurrence is unclear or when unexplained sleep, behavioral changes, or other alteration in cognitive or neurological function is present | |
Vigabatrin is the recommended first-line therapy for infantile spasms. Adrenocorticotropin hormone (ACTH) can be used if treatment with vigabatrin is unsuccessful. Anticonvulsant therapy of other seizure types in TSC should generally follow that of other epilepsies. Epilepsy surgery should be considered for medically refractory TSC patients, but special consideration should be given to children at younger ages experiencing neurological regression and is best if performed at epilepsy centers with experience and expertise in TSC | |
Kidney | Obtain MRI of the abdomen to assess for the presence of angiomyolipoma and renal cysts |
Screen for hypertension by obtaining an accurate blood pressure | |
Evaluate renal function by determination of glomerular filtration rate (GFR) | |
Obtain MRI of the abdomen to assess for the progression of angiomyolipoma and renal cystic disease every 1–3 years throughout the lifetime of the patient | |
Assess renal function (including determination of glomerular filtration rate (GFR)) and blood pressure at least annually | |
Embolization followed by corticosteroids is first-line therapy for angiomyolipoma presenting with acute hemorrhage. Nephrectomy is to be avoided. For asymptomatic, growing angiomyolipoma measuring larger than 3 cm in diameter, treatment with an mTOR inhibitor is the recommended first-line therapy. Selective embolization or kidney-sparing resection is acceptable second-line therapy for asymptomatic angiomyolipoma | |
Lung | Perform baseline pulmonary function testing (pulmonary function testing and 6-min walk test) and high-resolution chest computed tomography (HRCT), even if asymptomatic, in patients at risk of developing lymphangioleiomyomatosis (LAM), typically females 18 years or older. Adult males, if symptomatic, should also undergo testing |
Provide counsel on smoking risks and estrogen use in adolescent and adult females | |
Perform clinical screening for lymphangioleiomyomatosis (LAM) symptoms, including exertional dyspnea and shortness of breath, at each clinic visit. Counseling regarding smoking risk and estrogen use should be reviewed at each clinic visit for individuals at risk of LAM | |
Obtain high-resolution computed tomography (HRCT) every 5–10 year in asymptomatic individuals at risk of LAM if there is no evidence of lung cysts on their baseline HRCT. Individuals with lung cysts detected on HRCT should have annual pulmonary function testing (pulmonary function testing and 6-min walk) and HRCT interval reduced to every 2–3 years | |
mTOR inhibitors may be used to treat LAM patients with moderate to severe lung disease or rapid progression. TSC patients with LAM are candidates for lung transplantation, but TSC comorbidities may impact transplant suitability | |
Skin | Perform a detailed clinical dermatologic inspection/exam |
Perform a detailed clinical dermatologic inspection/exam annually | |
Rapidly changing, disfiguring, or symptomatic TSC-associated skin lesions should be treated as appropriate for the lesion and clinical context, using approaches such as surgical excision, laser(s), or possibly topical mTOR inhibitor | |
Teeth | Perform a detailed clinical dental inspection/exam |
Perform a detailed clinical dental inspection/exam at minimum every 6 months and panoramic radiographs by age 7 years, if not performed previously | |
Symptomatic or deforming dental lesions, oral fibromas, and bony jaw lesions should be treated with surgical excision or curettage when present | |
Heart | Consider fetal echocardiography to detect individuals with high risk of heart failure after delivery when rhabdomyomas are identified via prenatal ultrasound |
Obtain an echocardiogram in pediatric patients, especially if younger than 3 years of age | |
Obtain an electrocardiogram (ECG) in all ages to assess for underlying conduction defects | |
Obtain an echocardiogram every 1–3 years in asymptomatic pediatric patients until regression of cardiac rhabdomyomas is documented. More frequent or advanced diagnostic assessment may be required for symptomatic patients | |
Obtain electrocardiogram (ECG) every 3–5 years in asymptomatic patients of all ages to monitor for conduction defects. More frequent or advanced diagnostic assessment such as ambulatory and event monitoring may be required for symptomatic patients | |
Eye | Perform a complete ophthalmologic evaluation, including dilated funduscopy, to assess for retinal lesions and visual field deficits |
Perform annual ophthalmologic evaluation in patients with previously identified ophthalmologic lesions or vision symptoms at the baseline evaluation. More frequent assessment, including those treated with vigabatrin, is of limited benefit and not recommended unless new clinical concerns arise |
12.5 Ataxia Telangiectasia
12.5.1 Epidemiology
Ataxia telangiectasia (AT) is an autosomal recessive disorder with an incidence of 1:40,000 to 1:80,000 and equal predilection in both sexes. Patients with AT may present during infancy with ataxia without any cutaneous manifestations, which may become apparent after 2 years of age (Gosink et al. 1999; Lavin 1999).
12.5.2 Molecular Biology and Genetics
The gene for AT has been mapped to the long arm of chromosome 11 (11q23.3). The ataxia telangiectasia mutated (ATM) gene is very large with 66 exons spanning 150 kb of the genome, which renders mutation analysis challenging (Bakkenist and Kastan 2003). The ATM gene product is a member of the phosphatidylinositol 3-kinase (PI3-kinase) family and is activated by autophosphorylation in response to DNA double-strand breaks, as well as by direct ATM protein oxidation (Guo et al. 2010) and by membrane receptors such as PDGFRβ (Kim et al. 2010). It contains a PI3-kinase domain, a putative leucine zipper, and a proline-rich region. The ATM protein detects DNA double-strand breaks and activates a number of substrates including p53, chk-2, nibrin, BRCA1, and TSC2, the latter serving to downregulate mTOR signaling (Ambrose and Gattia 2013; Kastan and Lim 2000; Shiloh 2003). ATM plays an important role in cellular responses to DNA damage, cell cycle control, and maintenance of telomere length and has recently been shown to be important for mitochondrial homeostasis (Ambrose et al. 2007; Eaton and Lin 2007). Additional roles of ATM outside of DNA repair, such as in regulation of synaptic vesicle trafficking and in epigenetics, are emerging and may be critical to fully understanding the neurodegenerative phenotype of its deficiency in humans (Herrup 2014).
Over 400 different mutations have been identified in AT patients. Database screening has revealed that most mutations are unique to a given family. Mutations are distributed anywhere in the gene, and no hotspots or high-frequency mutations have been reported (Concannon and Gatti 1997; Mitui et al. 2003). Approximately 90 % of mutations are of the frameshift or premature truncation type, making the majority null mutations. Missense mutations occur in 10 % of the known mutations among AT families (Chun and Gatti 2004; Nakamura et al. 2014). Increased variant protein expression and residual kinase activity have been shown to correlate with a milder phenotype and increased life expectancy in AT patients (Staples and McDermott 2008; Micol et al. 2011; Verhagen et al. 2011).
12.5.3 Diagnostic Criteria and Clinical Features
AT is the most common ataxia in infancy (Kamiya et al. 2001), although the initial manifestations of cerebellar ataxia may not be noted until early walking. AT is a common cause of progressive ataxia in children younger than 10 years of age, second only to tumors of the posterior fossa. Ataxia is generally the presenting symptom of AT. Oculomotor apraxia is a distinguishing feature of the disease, which is often present prior to the cutaneous findings.
Telangiectasias are a second major clinical manifestation of the disease (Table 12.5). Progressive oculocutaneous telangiectasias represent a key feature of AT. Bulbar conjunctivae telangiectasias first appear between 2 and 8 years of age and subsequently involve the ears, eyelids, malar prominences, neck, antecubital and popliteal fossae, as well as dorsum of hands and palate. Initially they appear as bright-red, thick, symmetrical streaks that resemble atypical conjunctivitis and only later become frank telangiectasias. These skin lesions become more prominent with sunlight exposure and age. Premature aging of hair and skin is frequent.
Table 12.5


Clinical features for ataxia telangiectasia (Menkes and Maria 2000)
Related posts:

Stay updated, free articles. Join our Telegram channel
Full access? Get Clinical Tree
