Fig. 6.1
Lower esophageal changes seen in Barrett’s esophagitis (BE). Irregular cephalad protrusions of Barrett’s esophagitis gastro-esophageal junction (a). Normal lower esophageal squamous epithelium compared to Barrett’s esophagitis (compare panel b to c) (From Ref. [48])
The definition of BE shows some variation, with goblet cells in the metaplastic epithelium required for a diagnosis of BE in the United States but not in the United Kingdom [48–50]. The risk of EAC with BE is relatively low, conferring a risk of about 0.5 % per year, such that most individuals with BE will die with BE and not from EAC. Where EAC does arise in a background of BE, a specific sequence of histologic changes from normal squamous epithelium to BE and from BE to low-grade or high-grade dysplasia and finally invasive EAC has been identified [48]. Not surprisingly, the risk for EAC increases with the dysplastic changes, such that individuals with high-grade dysplasia have an EAC risk of ~ 10 %/year [51]. The risk for BE and EAC is increased by obesity, which increases gastro-esophageal reflux via increasing intra-abdominal pressure, thus weight loss decreases both intra-abdominal pressure and the risk for BE and EAC [52]. Interestingly, specific molecular changes have been identified in the progression from normal lower esophageal epithelium to BE to EAC (discussed below).
6.4 Genetic Risk Factors for Esophageal Cancer and Molecular-Genetic Testing
Although environmental factors are major determinants of esophageal cancer risk, about 30 % of esophageal cancers have a heritable genetic component [53, 54]. Additionally, several genetic factors have been identified as risk factors for esophageal cancer, including enzymes involved in the detoxification of xenobiotics and Tylosis, a rare autosomal dominant characterized by hyperkeratosis of the palms and soles associated with a high incidence of esophageal cancer [55, 56] (also discussed below).
Both ESCC and EAC have defined histologic precursor lesions [3, 4, 48–51]. Recent studies have demonstrated that these precursor lesions are accompanied by specific molecular changes. Although many of these changes are currently studied at the basic research level, they are likely to be incorporated into molecular diagnostic testing in the near future. Others, such as molecular testing for Tylosis , are currently being performed [55]. Here, we will review our understanding of the molecular pathology of esophageal cancer and current molecular diagnostics in this area.
6.4.1 Microarray Studies
Microarray allows the massive, parallel, semiquantitative analysis of the relative gene expression levels between two different cell populations, often comparing different, but related, cell populations such as primary and neoplastic cells or primary and metaplastic cell populations. Anywhere from ten to several hundred thousand expressed RNA species can be simultaneously analyzed, allowing detailed comparisons of global gene expression between two samples. The drawbacks to microarray are its relatively high costs, its high complexity of implementation and validation, its “snapshot” presentation of the transcriptome , the lack of information given on an expressed sequence’s ultimate function, and the sometimes poor correlation between mRNA expression and protein expression, which microarray does not measure [57].
One of the earliest microarray analyses of BE and esophageal cancer was performed by Selaru et al. [58]. Thirteen esophageal specimens were compared, consisting of seven BEs, and six esophageal cancers. Eight thousand cDNA clones were analyzed, and hierarchal clusters analysis was performed. The esophageal samples clustered into two predominant groups, each expressing unique gene expression profiles. Comparison to histology revealed that one group consisted of all seven BE samples, whereas the other six were all malignancies. Interestingly, the malignant samples showed sub-clusters consisting of EAC, ESCC, and one signet ring cell esophageal adenocarcinoma. Although the specimen sample size was small, microarray combined with bioinformatics was demonstrated to be able to differentiate malignant and premalignant esophageal disease using small biopsy-sized tissue samples.
Later, Greenawalt et al. [59] employed microarray to examine 128 tissue samples from normal esophageal epithelium, BE, EAC, and ESCC, taken from patients between ages 28 and 86, with a mean age of 63 years. The tumor stage and degree of dysplasia in BE were recorded and incorporated into the analysis. Tissue samples were collected during diagnostic endoscopy and immediately placed in RNAlater solution and stored at −20 °C. Biopsies were divided in half; with one part subjected to independent histologic analysis and the other prepared for RNA extraction. All tumor samples contained 75 % or more tumor. Additionally, biopsies of normal mucosa were taken from greater than 5 cm proximal to any tumor margins and were conformed 100 % normal by histologic examination.
RNA was extracted from each sample via phenol-chloroform followed by column chromatography. Four micrograms of total RNA were amplified with T7 RNA polymerase to linearly amplify the total RNA. The resulting RNA amplicon was annealed to the total RNA, and dsDNA was made in the presence of dNTPs, DNA polymerase, E. coli ligase, and RNase H. Transcribed RNA form the dsDNA was purified and labeled with cyanine-5. Reference cDNA was extracted from nucleic acids from a pool of 11 cell lines (MCF7, Hs578T, OVCAR3, HepG2, NTERA2, MOLT4, RPMI-8226, NB41ATRA, UACC-62, SW872, and Colo205) and labeled with cyanine-3. The sample and reference cDNAs were competitively hybridized to cDNA printed microarray slides containing 10,500 elements, representing 9,400 unique cDNA clones. The hybridized slides were scanned with a confocal laser scanner, and the data were processed using GenePix Pro Software 4.1 to calculate the mean intensity of each spot. Hierarchal clustering was done with a Pearson’s similarity metric using a Gene Cluster 3.0 and viewed with an R statistical package.
After normalization, 9,386 genes separated the tissue samples into four distinct clusters, ESCC, normal squamous epithelium, BE, and EAC. To qualify as distinct, a fourfold difference in gene expression was required. Consistent with their phenotype, ESCC and normal squamous epithelium clustered closely together and were distinct from EAC and BE, which are columnar lesions. Additionally, the normal and BE samples were clearly distinct, whereas the BE and EAC sample clustered closely together (Fig. 6.2). A large group of cDNA clones were differentially expressed between any two tissues: 2,158 between normal and BE, 2,913 between normal and EAC, and 1,306 between EAC and SCC. Thus a large degree of overlap was identified. Several patterns of differential gene expression were identified that correlated with the differentiation state of the esophageal biopsy. For example, genes involved in tissue development, including keratinization, intercellular junction formation, calcium ion binding, and endopeptidase activity, were overexpressed in BE and EAC. EAC overexpressed genes involved in immune and inflammatory responses and those associated with responses to external signaling and collagen metabolism and proteolysis. Interestingly, BE, but not EAC, overexpressed genes involved in digestion and alcohol metabolism. ESCC overexpressed genes involved in cell death and apoptosis, regulation of NF-κB expression metalloprotease activity, and plasminogen activator activity. Last, specific gene expression cluster groups were found to be associated the different malignancies. Malignancy was associated with the expression of genes involved in extracellular matrix formation, collagen binding, immune response, the cell progression and checkpoints, spindle organization, and signal transduction cascades. Thus Greenawalt et al. [59] were able to differentiate EAC and ESCC via molecular profiling and demonstrate both a different cellular origin for each malignancy (squamous vs. columnar), but also show clear molecular differences between benign, premalignant, and malignant esophageal tissues.
Fig. 6.2
A diagram of differentially expressed genes from the microarray study by Greenawalt et al. [59]. The differentially expressed genes between esophageal SCC, AC, and BE are presented as a Venn diagram. The number of genes expressed in more than one tissue appears in the overlapping regions of the diagram
In a similar study, Helm et al. [60] employed the Human Hu U133A GeneChip to perform a microarray analysis of ten endoscopic biopsy specimens from nine patients with esophageal adenocarcinoma. Six patients had adenocarcinoma without BE, while three had adenocarcinoma arising in BE. Ten biopsies were taken three patients in which BE cancer had arisen and a further ten biopsies were taken from six additional patients with BE, but with no dysplasia or malignancy. Each biopsy specimen was carefully examined and microdissected by a pathologist to remove stroma, necrotic debris, and normal adjacent tissue in cases of BE or malignancy. Total RNA was prepared by Trizol extraction and analyzed for integrity. Five micrograms RNA were hybridized to the Hu U133A GeneChip, which contained 22,214 probe sets. The RNA was prepared by standard Affymetrix protocols [61].
Analysis of gene expression patterns revealed that even in BE without histologic signs of dysplasia genes associated with cell differentiation were under-expressed. Adenocarcinoma overexpressed genes associated with tissue remodeling and invasion. Interestingly, cancers that arose without an identifiable BE precursor lesion showed higher expression of these genes.
Many other microarray studies have been preformed comparing various common esophageal lesions and a number of candidate genes have been identified which may have value in esophageal cancer staging, recurrence prediction, prognosis, and eventually in the selection of different treatment modalities [62]. Although microarray is presently too costly, time-consuming, and technically difficult for most clinical applications, it has been a very valuable tool for identifying specific genes that may be examined by simpler molecular techniques for esophageal cancer molecular diagnostics.
6.4.2 Prognostic Significance of Serum mRNAs
One goal of molecular diagnostics is to predict treatment response and establish a prognosis, optimize the management of a patient with a specific malignancy, and accomplish this with the least invasive procedure possible. For esophageal cancer, the measurement of serum RNA profiles is relatively non-invasive. Although not currently used in esophageal cancer molecular diagnostics, some success has been achieved with serum analysis. For example, Takahashi et al. [63] measured the serum levels of MMP9, CRP, HMGB1, MUC1 , EGR1, PBEF1, PDGFA, TGF-β1, TNF-α, Von Willebrand factor, and IL-6 mRNA in 27 patients who underwent radical surgery for esophageal cancer. mRNA was obtained for 14 days post-operatively (POD), with collections taken during surgery and at PODs 1, 3, 5, and 14. mRNA was extracted, and real-time RT-PCR was performed following DNase treatment. RNA from 200 μL of serum was dissolved in 200 μL of H2O. RT-PCR was performed with 1 μg of the extract and 2 μg SYBT Green I employing a one-step RT-PCR kit. RT-PCR conditions were incubation at 50 °C for 30 min, 12 min at 95 °C, and 50 cycles at 95 °C (0 s), annealing at 50–55 °C (10 s), and 72 °C (15 s), followed by extension at 40 °C (20 s). All primers were optimally designed and shown in Table 6.1. The final concentration of the primers was 1 μmol. β-actin was employed as a relative expression-level control. All reactions were done twice, and IL-6 and CRP protein levels were verified by Western blotting.
Gene | GenBank accession no. | Forward primer | Reverse primer |
|---|---|---|---|
VWF | NM_000552.2 | TGA CCA GGT TCT CCG AGG AG | CAC ACG TCG TAG CGG CAG TT |
TGFβ1 | MN_000660.3 | GAC TAC TAC GCC AAG GAG GT | GGA GCT CTG ATG TGT TGA AG |
PDGFA | MN_002607.5 | GGG AGT GAG GAT TCT TTG GA | AAA TGA CCG TCC TGG TCT TT |
NAMPT | MN_005746.2 | CTG TTC CTG AGG GCA TTG TC | GGC CAC TGT GAT TGG ATA CC |
CRP | MN_000567.2 | ACA GTG GGT GGG TCT GAA AT | TAC CCA GAA CTC CAC GAT CC |
EGR1 | MN_001964.2 | TTC TTC GTC CTT TTG GTT TA | CTT AAG GCT AGA GGT GAG CA |
HMBG1 | MN_002128.4 | AAC CAC CCA GAT GCT TCA GT | TCC GCT TTT GCC ATA TCT TC |
TNF-α | MN_000594.2 | TGC TTG TTC CTC AGC CTC TT | GCA CTC ACC TCT TCC CTC TG |
MUC1 | MN_001018016.1 | CCA TTC CAC TCC ACT CAG GT | CCT CTG AAG GAG GCT GTG AT |
MMP9 | NM_004994.2 | TTG ACA GCG ACA AGA AGT GG | CCC TCA GTC AAG CGC TAC AT |
IL-6 | MN_000600.3 | ATG CAA TAA CCA CCC CTG AC | TAA AGC TGC GCA CAA TGA GA |
β-actin | MN_031144.2 | ACC TGA CTG ACT ACC TCA TG | GCA GCC GTG GCC ATC TCT TG |
mRNA expression profiles over 14 days revealed that MMP9 and NAMPT were both up-regulated at POD 5 and onward. Von Willebrand factor and TGFβ1were both up-regulated from POD 3. MUC1 and PDGFA were up-regulated at POD 3, with levels falling at later dates. IL-6 was up regulated at POD 5 and thereafter fell to basal levels. EGR1 and HMGB1 slowly decreased from intraoperative levels to baseline at POD 14. Increased TNF-α mRNA levels correlated with increased time spent under anesthesia. CRP mRNA expression correlated with the length of the ICU stay and was associated with the 6-month mortality. Interestingly, high IL-6 mRNA levels on POD 0 was an independent indicator of a poor prognosis, as were days spent on a ventilator or days spent in the ICU, whereas a high POD three levels predicted the onset of pneumonia. Up-regulation of Von Willebrand factor and TGFβ1 mRNA intraoperatively correlated with mortality (P = 0.0021). A worse prognosis was also found with POD 1 up-regulation of PDGFA, ERG1, and HMGB1 mRNAs. At POD 3, NAMPT and MUC1 mRNAs were independent prognostic factors for 1-year mortality. High NAMPT mRNA at POD 14 correlated with mortality at 30 days and 1 year. The authors proposed that profiling serum inflammatory gene expression could have value in stratifying patients according to their relative risk for mortality and the onset of severe inflammatory conditions. Although not presently commonly employed in molecular diagnostics, such serum mRNA profiling could have value in patient care, but requires further validation.
6.4.3 MicroRNA Expression Analysis
MicroRNAs (miRNAs) are endogenous, single-stranded, 20–23 base-pair non-coding RNA species that regulate protein expression at the posttranscriptional level by forming base-pair-specific interaction between the 5′portion of the miRNA and sites within the coding and un-translated regions of mRNAs. Typically, these interactions lower mRNA stability, attenuating mRNA translation and, hence, protein synthesis. miRNAs play an important role in multiple cellular pathways, including embryogenesis, apoptosis, cellular differentiation and proliferation, hematopoiesis, immune function and regulation, and carcinogenesis [64, 65] miRNAs are dysregulated in variety human malignancies, including colorectal, thyroid, breast, prostate, lung, and pancreatic malignancies, and in fact are dysregulated in every tumor type so far examined [66–72], miRNAs regulate ~ 30 % of global protein translation, with some miRNAs functioning as tumor suppressors and other as oncogenes. In human malignancies, the former are suppressed and the latter are overexpressed [64, 73–75]. Interestingly, profiling of miRNA expression patterns provides more accurate tissue and tumor classification than does global mRNA expression profiling [76, 77].
In esophageal cancer miRNA expression is dysregulated in BE, EAC, and ESCC [78–87]. In many cases, the down-stream target gene products of specific miRNAs have been identified. For example, miR-93, miR-25, and miR-106b are coordinately expressed from a polycistron at 7q22.1. During the transition from the normal squamous epithelium to BE to EAC, their expression is increased seven- to ninefold [88–90]. miR-93 and miR-25 down-regulate the cyclin-dependent kinase inhibitor 1 (p21), a potent inhibitor of CDK2 and −4, which together move cells though the G1 and S phases of the cell cycle, promoting cell division. Additionally, Bcl-2-like protein 11 (Bim) levels are also suppressed, inhibiting apoptosis [89–91]. Thus activation of the 7q22.1 polycistron promotes malignant transformation. Many other miRNA s dysregulated in esophageal cancer suppress tumor suppressor genes and cause over-expression of oncogenes [reviewed in 92]. Interestingly, many miRNA species are expressed from polycistrons, possibly forming a basic regulatory network coordinating mRNA translation patters [78–90, 92].
6.4.4 Molecular Analysis of miRNA Expression
miRNA expression has been analyzed with multiple molecular techniques, with RT-PCR and microarray analyses being commonly employed, with Northern blotting sometimes used to confirm PCR results. For example, Chen et al. [79] employed qRT-PCR to analyze miRNA expression in 107 ESCC cases using normal adjacent esophageal squamous epithelium as control tissue. All tissue samples were snap frozen in liquid nitrogen, and total miRNA was isolated from the frozen tissue using a mirVana miRNA isolation kit. The first strand of cDNA was synthesized with a RevertAid first strand cDNA synthesis kit and later amplified with mirVana qRT-PCR primers sets in a TaqMan gene expression master mix. An Applied Biosystems 7,300 Real-Time PCR system was used for amplification, following the manufacturer’s instructions. miR-92a was significantly up-regulated in the ESCC compared to the control normal epithelium. Interestingly, the relative expression of mi-92a was significantly increased in lymph node metastases compared to patients without node metastases (p = 0.001). miR-92a expression also correlated with the patients TNM stage (p = 0.049), but not with age, gender, differentiation grade, tumor position type, and T classification. Additionally, 65 patients were followed for 5 years. Those with higher mi-92a expression had a shorter survival and higher TNM and N stages than those with low expression.
Last, the CDH1 mRNA (E-cadherin ) 3′ un-translated region contains a highly conserved binding region from 499 to 524 for mi-92a. Chen et al. [79] found a strong inverse correlation between E-cadherin expression of mi-92a levels. Further proof for a role in mi-92a-regulating E-cadherin expression was shown in a cell line where removal of the mi-92a binding domain in the CDH1 mRNA abrogated the inhibitory effects of mi-92a on E-cadherin expression. The authors concluded that mi-92a overexpression likely promotes metastasis and a poorer clinical course, in part, via down regulating E-cadherin. The advantages of employing qRT-PCR in miRNA analysis is that the technique is cost effective, lends itself to high-throughput analyses, and readily detects low abundance nucleic acid species [93]. While mi-RNA analyses have been often performed on esophageal cancer tissue samples, qRT-PCR has also been successfully employed in the analysis of circulating serum miRNAs, a technique that is relatively uninvasive and that will eventually have clinical applications (for review, see [94]).
6.4.5 Acetylaldehyde Dehydrogenase*2
Ethanol is metabolized by a two-step process, being first converted into acetylaldehyde by alcohol dehydrogenase, and subsequently acetylaldehyde is metabolized to acetate by acetylaldehyde dehydrogenase (ALDH2 ), which is attached to acetyl coenzyme A and enters the citric acid cycle [95]. Acetylaldehyde is a mutagen and potent carcinogen and, like most carcinogens, a longer exposure at higher concentrations results in increased cellular damage [15–18]. ALDH2 is found at 12q24, is 53 kbp, and consists of 13 exons and 12 intones, which encode a 501 amino acid residue protein [96, 97]. ALDH2 has multiple polymorphisms, one of which profoundly affects the enzymes catalytic efficiency [98, 99]. In the ALDH2 *2 polymorphism, a lysine at residue 487 replaces a glutamic acid residue found in the more common ALDH2 *1 allele. ALDH2 *2 has little ability to metabolize ethanol and has a very low affinity for NAD, a cofactor required for enzymatic function and the metabolism of ethanol [99]. Following alcohol consumption, individuals with ALDH2 *2 homozygotes show 18 times higher blood alcohol levels and those with ALDH2 *1/ALDH2 *2 heterozygotes show a five times higher blood alcohol levels than individuals with the wild-type allele [100]. As a result of the very poor enzymatic activity of the ALDH2 *2 polymorphism acetylaldehyde, levels are higher in ALDH2 *2 hetero- and homozygotes than in ALDH2 *1/ALDH2 *1 individuals following alcohol consumption [99–101] (Fig. 6.3). Not surprisingly, ALDH2 *2 homozygotes and ALDH2 *1/ALDH2 *1 individuals exhibit higher levels of acetaldehyde-derived DNA damage following alcohol consumption than ALDH2 *1 homozygotes [102].
Lewis et al. [103] performed a meta-analysis of seven articles that reported on ALDH2 polymorphism and esophageal cancer. Compared to ALDH2 *1 homozygotes, ALDH2 *2 homozygotes had lower rates of esophageal cancer (odds ratio 0.36), while ALDH2 *1/ALDH2 *1 individuals had elevated esophageal cancer rates (odds ratio 3.19). The reason for the lower esophageal cancer rates seen in the ALDH2 *2 homozygotes was attributed to the uncomfortable “alcohol flushing response” seen in ~ 36 % of Asians, where ethanol consumption causes facial flushing, nausea, and tachycardia. These individuals were found to avoid alcohol and therefore have lower esophageal cancer rates than ALDH2 *1 homozygotes. The flushing response was largely absent in ALDH2 *1/ALDH2 *1 individuals who did tend to consume alcohol and show increased esophageal cancer and acetaldehyde-derived DNA damage [101–103]. Interestingly, individuals who show the alcohol flushing response and still consume alcohol show elevated esophageal cancer rates, whereas those who drink everyday, are heavy drinkers, or are alcoholics show an odds ratios of 12.1, 16.4, and 13.5, respectively, compared to control ALDH2 *1 homozygotes [102, 104–106].
6.4.6 ALDH2*2 Polymorphism Testing
Many different techniques have been employed in ALDH2 polymorphism testing, including microarray , mass spectrometry, melting curve analysis , sequencing, and conventional fluorescent-based PCR analysis [107, 108]. Itoga et al. [108] compared melting curve analysis , SNaPsnot analysis, denaturing high-performance liquid chromatography (DHPLC), and PCR-SSCP analysis.
Whole blood from 24 healthy men and 74 men with esophageal cancer was collected, and genomic DNA was isolated. The men also answered detailed questionnaires about their alcohol consumption. The portion of the ALDH2 gene surrounding the *2 polymorphism was amplified with the Cy-5 labeled primers Cy5-CAAATTACAGGGTCAACTGCT (forward) and Cy5-CCACACTCACAG TTTTCACTT (reverse) in a 25 μL volume with 100 ng genomic DNA, 0.2 M each primer, 0.2 mM of each dNTP, and 1 U Taq polymerase in 10 mM Tris–HCl buffer. The reaction mix was denatured for 3 min at 94 °C and amplified by 30 cycles with annealing at 58 °C for 30 s, extension at 72 °C for 30 s, and denaturation at 94 °C for 30 s. The resulting amplicons were analyzed as described below.
First, amplicons were subjected to Fluorescent-Based PCR-SSCP Analysis. One μL of amplicon was diluted in 10 μL of loading buffer solution that contained 99.5 % formamide and 0.5 % blue dextran. The samples were denatured at 94 °C for 3 min; 2 μL of the diluted mix was run into a 10 % native polyacrylamide gel (99:1, acrylamide:bisactymlamide ratio) in 0.5X Tris-borate buffer. Electrophoresis was carried out at 20 W at 18 °C, with data analyzed via Fragment Manager (Amersham Pharmacia Biotech).
Second, samples were subjected to melting curve analysis . One hundred to 500 ng of genomic DNA was mixed in a 20 μL volume with 11.4 μL distilled H2O, 1.6 μL 25 mM MgCl2, 1 μM of each primer, 1 μL of anchor probe, and 2 μL LightCycler DNA-Master Hybridization Probes. The PCR was carried out with an initial denaturation of 95 °C for 10 min, followed by 40 cycles of 95 °C for 15 s, annealing at 55 °C for 15 s, and extension at 72 °C for 11 s. Following amplification, melting curve analysis was performed with denaturation at 95 °C for 0 s, annealing at 40 °C for 120 s, and analysis carried out with a 0.2 °C/s increase to 80 °C. Emitted fluorescence was measured during the heat ramping step, and the melting curve was plotted as melting peaks.
Third, amplicons were subjected to SNaPshot Analysis. Four μL of amplicon that had been subjected to a 7 min extension at 72 °C at the end of the last cycle was used. The amplicon was incubated at 37 °C for 1 h with 2 U exonuclease I and 2 U shrimp alkaline phosphatase. The mix was heated to denature the enzyme, and 1 μL of digested PCR product was mixed with 5 μL of SNaPshot Multiplex Ready Reaction Mix with 1 μM minisequencing primer (5′-CCACACTCACAGTTTTCACTT-3′) and amplified via 25 cycles of 96 °C for 10 s, 50 °C for 5 s, and 60° for 10 s. Upon completion, 0.5 U shrimp alkaline phosphatase was added and the reaction was incubated for 1 h. One μL of the resulting reaction mix was added to 12 μL of HiDi formamide and heated to 95 °C for 5 min. The samples were run in an ABU PRISM 310 Genetic Analyzer, and the results were analyzed with GeneScan 3.0 application software.
6.4.7 Denaturing High-Performance Liquid Chromatography
Denaturing high-performance liquid chromatography (DHPLC) was performed with genomic DNA amplified, prepared as for the SNaPshot procedure. Heteroduplex DNA was produced by mixing ALDH2 *1/2*2 by denaturing the PCR products at 94 °C for 3 min and then slowly cooling them. Homoduplex samples were made in the same manner by mixing equal amounts or ALDH2 *1 or ALDH2 *2 and treating them as per the heteroduplex samples. The DHPLC analysis was carried out using WAVE DNA Fragment Analysis System. The PCR mixture was loaded on a DNASep column and the hetero- and homoduplexes where eluted with a linear acetonitrile gradient formed by mixing two different elution buffers at a constant flow rate of 0.9 mL/min. DNA elution was detected by measuring absorbance at 260 nm at 58 °C.
Interestingly, the study revealed all four techniques to have 100 % concordance. Melting curve analysis required 4 h to complete, PCR-SSCP took 6 h, DHPLC required 21 h, and SNaPshot analysis required 23 h. The costs of each reaction were $4.16, $2.50, $2.50, and $8.33, respectively. Melting curve analysis had the advantage of not requiring opening of the reaction tube, thus eliminating the possibility of contamination. The authors concluded that, for routine 10–20 samples/day molecular diagnostics, melting curve analysis was the best option and PCR-SSCP fluorescent-based genotyping was best applied to large-scale genotyping for epidemiological studies. Interestingly, the study showed that the highest esophageal cancer rates were seen in habitual drinkers with ALDH2 *2 homozygosity.
6.5 CDX2 Protein Expression in Barrett’s Esophagitis
The molecular events underlying the transition of normal esophageal epithelium to BE is incompletely understood, but recent studies have demonstrated a role for the Caudal homeobox (Cdx) genes in the morphogenesis of BE. Animal studies have shown that CDX expression plays a role in the morphogenesis of normal intestinal epithelium. For example, in normal murine embryogenesis Cdx1 and −2 expression appears at day 12 and continues throughout life, with Cdx protein expression being required for the transformation of endoderm into large and small intestinal columnar epithelium [109]. Mice genetically engineered to express Cdx1 or −2 in their gastric cells develop metaplastic intestinal-type epithelium with goblet cells, enterocytes, and enteroendocrine cells [110–114]. Additionally, while ablation of global Cdx2 expression is lethal in embryonic mice, causing death before gastrulation [115, 116], conditional ablation of Cdx2 in the developing gut results in partial foregut like differentiation of the large and small intestines, loss of intestinal villi, and significantly lowered expression of the pro-intestinal transcription factors Cdx1, Isx, HNF1α, and ΗΝF4α, which together activate the intestinal transcriptome [117].
Cdx1 and −2 is strongly expressed in normal human large and small intestine, but not in the stomach or esophagus [110, 118]. In BE Cdx2 expression is 400 times higher than normal esophageal epithelium and it is 100 % expressed in BE with dysplasia and in EAC [118–120]. Some experiments done on cultured esophageal cells has demonstrated that bile salts and acidic conditions can increase Cdx2 expression, although by itself increased Cdx2 expression is insufficient to cause all the changes seen in BE [121, 122]. Cdx2 is expressed in BE, BE with dysplasia, and EAC, and is a sensitive marker for intestinal dysplasia. However, it cannot differentiate low-grade from high-grade dysplasia, and the expression differences seen in the BE→dysplasia→EAC are not sufficient for immunohistochemistry to be useful [110, 118–124]. Presently the diagnosis of BE, BE with dysplasia, and EAC presently rests almost solely on the examination of histologic sections combined with clinical findings and patient history. Cdx2 immunohistochemistry may become more important in the future as our understanding of its function and down-steam signaling cascades increases.
6.6 Tylosis
Tylosis is an autosomal dominant syndrome first recognized more than 50 years ago. Its common manifestation is palmoplantar keratoderma, an abnormal thickening and callusing of the palms and soles due to abnormal keratinization. Oral leukoplakia and esophageal hyperkeratosis often accompany the palmoplantar keratoderma. Tylosis has a strong association to ESCC, but not EAC, with the ESCC risk reported as 40–95 % by the age of 70 years [125–130]. Initial linkage studies revealed the heritable Tylosis abnormality to be on chromosome 17, with later studies narrowing the region to a 42.5 kb region at 17q25, designated as the TOC gene. This region has also been implicated in some cases of sporadic ESCC [131–139]. One gene within this region, cytoglobin (CYGB ), has both alleles ~ 70 % down-regulated in Tylosis, while in sporadic esophageal cancer both alleles appear to be suppressed by an epigenetic mechanism. Interestingly, sequencing of the TOC gene in Tylosis and sporadic esophageal cancer failed to show any heritable or somatic mutations, suggesting epigenetic suppression in both disease processes [138, 140]. Tylosis is rare, with only a few known kindreds having the disease. There are few recommendations on how to clinically manage the disease, although at least yearly upper endoscopic screening with intensive biopsies is recommended. Presently, it is not known if upper endoscopic screening will lower the mortality seen in Tylosis [140].
The diagnosis of Tylosis is based on clinical findings, combined with the personal and family history; molecular diagnostic techniques rarely employed [56]. McRonald et al. [140] collected esophageal biopsies during routine upper endoscopy from 18 affected individuals from a Tylosis family, seven biopsies from individuals with gastro-esophageal reflux , and ten individuals without esophageal cancer, gastro-esophageal reflux , or other esophageal pathology. The tissues were collected into RNAlater and stored at −20 °C until the RNA was isolated using RNeasy. Two micrograms of RNA were reverse transcribed with oligo-dT primers. The resulting cDNA was amplified with 0.2 μM of the primers 5′-CTTCGGGGAAGTTGAGTCAG-3′ (forward) and 5′-CAAGGTGGAACCGGTGTACT-3′ (reverse) for 26 cycles with the TBP mRNA employed as a control. Twenty-six cycles were chosen as this was determined to be within the exponential phase of the reaction. The resulting amplicons were identified and quantified by agarose gel electrophoresis with the gels scanned with an ABI GeneScanner. As described above, the CYGB was ~ 70 % down-regulated in patients with Tylosis compared to normal esophageal epithelium, with both alleles being equally repressed. The authors concluded that the CYGB gene was down-regulated by three possible mechanism: (1) there may be an aberrant antisense RNA species produced in Tylosis that impairs the function of the CYGB gene; (2) the transcription of the gene is impaired; or (3) the CYGB gene may be down-regulated due to the aberrant expression of another gene. Further research will be required to find the mechanism of transcriptional repression.
6.7 Gastric Cancer
Gastric cancer is the fourth most common cancer worldwide with 934,000 new cases each year. In addition, due to its aggressive clinical course, it is also the second most common cause of cancer deaths worldwide, causing an estimated 700,000 deaths each year. The incidence of the cancer varies widely between different geographical locations. Two-thirds occur in the developing countries, with China accounting for 42 % of all cases. High-risk areas included East Asia, Eastern Europe, and parts of Central and South America. Low-risk areas include Southern Asia, North and East Africa, North America, New Zealand, and Australia [1].
6.8 Environmental Versus Genetic Factors for Gastric Cancer
Studies of migrant populations have clearly demonstrated strong environmental factors in the risk for gastric cancer . In particular, studies of populations moving from high-risk to low-risk areas for gastric have highlighted many environmental risks factors, with some studies indicating that the risk factors exert effects beginning in childhood [1, 141, 142]. Many risk factors have been identified several are discussed below:
6.8.1 Helicobacter pylori (H. pylori )
H. pylori is listed by the international Agency for Research on Cancer as carcinogenic in humans [143]. More than 50 % of the world’s population is infected with H. pylori , with infection conferring a two to sixfold increased risk for gastric carcinoma [144, 145]. Not surprisingly curing an H. pylori infection significantly reduces the risk for gastric cancer in high-risk population [146, 147]. H. pylori is a Gram-negative bacterium that synthesizes numerous virulence factors, including urease, arginase, adhesin, vacuolating toxin, and cytotoxin-associated antigen [148, 149]. Evidence indicates that causes gastric cancer via a three-step mechanism; (1) H. pylori infection, (2) the development of precancerous including severe gastric atrophy, intestinal metaplasia , and corpus predominant gastritis, and (3) and carcinogenesis [150]. The mechanisms of H. pylori –induced carcinogenesis are incompletely understood, however multiple factors appear to promote cancer including increased oxidative stress, chronic inflammation, and impaired host antioxidant defenses and ability to repair DNA damage [151–155]. Presently once found H. pylori infections are treated with antibiotics to eradicate the infections [146, 147].
6.8.2 Diet
Extensive data have indicated that diet plays a strong role in gastric cancer risk, that is, a diet high in certain foods such as persevered, salted and or smoked foods, especially meats and pickled vegetables with carcinogenic N-nitroso compounds . Animal studies have also demonstrated that ingesting relatively high amount of salt induces gastritis and enhances the potency of carcinogens such as N-methyl-N-nitro-N-nitrosoguanidine and 4-nitroquinoline-1-oxide [156, 157]. Additionally, a diet high in fresh fruits and vegetables exerts a protective effect, lowering the risk for gastric cancer , while the polyphenols found in green tea (Camellia sinensis ) have anti-inflammatory and anti-oxidant effects, and additionally inhibit nitosation – an event implicated in gastric carcinogenesis [158–164].
6.8.3 Tobacco
6.8.4 Obesity
Obesity is a major risk factor for gastric cardia adenocarcinoma as it promotes gastroesophageal reflux, the development of BE and hence increases the risk of adenocarcinoma of the gastroesophageal junction [48]. One Swedish study revealed that the heaviest quartile of the population had a 2.3fold increased risk for gastric cardia adenocarcinoma compared to the light quartile of the population [167]. Thus weight loss, which reduces reflux, also lowers the risk for gastric cardia adenocarcinoma.
6.9 Genetic Risk Factors for Gastric Carcinoma and Molecular-Genetic Testing
About 90 % of gastric malignancies are sporadic, with the remaining 10 % showing a familial clustering, and 1–3 % representing hereditary gastric cancer syndromes [168]. Molecular diagnostic testing is generally not often performed on gastric malignancies, except for hereditary diffuse gastric carcinoma and mucosa-associated lymphoid tissue lymphomas.
6.9.1 Hereditary Diffuse Gastric Carcinoma
Hereditary diffuse gastric carcinoma is an autosomal dominant cancer susceptibility syndrome characterized by an estimated cancer risk of 67 % for men and 83 % for women [169]. Histologically, it is characterized by the development of an aggressive diffusely infiltrating signet ring cell gastric carcinoma that results in linitis plastica once the majority of the stomach is involved (Fig. 6.4). The syndrome was first described in three New Zealand Maori families in 1964, with genetic linkage studies employing microsatellite markers showing that the E-cadherin gene (CDH1) at 16q22.1 was involved [171, 172]. Since these early studies, the syndrome has been identified in multiple kindreds in many countries and, interestingly, in the family of Napoleon Bonaparte [56, 173–176] (Fig. 6.5).
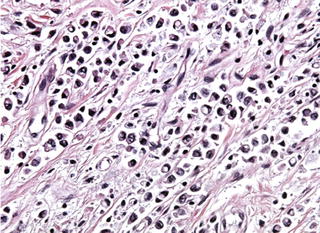
Fig. 6.5
The family pedigree of the Bonaparte family showing a pattern of heredity gastric cancer (From Ref. [56])
Hereditary diffuse gastric carcinoma is defined as follows by the International Gastric Cancer Linkage Consortium [177]:
1.
Two or more documented cases of diffuse gastric cancer in first/s degree relatives, with at least one diagnosed before age 50 years; OR
2.
Three of more cases of documented diffuse gastric cancer in first/s degree relatives, independently of age of onset.
More recent criteria (also by the International Gastric Cancer Linkage Consortium) are:
1.
An individual diagnosed with diffuse gastric cancer before 35 years of age.
2.
An individual diagnosed with both diffuse gastric cancer and lobular breast cancer.
3.
One family member with diffuse gastric cancer and another with either lobular breast cancer or signet ring colon cancer.
Individuals who meet or exceed these criteria should receive genetic counseling, be tested for germline E-cadherin gene mutations, undergo upper screening endoscopic exams every 6 months with extensive biopsies taken, and undergo prophylatic gastrectomy. The timing of the prophylatic gastrectomy is based on multiple factors, such as patient age, ability to tolerate the operation, and the decision to have children [56, 177].
Related posts:
 Molecular Pathology and Diagnostics of Breast Cancer
Molecular Pathology and Diagnostics of Thyroid and Parathyroid Malignancies
Molecular Pathology and Diagnostics of Prostate Cancer
Molecular Pathology and Diagnostics of Non-small Cell Lung Carcinoma
Molecular Diagnostics of Lymphoid Neoplasms
Molecular Pathology and Diagnostics of Childhood Tumors
Molecular Pathology and Diagnostics of Breast Cancer
Molecular Pathology and Diagnostics of Thyroid and Parathyroid Malignancies
Molecular Pathology and Diagnostics of Prostate Cancer
Molecular Pathology and Diagnostics of Non-small Cell Lung Carcinoma
Molecular Diagnostics of Lymphoid Neoplasms
Molecular Pathology and Diagnostics of Childhood Tumors
Stay updated, free articles. Join our Telegram channel

Full access? Get Clinical Tree


