Fig. 10.1
Low-grade urothelial neoplasm with papillary architecture. Urine cytology specimen stained with Papanicolaou staining (original magnification 400×)
Once the initial evaluation and detection with cytology is performed using voided urine specimens, the patients undergo cystoscopy with a confirmatory biopsy [32]. However, cystoscopy is invasive and expensive. Therefore, there is a need to the develop markers capable of identifying urothelial carcinoma by a more economical and/or less invasive methodology [8, 28, 31, 32].
10.2 UroVysion™ Fluorescent In Situ Hybridization (FISH) Test for Urothelial Carcinoma
The FISH technique allows for the visualization of a specific nucleic acid sequence area within a cell by the precise annealing of a fluorescent labeled single strand of DNA fragment, called a probe, to its complementary DNA target sequence on the chromosomes. The hybridization of the probes is visible in a fluorescent microscope as fluorescent dots. Each dot represents a copy of the targeted sequence.
Currently, FISH analysis of urothelial cells from urine has emerged as powerful ancillary technique addressing the limitations of cytopathology [33]. The commercially available UroVysion™ FISH multiprobe (Abbot, DesPlaines, IL) is a molecular test with proven clinical value [22, 33, 34, 38, 39] and it has become a well known and established test to further characterize urine cytology specimens [20, 22, 34, 38–41]. UroVysion™ is Food and Drug Administration (FDA)-approved for the detection of urothelial carcinoma in voided urine specimens from patients with gross or microscopic hematuria and no previous history of urothelial carcinoma and for the detection of recurrent urothelial carcinoma in voided urine specimens from patients with a prior history of urothelial carcinoma [39, 42].
UroVysion™ bladder cancer FISH kit is applicable to routine cytologic urine specimens fixed on slides. This kit consists of a four color, four probe mixture of DNA sequences to determined regions on chromosomes 3, 7, 9, and 17 [22, 39] including three Chromosome Enumeration Probes (CEP), CEP 3 SpectrumRed, CEP 7 SpectrumGreen, and CEP 17 SpectrumAqua, and a Locus Specific Identifier (LSI) 9p21 SpectrumGold (Fig. 10.2) [43]. Therefore, this test is capable of detecting increased copy numbers (polysomy) of the chromosomes 3, 7 and 17 and deletion of 9p21 (Figs. 10.3 and 10.4) [33, 39].
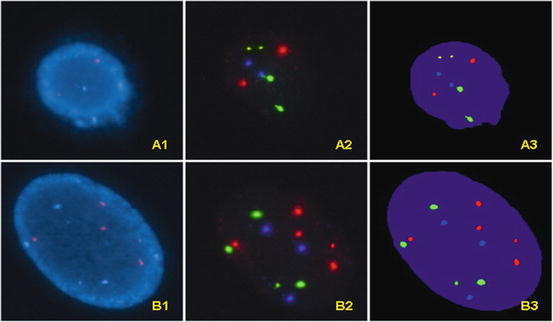
Fig. 10.2
The specific markers used on the UroVysion™ kit are shown in this graph. Note that chromosome enumeration probes (CEP) are used for chromosomes 3 (Spectrum Red), 7 (Spectrum Green) and 17 (Spectrum Aqua); a locus specific identifier is used in chromosome 9p21 (Spectrum Gold)
Fig. 10.3
(a) Diagram of a chromosomally normal cell nucleus with presence of all the tested probes; two of each CEP 3 red, CEP 7 green, CEP 17 aqua, and LIS 9p21 gold respectively. (b) Diagram of a chromosomally abnormal cell with additional signals for CEP 3, four signals, and CEP17, three signals. (c) Diagram of a chromosomally abnormal cell with homozygous loss of LSI 9p21 gold signals
Fig. 10.4
A1. An UroVysion negative (“normal”) cell observed with DAPI filter. A2. The same UroVysion negative cell observed with filters for gold, green, red, and aqua respectively; the actual photographs from different filters are overlapped using software. The results show normal 9p21 locus (two gold signals) and normal number of chromosomes 3 (two red signals), 7 (two green signals) and 17 (two aqua signals). A3. The overlapping images of the same UroVysion negative cell with computer generated pseudo-color. B1. An UroVysion abnormal cell observed with DAPI filter. B2. The same UroVysion abnormal cell observed with filters for gold, red, green, and aqua respectively; the actual photographs from different filters are overlapped using software; gains in chromosome 3 (five red signals), 7 (four green signals) and 17 (three aqua signals) are noted. Note that the signal for 9p21 (gold) is not present due to homozygous loss of 9p21. B3. The overlapping images of the same UroVysion abnormal cell with computer generated pseudo-color
The criteria for a FISH positive result as suggested by the manufacturer of UroVysion™ are as follows: abnormal cells show a gain of multiple chromosomes (three or more signals of CEP 3, CEP 7, or CEP 17) or a homozygous loss of 9p21. This assay requires that a minimum of 25 morphologically abnormal cells are to be analyzed [44]. Specifically, “analysis should continue until either ≥4 cells with gains of multiple chromosomes or ≥12 cells with homozygous loss of 9p21 are detected or the entire sample is analyzed. The total number of chromosomally abnormal cells, i.e. cells with gain of multiple chromosomes or homozygous loss of 9p21, are determined; results are reported as positive or negative” [44]. As such, a positive result is reported when either four or more cells with multiple chromosomal gains or 12 or more cells with loss of both signals for 9p21 are observed. When there is less than four cells with chromosome gain or less than 12 cells with 9q21 loss, a negative result is reported with a comment, indicating how many cells with chromosome gain or how many cells with 9q21 loss. The study may be aided using either FDA cleared systems BioView Duet™ System for Automated FISH scanning of UroVysion™ (Rehovot, Israel) or the oncoFISH® bladder for automated UroVysion™ by Ikoniscope® Digital Microscopy System (Ikonisys, New Haven, Connecticut) [45–47]. When an automated system is used, the assay requires the screening of more cells before a negative result can be issued [48, 49]. In the case of BioView Duet™ System, at least 100 cells are needed to be screened for a negative case [48, 49]. These systems enhance the practice; however, they do not replace the microscopic evaluation by cytology professionals.
UroVysion™ may detect more abnormalities than cytology [20, 50]. Multiple studies have shown that UroVysion™ FISH in voided urine and washing specimens can help in patient management due to its superior sensitivity over cytology in different situations [50]. It can be particularly useful to clarify equivocal cytological findings [33]. UroVysion™ can aid in the clinical follow-up after BCG treatment to identify patients with therapy failure. In this clinical circumstance, UroVysion™ is also better than cytology [20, 41]. UroVysion™ FISH is more sensitive than cytology in diagnosing high-grade tumors than low-grade tumors and flat intraepithelial lesions [51], yet as with any test, clinical correlation is always recommended. Additionally, UroVysion™ may clarify cases with reactive epithelial atypia [35]. In these specimens, the overall sensitivity of cytology improves when coupled with UroVysion™ [52]. In patients followed with UroVysion™ for urothelial carcinoma, 27 % of patients without clinical evidence of tumor will demonstrate a positive UroVysion™ FISH result [53]. Interestingly, about 63 % of these patients will develop a clinically and pathologically recognizable recurrent tumor within 2 years [20, 53]. Although UroVysion™ FISH has a higher sensitivity than cytology, the specificity is reported as similar or higher for cytology [50, 51].
Further molecular applications, such as coupling UroVysion™ FISH and FGFR3 mutational status are in investigation [54]. Although the following tests are not clinically used at this time, they represent a glimpse of future possibilities. Among these are the testing of epigenetic alterations in bladder carcinogenesis involving promoter hypermethylation and aberrant expression of microRNA [14]. Notably, aberrant expression of specific microRNAs is associated with the FGFR3 mutant bladder carcinogenesis pathway [14].
10.3 Other Assays for Urothelial Carcinoma
DNA ploidy has been used as an ancillary study in urine cytology [27, 31, 55–59]. Initially, DNA ploidy was determined using flow cytometry [60–63]. Later, DNA ploidy was performed using image analysis automated systems on Feulgen stained cytology preparations [55, 57, 58]. Of these methods, DNA ploidy by image analysis was found superior to DNA ploidy by flow cytometry [57]. This method also has some value in the follow-up detection of recurrent disease in patients with urinary diversion [55]. UroVysion™ is more specific than DNA ploidy image cytometry for the detection of aneuploid neoplastic cells, identifying twice as many abnormalities, and as a result has become a more popular ancillary test in the detection of urothelial carcinoma [52].
Other tests described in the literature are Bladder Tumor Antigen (BTA stat®, and BTA TRAK®), nuclear matrix protein 22 (NMP22® BladderCheck®), urinary fibrinogen degradation products (FDP), ImmunoCyt™/uCyt+™, Quanticyt, Hb-dipstick, LewisX, Telomerase, Microsatellite LOH, cytokeratin 19 fragment enzyme link immunoabsorbent assay (CYFRA21-1 ELISA), urinary bladder cancer enzyme link immunoabsorbent assay (UBC ELISA), rt-PCR to determine the expression of cytokeratin 20, hyaluronic acid and hyaluronidase (HA-HAase), urine tissue polypeptide specific antigens (TPS), cDNA microarray and detection of certain microRNAs [13, 43, 64–70].
In addition to UroVysion™ FISH multiprobe (Abbot, DesPlaines, IL), BTA stat® and BTA-TRAK® (polyMedco, Radmond, WA), NMP22® BladderCheck® (Inverness Medical Innovation, Bedford, UK) and ImmunoCyt™/uCyt+™ (Scimedx, Denville, New Jersey) also have FDA approval for bladder cancer surveillance [68, 69, 71, 72].
ImmunoCyt™/uCyt+™ is an immunofluorescent test that uses three monoclonal antibodies labeled with fluorescent markers; two antibodies, M344 and LDQ10, react with a mucin glycoprotein and a third antibody, 19A211, reacts with a glycosylated form of carcinoembryonic antigen [73]. BTA stat® is an immunoassay using two different monoclonal antibodies to human complement factor H related protein (hCFHrp) [25, 72, 74–76]. NMP22® BladderCheck® is based on a lateral flow immunochromatographic method detecting a nuclear matrix protein 22 utilizing two different monoclonal antibodies, one as a capture antibody and one as a reporter antibody [71, 72, 77]. Although numerous other molecular studies have been published and are available, their use is still limited to research studies as their clinical relevance has not been established [13].
Recent advances in the knowledge of the molecular pathways and the pathogenesis of bladder cancer could make targeted therapy in urothelial carcinoma possible and the beginning of personalized or individualized therapy directed towards a specific molecular profile of the tumor [78]. The future in bladder carcinoma may involve the use of molecular studies to determine the diagnosis, individual therapy and prognosis [79, 80]. However, in bladder carcinoma, the era of personalized medicine is yet to begin.
10.4 The Molecular Diagnosis of Kidney Tumors
Currently, the molecular diagnosis of kidney tumors is still evolving. Studies mainly involve the molecular characterization of renal carcinomas to identify Xp11.2 translocations/TFE fusions. These carcinomas typically affect children and young adults and show papillary architecture with clear cells and nested patterns, but may also have cells with granular eosinophilic cytoplasm. Renal carcinomas with the ASPL-TFE3 fusion contain cells with abundant clear to eosinophilic cytoplasm, discrete cell borders, prominent vesicular chromatin, and nucleoli. Psammoma bodies and hyaline nodules are usually present. Renal carcinomas with the PRCC-TFE3 fusion reveal a more nested architecture with cells with a moderate amount of cytoplasm, hyaline nodules and fewer psammoma bodies. Using immunohistochemistry, these tumors have expression of the TFE3 protein, renal cell carcinoma marker antigen and CD10 and they may be cytokeratin and epithelial membrane antigen positive [76, 81]. The diagnosis of these tumors can be established based on morphology with confirmation by immunohistochemistry for TFE3. Tumors with the Xp11.2 translocation, all involving the TFE3 gene [82, 83], include:
(a)
t(X;1)(p11.2;q21) with the fusion of PRCC and TFE3 genes
(b)
t(X;17)(p11.2;p25) with the fusion of ASPL (RCC17) and TFE3 genes
(c)
t(X;1)(p11.2;p34) with the fusion of PSF and TFE3 genes
(d)
inv(X)(p11;q12) with the fusion of NonO (p54 nrb ) and TFE3 genes
These fusion proteins act as aberrant transcription factors. FISH and other molecular methods may be applied to confirm the specific molecular change in these tumors, although these tests are not widely available [82].
Molecular studies have shown some utility in pediatric tumors such as the cellular variant of congenital mesoblastic nephroma (but not the classic variant); this tumor shows the same t(12;15)(p13;q25) and ETV6-NTRK3 genes fusion as infantile fibrosarcoma [84]. Rhabdoid tumor of the kidney shows a deletion of the hSNF5/INI1 gene [84]. As with molecular diagnostics for renal cell carcinoma, these tests are not in routine clinical use.
References
1.
3.
4.
Czerniak B, Chaturvedi V et al (1999) Superimposed histologic and genetic mapping of chromosome 9 in progression of human urinary bladder neoplasia: implications for a genetic model of multistep urothelial carcinogenesis and early detection of urinary bladder cancer. Oncogene 18(5):1185–1196PubMedCrossRef
5.
Heney NM (1992) Natural history of superficial bladder cancer. Prognostic features and long-term disease course. Urol Clin North Am 19(3):429–433PubMed
6.
Related posts:
 Molecular Pathology and Diagnostics of Breast Cancer
Molecular Pathology and Diagnostics of Thyroid and Parathyroid Malignancies
Molecular Pathology and Diagnostics of Prostate Cancer
Molecular Pathology and Diagnostics of Non-small Cell Lung Carcinoma
Molecular Diagnostics of Lymphoid Neoplasms
Molecular Pathology and Diagnostics of Childhood Tumors
Molecular Pathology and Diagnostics of Breast Cancer
Molecular Pathology and Diagnostics of Thyroid and Parathyroid Malignancies
Molecular Pathology and Diagnostics of Prostate Cancer
Molecular Pathology and Diagnostics of Non-small Cell Lung Carcinoma
Molecular Diagnostics of Lymphoid Neoplasms
Molecular Pathology and Diagnostics of Childhood Tumors
Stay updated, free articles. Join our Telegram channel

Full access? Get Clinical Tree


