Molecular Biology of Bladder Cancer


Molecular Biology of Bladder Cancer


Margaret A. Knowles

Carolyn D. Hurst


INTRODUCTION

There has been rapid progress in elucidating the molecular changes that underlie bladder cancer development. A wealth of data is now available that identifies several critical drivers of the malignant urothelial phenotype, some of which have clear potential for therapeutic targeting. Most studies have focused on urothelial carcinomas (UC), which comprise the majority (>90%) of tumors diagnosed in the Western world. This chapter will provide an overview of somatic molecular features of UC identified by genomic, epigenomic, and expression profiling. There is also much information about germline variants that confer increased risk of UC development and the reader is referred to recent reviews on this topic.1,2

At diagnosis, approximately 60% of UCs are noninvasive (stage Ta) papillary lesions. These commonly recur, but progression to muscle invasion is infrequent (10% to 15%) and prognosis is good. In contrast, tumors that are muscle invasive at diagnosis (≥T2) have poor prognosis (<50% survival at 5 years). Stage T1 tumors, which have penetrated the epithelial basement membrane but not invaded muscle, represent a clinically challenging and molecularly heterogeneous group with features related to each of the two major groups. The distinction of the two major groups is supported by a wealth of molecular information, and a “two-pathway” model for UC pathogenesis has long dominated thinking about this cancer type and its clinical management. Many genomic alterations and expression of specific genes relate directly to these groups and will be discussed in this context here. Global expression and epigenetic alterations show less direct relationships and will be discussed together. Importantly, recent molecular information provides strong evidence for multiple molecular subgroups that are independent of tumor grade and stage. This new molecular classification, which shows great promise of clinical relevance, is described in a separate section.


KEY MOLECULAR ALTERATIONS IN STAGE Ta UROTHELIAL CARCINOMA

Low-grade stage Ta papillary UC (“superficial” UC) are genomically stable, often with near-diploid karyotype. Common features are activation of FGFR1, FGFR3, PIK3CA, and CCND1 genes by mutation or upregulated expression and mutational inactivation of CDKN2A, STAG2, and TSC1. The most common event recorded to date is mutation of the promoter region of telomerase reverse transcriptase (TERT).


FGF Receptors

Activating point mutations in FGF receptor 3 (FGFR3) are present in ≥ 70% of cases.3 These are in hot-spot codons in exons 7, 10, and 15 (Fig. 38.1A) and are all predicted to constitutively activate the receptor.4 Mutations are also found in urothelial papilloma, a likely precursor of superficial UC.5 Increased expression of mutant FGFR3 is common in these tumors.6 MicroRNAs (miRNAs) miR-99a/100, which are commonly downregulated in non-muscle-invasive (NMI) tumors, are negative regulators of FGFR3 expression.7 Transcriptional regulation by the p53 family member p63 has also been demonstrated.8 In cultured normal human urothelial cells (NHUC), expression of mutant FGFR3 leads to activation of the RAS-MAPK pathway and PLCγ, leading to overgrowth of cells at confluence,9 and suggesting a possible contribution of FGFR3 activation to urothelial hyperplasia in vivo. An alternative mechanism of FGFR3 activation in a subset of cases (2% to 5%) is chromosomal translocation to generate a fusion protein. All FGFR3 fusions identified to date show loss of the final exon of FGFR3 and fusion in-frame to TACC3 (transforming acid coiled-coil containing protein 3), or in one case to BAIAP2L1 (BAI1-associated protein 2-like 1) also known as IRTKS (insulin receptor tyrosine-kinase substrate).10 It is not yet clear whether this activation mechanism is related to tumor grade or stage. These fusion proteins are highly activated and transforming oncogenes. FGF1 and FGF2 are expressed in UC tissues and cell lines,11,12 FGF2 is detected in the urine of patients with bladder cancer,13 and expression has been detected in the urothelial stroma.14 Thus, it is also likely that both autocrine and paracrine FGF production contributes to FGFR3 activation in UC, particularly in those tumors with expression of wild-type protein (Fig. 38.1B).

Activation of the RAS-MAPK pathway in Ta tumors may also be achieved by mutation of one of the RAS genes (most commonly HRAS or KRAS2), and this is mutually exclusive with FGFR3 mutation.15 More than 80% of noninvasive bladder tumors are predicted to have RAS-MAPK pathway activation via these mechanisms (Fig. 38.2A). Compatible with this, urothelial expression of an activated Ras transgene in mice leads to hyperplasia and papillary tumors,16 suggesting an important role for activation of the RAS-MAPK pathway in the generation of urothelial hyperplasia.

In NMI UC, FGFR3 mutation is associated with favorable outcome.17,18,19 High FGFR3 expression, normal staining pattern for CK20, and low proliferative index in papillary urothelial neoplasms of low malignant potential20 is reported to identify tumors that do not recur.21

FGFR3 is considered a good therapeutic target in superficial UC, though early clinical application is most likely in muscle invasive rather than superficial UC (see the following). Several studies indicate that inhibition of mutant FGFR3 by knockdown or inhibition using small molecules or antibodies has a profound effect on UC cell phenotype, including inhibition of xenograft growth in vivo.22

Upregulated expression of the related receptor FGFR1 is also found in Ta tumors.23 No mutations have been detected, and there is infrequent gene amplification.24 Ectopic expression of FGFR1 in NHUC in the presence of FGF2 ligand, activates the RAS-MAPK pathway and PLCγ, and promotes cell survival.23 Currently, there is no information on the prognostic significance of these alterations.


PIK3CA

The phosphatidylinositol-3 kinase (PI3K) pathway plays a pivotal role in signaling from receptor tyrosine kinases (Fig. 38.2A). Activating mutations of the p110α catalytic subunit (PIK3CA) are found in UC, most commonly in low-grade, stage Ta tumors (˜25%).25,26,27,28
The mutation spectrum (Fig. 38.2B) differs significantly from that found in other cancers. Mutations E542K and E545K in the helical domain are most common (22% and 60%, respectively) and the kinase domain mutation H1047R, which is the most common mutation in other cancers, is less frequent. The selective pressure for helical domain mutation in UC is not fully understood. E542K and E545K forms require interaction with RAS-GTP but not binding to p85, the regulatory subunit of PI3K, whereas H1047R depends on p85 binding and is active in the absence of RAS binding.29 This suggests potential cooperation between helical domain PIK3CA mutant proteins and events in UC that activate RAS. Compatible with this, PIK3CA and FGFR3 mutations are commonly found together.25,26,27,28 Mutant PIK3CA confers a proliferative advantage at confluence and stimulates intraepithelial movement in NHUC, with higher activity of helical domain than kinase domain mutants in this cell context.30 Several other mechanisms of PI3K pathway activation have been identified in UC, though none of these are common in noninvasive tumors (Table 38.1).


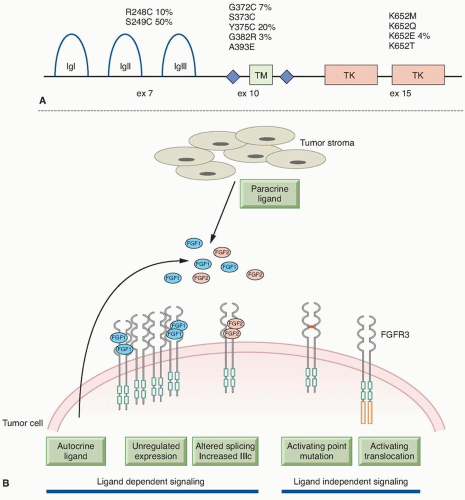
Figure 38.1 (A) FGFR3 mutations identified in bladder cancer. Positions of hot-spot mutations in exons 7, 10, and 15 that are found in bladder cancer are shown in relation to protein structure. The relative frequency of the more common mutations is given as a percentage. IgI, IgII, IgIII, immunoglobulinlike domains; TM, transmembrane domain; TK, tyrosine-kinase domain. (B) Mechanisms of FGFR3 activation in bladder cancer. FGFR3 can be activated by ligand-dependent and -independent mechanisms. Ligand-dependent activation may be via increased expression of wild-type FGFR3, increased production of FGFs by tumor or stromal cells, with or without upregulated FGFR3 expression, or through expression of splice variants with the ability to bind a wider range of FGF ligands. Ligand independent activation can be achieved by point mutation that facilitates receptor dimerization or by the generation of fusion proteins that constitutively dimerise.


STAG2

Inactivating mutations in the cohesin complex component STAG2 (Xq25) have been identified in UC.31,32,33,34 Mutations are most common in stage Ta tumors (20% to 36%) and are predominantly inactivating, suggesting a tumor suppressor function. The cohesin complex, which in human cells contains SMC1A, SMC3, RAD21, and either STAG2 or STAG1, mediates

cohesion between sister chromatids following DNA replication to ensure correct chromosomal segregation. Mutations in STAG2 in glioblastoma have been reported to cause aneuploidy35 but this relationship is not apparent in UC, where most mutations have been found in low grade/stage, genomically stable tumors, and there is no association of mutation with chromosomal copy number changes.31,34


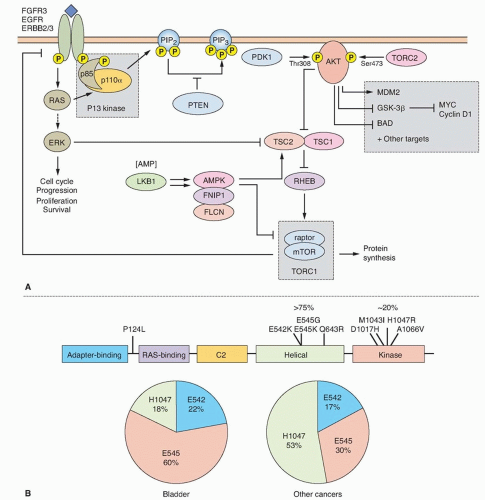
Figure 38.2 (A) Oncogenic signaling via the RAS-MAPK and PI3K pathways. Growth factor-mediated signaling or mutational activation of RAS oncogenes can activate both of these pathways. Signaling via the RAS/RAF/MEK/ERK cascade leads to phosphorylation of many substrates that can have multiple cellular effects depending on the intensity and duration of signaling. In many situations, proliferation is induced. Activated receptor tyrosine kinases bind p85, the regulatory subunit of PI3K, and recruit the enzyme to the membrane where it phosphorylates phosphatidyinositol-4, 5-bisphosphate (PIP2) to generate PIP3, which in turn recruits PDK1 and AKT to the membrane, where AKT is activated by phosphorylation to regulate a wide range of target proteins (not all shown). Among these are cyclin D1 and MDM2, which are upregulated either directly or indirectly, resulting in a positive stimulus via the RB or p53 pathways, respectively. AKT also phosphorylates and inactivates tuberin the TSC2 gene product, leading to activation of mTOR complex 1 (TORC1), which controls protein synthesis. The TSC1 product hamartin forms an active complex with tuberin, and loss of function of either protein leads to dysregulated mTOR signaling. MYC expression is induced as a consequence of both by ERK and AKT signaling. Many genes in these pathways show mutation [FGFR3, PIK3R1 (p85α), PIK3CA (p110α), HRAS, KRAS2, PTEN, AKT1, TSC1, TSC2] or upregulated expression (EGFR, ERRB2, ERRB3, FGFR1) in bladder cancer. (B) PIK3CA mutations identified in bladder cancer in relation to protein structure. Pie charts show proportions of common helical domain (E542, E545) and kinase domain (H1047) mutations in bladder and other cancers. Data from COSMIC (http://cancer.sanger.ac.uk/cancergenome/projects/cosmic/; accessed November 15, 2013).


TABLE 38.1 Genetic Changes Identified in Stage Ta Bladder Tumors


Gene (Cytogenetic Location)


Alteration


Frequency (%)


Oncogenes


HRAS (11p15)/NRAS


(1p13)/KRAS2 (12p12)


Activating mutations 1515,27,28,221


FGFR3 (4p16)


Activating mutations


60-803,222


CCND1 (11q13)


Amplification/overexpression


10-2058,223-225


PIK3CA (3q26)


Activating mutations


27 PUNLMP; 16-30 Ta25,26


MDM2 (12q13)


Overexpression/amplification


˜30 overexpression; amplification infrequent58,85,226


Tumor Suppressor Genes


CDKN2A (9p21)


Homozygous deletion/mutation/methylation


HD 20-3040,41,227,228


LOH ˜60229


PTCH (9q22)


Deletion/mutation


LOH ˜ 60; mutation frequency low43,44


TSC1 (9q34)


Deletion/mutation


LOH ˜ 60; mutation ˜1226,27,48,230


STAG2 (Xq25)


Deletion/mutation


34-3633,34


KDM6A (Xp11)


Mutation


10-3031,32,140


ARID1A


Mutation


1031,32


DNA Copy Number Changesa


8p, 10q, 11p, 11q, 13q, 17p, 18q


Deletion


>1557,135,231,232


9p, 9q


Deletion


46-5357,135,231,232


1q, 20q


Gain


>1557,135,231,232


1q13, 1q21-q24, 3p25 (including RAF1, PPARG), 3q25, 3q26, 4p16 (including FGFR3), 4q21, 5p13.3-p12, 6p22 (including E2F3, SOX4), 8p12, 8q24 (including MYC), 10q26 (including FGFR2), 11q13 (including CCND1), 11q24, 12q15 (including MDM2), 17q12-q21 (including ERBB2), 20q11-q13 (including YWHAB, MYBL2)


Amplification


Occasional57,58,232


a Array-based comparative genomic hybridization analyses.
PUNLMP, papillary urothelial neoplasms of low malignant potential; HD, homozygous deletion; LOH, loss of heterozygosity.


In addition to its well-documented functions during cell division, cohesin regulates gene expression through mechanisms involving DNA looping and interactions with transcriptional regulators such as CTCF, though evidence to date suggests that these roles are mainly related to STAG1-cohesin.36 Functional studies are now required to elucidate the consequences of STAG2 loss of function in UC.


Telomerase Reverse Transcriptase Gene Promoter

The most common genomic alterations identified in UC of all grades and stages are mutations in the promoter of the telomerase reverse transcriptase gene (TERT) in more than 80% of cases.37,38 Mutations are predominantly in two hotspot positions [-124 bp (G>A) and -146 bp (G>A) relative to the ATG translational start site], and this has facilitated the design of robust methods of detection. Examination of TERT expression in UC tissues has not revealed an effect of mutation on expression,37 so that the functional significance of these mutations remains to be determined. Nevertheless, the ease with which these mutations can be detected in urine sediments37,38 is likely to make a major contribution to the development of urine-based assays for detection of bladder tumors of all grades and stages.


Other Genomic Alterations in Noninvasive Urothelial Carcinoma

These tumors are often near diploid. The most common genomic alteration is loss of heterozygosity (LOH) or copy number loss of chromosome 9, often an entire homolog. More than 50% of UC of all of grades and stages show chromosome 9 LOH. A critical region on 9p21 and at least three regions on 9q (9q22, 9q32-q33, and 9q34) have been identified. Candidate genes within these regions are CDKN2A (p16/p14ARF) and CDKN2B (p15) at 9p21,39,40,41,42 PTCH (Gorlin syndrome gene) at 9q22,43,44 DBC1 at 9q32-q33,45,46,47 and TSC1 (tuberous sclerosis syndrome gene 1) at 9q3426,48,49 (Table 38.1).

CDKN2A (9p21) encodes the two cell-cycle regulators, p16 and p14ARF. p16 is a negative regulator of the RB pathway and p14ARF, a negative regulator of the p53 pathway (Fig. 38.3).
Inactivation of this locus in UC is commonly by homozygous deletion (HD). LOH of 9p, HD of CDKN2A, and loss of expression of p16 in NMI UC is predictive of reduced recurrence-free interval.50,51,52 Mouse knockout and in vitro experiments indicate that p16 and/or p14ARF may be haploinsufficient.53,54 In human UC, this may affect the biology of approximately 45% of cases that have LOH or reduced copy number of 9p21.


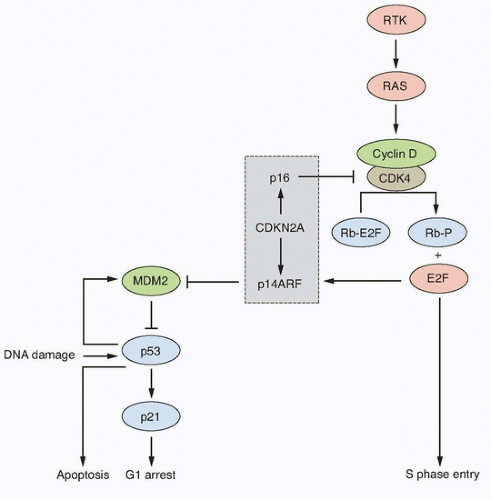
Figure 38.3 Key interactions in the RB and p53 pathways. The CDKN2A locus encodes p16 and p14ARF that act as negative regulators of the RB and p53 pathways, respectively. This interrelated signaling network is central to tumor suppression via the mechanisms of cell-cycle arrest and apoptosis. Stimulation by mitogens induces cyclin D1 expression. Phosphorylation of RB1 by CDK4-cyclin D1 complexes releases E2F family members to induce expression of genes required for progression into S phase. The cyclin D-CDK4 complexes also sequester p27 and p21 (not shown). This allows formation of cyclin E-CDK2, which reinforces the inactivation of RB1. p16 negatively regulates this process by interacting with CDK4. The p53 pathway responds to stress signals (e.g., DNA damage). p21 expression is induced and this leads to cell-cycle arrest. MDM2 is a ubiquitin ligase responsible for inactivation of p53. In turn, p53 regulates MDM2 expression providing a negative feedback loop. The p53 and RB pathways are connected by p14ARF, which sequesters (inactivates) MDM2 in the nucleus and is upregulated by E2Fs and in response to mitogenic signaling. Overexpression of E2Fs and oncogenes such as MYC can both result in p53-triggered cell-cycle arrest via p14ARF. RTK; receptor tyrosine kinase.

On 9q, three genes are implicated. PTCH, the Gorlin syndrome gene (9q22), shows infrequent mutation,44 but many tumors have reduced mRNA expression.43 DBC1 (9q33) shows HD in a few tumors55 and no mutations, but is commonly silenced by hypermethylation.45,56 TSC1 is the best-validated 9q tumor suppressor gene. TSC1 in complex with TSC2 negatively regulates the mTOR branch of the PI3K pathway (Fig. 38.2A).

Biallelic inactivation of TSC1 is found in 12% to 16% of UC with no relationship to grade or stage.26,27


Cyclin D1

CCND1 (11q13) is amplified in some superficial and invasive UC,57,58 and the protein is overexpressed in an even larger number.59,60 Overexpression in many cases may be the consequence of other alterations, such as activation of the MAPK or PI3K pathways (Fig. 38.2A). In Ta tumors, upregulated expression is associated with higher risk of progression to muscle invasion.60


KEY MOLECULAR ALTERATIONS IN INVASIVE UROTHELIAL CARCINOMA

Many genomic alterations are found in muscle-invasive (MI) UC, including alterations to known genes and genomic alterations for which the target genes are currently unknown (Table 38.2).


Oncogenes

Overexpression of EGFR, ERBB2, and/or ERBB3 is associated with higher tumor grade and stage and with clinical outcome.61,62,63 ERBB2 (17q23) is amplified in 10% to 20% and overexpressed in 10% to 50% of MI UC.64,65,66 Amplification is more common in metastatic lesions than in the related primary tumor.67 As this receptor cannot bind ligand and relies on heterodimerization with ERBB3, it is likely that ERBB3 status and/or ligand expression may have significant influence.65,68,69 Up to 70% of MI tumors overexpress EGFR, and this is associated with poor prognosis.61,70,71 Both ERBB2 and EGFR represent potential therapeutic targets in advanced UC.72 These changes may activate the RAS-MAPK and/or PI3K pathways (Fig. 38.2A).

RAS gene mutation is not associated with either invasive or noninvasive disease (mutations in ˜13% overall).15 Although mice expressing mutant H-ras in the urothelium develop superficial papillary tumors rather than MI tumors,73 in vitro experiments in human tumor cells indicate that HRAS can induce an invasive phenotype.74 Thus, RAS mutation may contribute to development of both major forms of UC.

PIK3CA and FGFR3 are mutated less frequently than in NMI UC. Approximately 15% of T2 tumors show FGFR3 mutation.3,6,75 However, protein expression is upregulated in 40% to 50% of nonmutant MI UC.6 Thus FGFR3 is considered a good therapeutic target in invasive and metastatic disease and preclinical studies have shown that gene knockdown76 or treatment with FGFR-selective small molecules and antibodies inhibits cell proliferation and tumorigenicity of UC cell lines with mutant or upregulated FGFR3.77,78,79 Potential predictive biomarkers include mutation, overexpression, or detection of an FGFR3 fusion protein. The presence of FGFR3 fusion proteins in UC cell lines10 is associated with good response to FGFR inhibitors.77 Epithelial phenotype may provide an additional biomarker as in vitro assays indicate that
UC cells with epithelial phenotype have enhanced sensitivity to FGFR inhibition compared to those with mesenchymal phenotype.80 A recent RNAi screen in UC cell lines indicated that upregulated EGFR signaling provides a mechanism of escape from FGFR inhibition and can mediate de novo resistance. A reciprocal relationship was found when EGFR was inhibited and both in vitro and in a preclinical in vivo model, combined inhibition showed improved anti-tumor activity.81 Thus, assessment of both FGFR3 and EGFR status may be required to predict response and combined EGFR and FGFR3 inhibition may be essential. Several clinical trials of FGFR inhibitors are now planned or in progress in advanced UC.


TABLE 38.2 Genetic Changes Identified in Invasive (Stage ≥T2) Bladder Tumors


Gene (Cytogenetic Location)


Alteration


Frequency (%)


Oncogenes


HRAS (11p15)/NRAS (1p13)/KRAS2 (12p12)


Activating mutations


4-1515,27,28,32,221


FGFR3 (4p16)


Activating mutations


0-203,6,28,222,233


ERBB2 (17q)


Amplification/overexpression


10-14 amplification


10-50 overexpression64-66


CCND1 (11q13)


Amplification/overexpression


10-20 amplification223,224,234


MDM2 (12q13)


Amplification/overexpression


4-11 amplification85,235,236


E2F3 (6p22)


Amplification/overexpression


9-11 amplification in ≥T189,91


Tumor Suppressor Genes


CDKN2A (9p21)


Homozygous deletion/mutation/methylation


HD 20-3040-42,228


LOH ˜60229


PTCH (9q22)


Deletion/mutation


LOH ˜60; mutation frequency low43,44


TSC1 (9q34)


Deletion/mutation


LOH ˜60; mutation ˜1226,27,48,230


STAG2 (Xq25)


Deletion/mutation/methylation


9-1331-34


TP53 (17p13)


Deletion/mutation Mutation


50-70237-239


RB1 (13q14)


Deletion/mutation LOH or loss of expression


3796,99


PTEN (10q23)


Deletion/mutation


LOH 30-35106-109; mutation 17111


ARID1A


Mutation


˜1032,240


KDM6A


Mutation


11-1531,32


CREBBP


Mutation


10-1531,32


EP300


Mutation


6-831,32


DNA Copy Number Changesa


2q, 3p, 3q, 4p, 4q, 5q, 6p, 6q, 8p, 9p, 9q, 10p, 10q, 11p, 11q, 12q, 13q, 14q, 15q, 16p, 16q, 17p, 18q, 19p, 19q, 22q


Deletion


>1557,135,231,232


1p, 1q, 2p, 2q, 3p, 3q, 4p, 4q, 5p, 5q, 6p, 7p, 7q, 8p, 8q, 9p, 10p, 10q, 11q, 12p, 12q, 13q, 14q, 15q, 16p, 16q, 17p, 17q, 18p, 19p, 19q, 20p, 20q, 21q, 22q


Gain


>1557,135,231,232


1q23, 3p25 (including RAF1, PPARG), 6p22 (including E2F3, SOX4), 8p12-p11.2 (including FGFR1, TACC1, POLB), 8q24 (including MYC), 8q22 (including YWHAZ), 11q13 (including CCND1), 12q15 (including MDM2), 17q12-q21 (including ERBB2), 20q12-q13.2 (including YWHAB, MYBL2), 20q13.32-q13.33


Amplification


3-12 57,232


a Array-based comparative genomic hybridization analyses.
HD, homozygous deletion; LOH, loss of heterozygosity.


FGFR1 is also overexpressed in many of these cancers.23 An increased ratio of the FGFR1-β : FGFR1-α splice variants is found in MI tumors. The β isoform, lacking the first immunoglobulin-like domain, has increased sensitivity to FGF1.82 FGF2 stimulation of ectopically expressed FGFR1-β in some UC-derived cell lines induces an epithelial-mesenchymal transition (EMT), a major feature of which is PLCγ-mediated upregulation of COX-2.83 This is in contrast to the effect of FGFR1 signaling in NHUC, where increased proliferation and reduced apoptosis but no EMT is induced,23 suggesting that FGFR1 plays different roles in NMI and MI UC. Compatible with this, UC cell lines with highest FGFR1 expression show a mesenchymal (EMT) phenotype (low E-cadherin expression) and upregulated FGF2 expression, and those with epithelial phenotype show higher FGFR3 and E-cadherin and lower FGFR1.84 In an animal model of UC metastasis using an FGFR1-dependent cell line, an FGFR inhibitor reduced the development of circulating tumor cells and metastasis but not primary tumor growth.84 Currently, there is no information on the
prognostic significance of FGFR1 upregulation, and FGFR1 has not yet been examined independently of FGFR3 as a potential therapeutic target.

Several other oncogenes are implicated in MI UC. Four to six percent have amplification of MDM2 (12q14).57,85,86 MDM2 regulates p53 levels, and overexpression provides an alternative mechanism to inactivate p53 function (Fig. 38.3). There is no consensus on the relationship of upregulated MDM2 to tumor grade, stage, or prognosis. MYC is upregulated in many bladder tumors, although the mechanism for this is unclear.87 Although amplifications of 8q are found in invasive UC, MYC is not the major target. However, additional copies of the whole of 8q are common and may lead to overexpression.24,57 MYC is also upregulated in response to other molecular events (e.g., MAPK pathway stimulation). An amplicon on 6p in 14% of MI UC and cell lines contains E2F3, and functional studies indicate that E2F3 can drive urothelial cell proliferation.88,89,90,91,92 E2F transcription factors interact with and are regulated by RB1 (Fig. 38.3) and in accord with this, tumors with E2F3 amplification have RB1 or p16 inactivated.89


Tumor Suppressor Genes

As in other aggressive cancers, the tumor suppressor genes TP53, RB1, CDKN2A, and PTEN are implicated in MI UC. The pathways controlled by TP53 and RB1 regulate cell-cycle progression and responses to stress (Fig. 38.3). TP53 mutation is common in invasive UC and detection of mutation or TP53 protein accumulation is associated with poor prognosis. Although immunohistochemical detection of TP53 protein with increased half-life identifies many mutant TP53 proteins and is commonly used as a surrogate marker for mutation, some TP53 mutations (˜20%) yield unstable or truncated proteins that cannot be detected in this way. Thus, TP53 protein accumulation is not a useful prognostic marker. Two meta-analyses indicate only a small association between TP53 positivity and poor prognosis.93,94 However, examination of both protein expression and mutation of TP53 provides useful prognostic information.95

The RB pathway regulates cell-cycle progression from G1 to S phase (Fig. 38.3). HD, LOH of 13q14, and loss of RB1 protein expression are common in MI UC.96,97,98,99 Loss of p16 expression is inversely related to positive RB1 expression,100 and high-level p16 expression results from negative feedback in tumors with loss of RB1.101 Thus, both loss of expression and high-level expression of p16 are associated with RB pathway deregulation, and these are adverse prognostic biomarkers found in >50% of MI tumors.102 Interestingly, in MI UC with FGFR3 mutation, a high frequency of CDKN2A HD has been reported, which may identify a progression pathway for NMI FGFR3-mutant tumors to muscle invasion via loss of CDKN2A.103 As indicated previously, amplification and overexpression of E2F3, which is normally repressed by RB1, is associated with RB1 or p16 loss in MI tumors.89 p16 and p14ARF proteins link the RB and p53 pathways (Fig. 38.3), and due to multiple regulatory feedback mechanisms, inactivation of both pathways together is predicted to have greater impact than inactivation of either pathway alone. This is borne out by the achievement of greater predictive power in studies using concurrent analyses of multiple changes that deregulate the G1 checkpoint.102,104,105

Only gold members can continue reading. Log In or Register to continue

Stay updated, free articles. Join our Telegram channel

Aug 27, 2016 | Posted by in ONCOLOGY | Comments Off on Molecular Biology of Bladder Cancer

Full access? Get Clinical Tree

Get Clinical Tree app for offline access