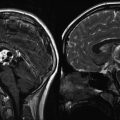
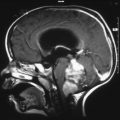
Fig. 13.1
High-grade glioma with both improved spectra and anatomic imaging after receiving radiation therapy. (a1–a3) Pretreatment 3D chemical shift imaging (CSI) transposed on T1-weighted gadolinium-enhanced axial image. Spectrum voxel labeled A is within normal left frontal white matter; choline (*), creatine (^), and NAA (**) peaks are normal for age and location. Spectrum voxel labeled B is within enhancing neoplasm; the spectrum shows elevated choline and lactate/lipid (#), with decreased NAA in the right genu. (b1–b3) Follow-up 3D CSI in the same location as image a. Choline peak (*) has decreased since the prior study, resulting in an improved Z-score, yet still has evidence of residual neoplasm. Spectrum voxel labeled C shows necrosis; all metabolites are decreased
There is no consensus as to how often patients should be evaluated. We believe that the most sensitive method to evaluate treatment efficacy and to screen for early recurrence or residual neoplasm is to perform serial exams, which allows comparison with a known baseline prior to treatment (Lazareff et al. 1999; Nelson et al. 1997a, 1999; Norfray et al. 1999; Vigneron et al. 2001). It is important to remember that, although combining MRS with MR imaging is more sensitive than MR imaging alone, sensitivity is not 100 %. A necrotic neoplasm with a paucity of viable tumor cells can have identical spectra to posttreatment necrosis (Taylor et al. 1996) this can only be differentiated when the Cho increases on subsequent exams. Serial follow-up studies are, therefore, essential to detect early growth of residual neoplasm.
MRS is a promising tool for assessing pediatric patients with brain tumors. In the appropriate setting, spectroscopy can improve the delineation of neoplastic brain involvement, increase specificity of diagnosis, and help discriminate posttreatment injury from residual neoplasm. Research continues to define the role of MRS in grading neoplasms and possibly predicting treatment response (Lazareff et al. 1999; Waldrop et al. 1998; Tzika et al. 2001; Girard et al. 1998; Lin et al. 1999; Negendank et al. 1996).
13.3 MR Perfusion
13.3.1 Principles
Cerebral perfusion is defined as the delivery of nutrients and oxygen, via the blood, to brain tissue per unit volume. This is typically expressed in units of milliliters per 100 g of parenchyma per minute (Cha et al. 2002). With recent advances in fast imaging techniques and computer technology, it is now possible to capture the dynamic changes in cerebral perfusion using MR imaging. Perfusion MR imaging (pMRI) provides information on cerebral hemodynamic parameters that are reflective of tissue perfusion, including relative cerebral blood volume (rCBV), cerebral blood flow (CBF), and mean transit time (MTT).
pMRI has evolved from a research tool into a clinically useful technique due to wider availability of high-performance MR gradients that allow faster imaging sequences (e.g., echo planar imaging (EPI)) and improvement in computer image processing algorithms. Quantitative analysis of perfusion parameters can now be derived from a clinically useful volume of brain using MR perfusion. This technique takes us one step closer to evaluating intracranial pathophysiology, in addition to the anatomical information gathered from conventional MR. A brief review of pMRI is presented to better understand the methodology and the basis for clinical application of MR perfusion.
13.3.2 Technique
Several methods can be used to derive perfusion parameters using MR imaging. pMRI can be performed using either exogenous (gadolinium, deuterium oxide) contrast agents or endogenous (arterial water) (Cha et al. 2002).
Dynamic susceptibility-weighted contrast-enhanced perfusion MR imaging (DSC-pMRI) exploits the signal changes (T2⋆ signal loss) during bolus passage of a contrast agent through the cerebral vessels (Aronen et al. 1994; Ball and Holland 2001; Cha et al. 2000a; Ludemann et al. 2000; Siegal et al. 1997; Strong et al. 1993). Using tracer kinetic principles, the signal change is converted to an integral of tissue contrast agent concentration (Peters 1998; Rosen et al. 1990; Weisskoff et al. 1994). These values are then used to generate perfusion maps of various hemodynamic parameters.
To successfully image a large volume of brain during the finite time that contrast is within the cerebral vessels, faster imaging methods are necessary. EPI fulfills this requirement, with a temporal resolution of 100 ms/slice. Several different pulse sequences can be used with EPI (e.g., spin echo, gradient echo). Spin echo images are thought to be more sensitive to signal changes from contrast agent within the intra-capillary volume (Weisskoff et al. 1994). Gradient echo images are more sensitive to medium to large vessels, and therefore greater signal drop is seen during the first pass of a contrast agent. Although more prone to susceptibility artifact, gradient echo techniques are more sensitive to small changes in blood volume. Therefore, the gradient echo technique does not require high doses of contrast agent as does spin echo to produce diagnostic images (Hunter and Wang 2001; Yeung et al. 2001; Cha et al. 2002).
Dynamic contrast-enhanced (DCE) perfusion MR imaging is another type of pMRI using gadolinium based contrast agent. In contrast to the first-pass effect of DSC-pMRI, DCE-pMRI exploits the steady-state hemodynamics of intravascular contrast agent to measure alterations in endothelial permeability, which can be used as a noninvasive marker of vascular leakiness and degree of tumor angiogenesis. DCE-pMRI is based on the acquisition of serial T1-weighted images before, during, and after contrast administration. In contrast to routine post-contrast images that reflect enhancement characteristics at a single time point, DCE perfusion depicts the wash-in, plateau, and washout contrast kinetics of the tumor (Cha 2006; Essig et al. 2013).
Arterial spin labeling (ASL) permits evaluation of CBF without the use of intravenous contrast. ASL uses arterial blood water as an endogenous tracer by inverting the magnetization of blood using radiofrequency pulses. After a brief delay to allow these “labeled” intravascular protons to flow into the brain, imaging of the brain is performed in order to see the degree of flow of labeled protons into the cerebral hemispheres. Separate control images are also acquired in the same imaging session, and the signal difference between control and labeled images provides a measure of perfusion by arterial blood (Golay and Petersen 2006).
At our institution, ASL is performed on 1.5 T or 3 T field-strength scanners. While various methods of labeling were used in the early applications of ASL, the SNR of pseudocontinuous labeling is the method of choice for clinical applications (Zaharchuk 2012). We use a labeling period of 1,500 ms, followed by a 1,500 ms postlabel delay. 3D images are obtained while suppressing background with fast spin echo stacked technique. The total image time for the ASL sequence is approximately 3–4 min.
13.3.3 Applications
DSC-pMRI, as adjunct imaging to conventional MR imaging, has several potential applications. With the wide availability and application of faster imaging hardware and software, DSC-pMRI can be incorporated into the routine evaluation of intracranial lesions. Clinical roles for DSC-pMRI include grading neoplasms, distinguishing high-grade primary neoplasm from single metastases, directing stereotactic biopsies, and distinguishing therapy-related brain injury from residual or recurrent tumor (Cha et al. 2002; Knopp et al. 1999; Law et al. 2002; Maeda et al. 1993; Tzika et al. 2002). Some advocate that DSC-pMRI may be helpful in adjusting chemotherapy dosing (Cha et al. 2000b).
Preliminary results on grading of gliomas with DSC-pMRI are promising. Although some authors using spin echo sequences have shown no statistical correlation between tumor grade and perfusion imaging, gradient echo-derived blood volumes have been more robust in distinguishing grades of glioma (Aronen et al. 1994; Ball and Holland 2001; Ludemann et al. 2000; Roberts et al. 2000a; Rosen et al. 1991; Sugahara et al. 1998).
Separating high- from low-grade gliomas by histology relies on the presence of neovascularity and necrosis (Giannini and Scheithauer 1997; Plate and Mennel 1995). DSC-pMRI is a method that can noninvasively assess tumor vascularity and is complementary to histopathology in determining the grade and malignancy potential of a neoplasm (Fig. 13.2) (Gerlowski and Jain 1986).
Fig. 13.2
Right medial temporal lobe and chiasmatic glioma with pMR imaging characteristics of a vascular, intra-axial neoplasm. (a) Axial T1-weighted gadolinium-enhanced image of the infiltrating, enhancing neoplasm. (b) Axial color map of the relative cerebral blood volume (CBV) showing increased CBV within the neoplasm (white arrowheads) relative to normal vascularity on the contralateral side. (c) Axial T2-weighted image shows the regions (ovals) that were sampled to calculate the time-signal curves (2 normal left basal ganglia, 3 neoplasm). (d) Time-signal curve shows an intact blood–brain barrier (BBB) in region 2 (normal recovery of signal after the passage of the contrast bolus) but a partially disrupted BBB in region 3 (slower, incomplete recovery after the bolus due to contrast leaking through the BBB)
Histology alone may not accurately predict tumor biology or patient prognosis. DSC-pMRI correlates with the degree of tumor angiogenesis and therefore may be able to predict aggressive biology (Aronen et al. 1994). Hence, the more aggressive the tumor, the larger the rCBV, presumably due to tumor angiogenesis (Knopp et al. 1999; Sugahara et al. 1999). This technique offers a potentially powerful and noninvasive means of assessing tumor biology and serially monitoring changes in the tumor during therapy.
Most published reports using DSC-pMRI for tumor grading have studied adult patients. Sensitivity for this technique may be reduced in children since certain benign tumors, such as pilocytic astrocytoma and choroid plexus papilloma may have increased vascularity; that is, high rCBV (Ball and Holland 2001; Strong et al. 1993; Giannini and Scheithauer 1997; Plate and Mennel 1995; Keene et al. 1999). DSC-pMRI should be interpreted cautiously in heterogeneous tumors since rCBV can vary depending on the location chosen to place the region of interest. A region of interest placed in an area of necrosis or nonaggressive portion of the neoplasm could erroneously underestimate rCBV and result in undergrading of tumor. Alternatively, cortically based neoplasms that are contiguous with the brain surface vessels may be falsely given a higher grade due to a high rCBV from a region of interest placed over vessels (Sugahara et al. 2001). Larger studies are needed prior to DSC-pMRI’s inclusion as a routine clinical practice for grading tumors in children.
A promising application of perfusion imaging is distinguishing treatment-induced brain injury from residual or recurrent neoplasm (Cha et al. 2000b, 2002; Siegal et al. 1997; Roberts et al. 2000a; Rosen et al. 1991; Sugahara et al. 1999). With routine MR imaging, both entities can enhance after contrast administration and are indistinguishable until growth on serial imaging favors a diagnosis of neoplasm. DSC-pMRI takes advantage of the pathophysiologic differences in vascularity to separate the entities. Posttreatment brain injury, in part, is believed to be the result of endothelial damage followed by vascular thrombosis and blood–brain barrier (BBB) breakdown. This ultimately leads to hypoperfusion of the affected tissue (Chan et al. 1999). The final common pathway of delayed radiation injury is vascular thrombosis and fibrinoid necrosis, which on DSC-pMRI manifests as a decrease in rCBV when compared to normal tissue (Cha et al. 2000b, 2002). On the other hand, tumor cells require a viable blood supply for growth and spread and, therefore, increased rCBV is seen in recurrent and residual neoplasms (Ball and Holland 2001; Cha et al. 2000b; Plate and Mennel 1995). Preliminary results show that decreased signal on DSC-pMRI correlates well with treatment-induced brain injury (Ball and Holland 2001; Cha et al. 2000b; Plate and Mennel 1995).
Exceptions still exist in making this important distinction between tumor and therapy-induced brain injury. Normal or even decreased rCBV in the area of residual tumor can occur if neoplastic tissue is mixed with hypovascular necrotic tissue. Treatment-induced injury can lead to aneurysmal dilation of vessels and formation of telangiectasias that can artificially elevate the rCBV, leading to false positive results. Petechial hemorrhage or calcification in an area of residual tumor can produce susceptibility artifact that artificially reduces the rCBV, resulting in a false negative result (Sugahara et al. 2000). Further research is needed prior to standardized clinical use throughout multiple institutions.
DSC-pMRI continues to be investigated for use in guiding stereotactic biopsy of intracranial neoplasms. Usually, CT and MRI-guided biopsies of brain tumors, are directed to areas of conventional contrast enhancement. This approach, however, is prone to sampling error due to the intrinsic limitations of imaging enhancement to detect the most aggressive portion of a tumor (Cha et al. 2002; Joyce et al. 1978). In addition, limited tissue sample size can lead to erroneous grading and inadequate evaluation (Cappabianca et al. 1991; Chandrasoma et al. 1989).
Contrast enhancement on MR images reflects the areas of breakdown within the BBB (Greenwood 1991). This is often in the rim adjacent to a necrotic portion of the neoplasm. Elevated rCBV is considered to represent the areas of vascular hyperplasia in the aggressive, viable neoplasm and may not always correspond to a contrast enhancing portion (Cha et al. 2002). Using DSC-pMRI in addition to conventional anatomical images could result in reduced false negatives and errors in assessing tumor grade. Although still investigational, DSC-pMRI may be helpful in localizing the most aggressive portion of a neoplasm and serve as a complimentary tool to anatomic imaging (Aronen et al. 1994; Knopp et al. 1999; Rosen et al. 1991).
Future applications for DSC-pMRI under development include mapping dose distributions in neoplasms and following perfusion maps for therapy-outcomes research for new therapeutic agents (Cha et al. 2000b, 2002; Ludemann et al. 2000; Roberts et al. 2000a).
DCE-pMRI permits quantitative assessment of the blood–brain barrier and microvascular permeability. This can provide a more thorough assessment of brain tumor angiogenesis. Another advantage of DCE-pMRI is the high SNR that allows imaging at a higher temporal and spatial resolution.
ASL of tumors can be easily assessed qualitatively as elevated CBF will manifest as hyperintense signal relative to the remaining brain, and decreased CBF will show hypointense signal. For absolute measurements, regions of interests are placed on the tumor using postprocessing software. Comparisons can be made relative to the remaining brain or other areas within the tumor. Using the aid of conventional MRI sequences, care is taken to avoid placing regions of interest within areas of cyst, hemorrhage, or necrosis. Maximum ASL signal is recorded, in keeping with other studies in the assessment of gliomas (Knopp et al. 1999; Sugahara et al. 2001). Distinguishing high-grade and low-grade tumors has been suggested using ASL technique (Yeom et al. 2014).
The advantages of ASL include the lack of contrast requirement, high SNR, labeling efficiency, and potential for absolute CBF quantification. ASL can be repeated in cases of patient motion. In children, immature paranasal sinuses contribute to improved image quality due to less artifact (Yeom et al. 2014).
In summary, pMRI is no longer primarily a research tool, but an important diagnostic tool complementing conventional anatomical imaging. Clinical use for tumor grading, differentiating between residual neoplasm and treatment-associated injury, and assisting in therapy dosing and treatment follow-up are on the horizon. Guiding biopsies within heterogeneous tumors by perfusion imaging may reduce sampling errors and improve diagnostic accuracy.
13.3.4 Limitations
DSC-pMRI has several important constraints. Sensitivity to susceptibility artifact prevents its use in brain adjacent to the paranasal sinuses or the skull base (Cha et al. 2002; Ball and Holland 2001; Poussaint et al. 1995). The sequence is very sensitive to patient motion, and SNR is low in comparison to anatomic MR images (Cha et al. 2002; Aronen et al. 1994; Siegal et al. 1997). Only a limited volume of brain can be covered during the time it requires a contrast bolus to pass through the intracranial vasculature. Also, a compact delivery of the bolus (through a power injector) may be difficult to attain in a patient who has limited intravenous access (Siegal et al. 1997). Furthermore, care must be taken to recognize false positives that are created by normal structures (e.g., choroid plexus and cortical veins) (Aronen et al. 1994; Sugahara et al. 1998). Additional costs may be substantial, due to the stringent hardware and software requirements to acquire and process the MR data. Access to a physicist familiar with the MR technique is also beneficial for continued support (Cha et al. 2002).
DCE-pMRI is also not without limitations, which include the complexity in image acquisition and user-dependence. The postprocessing is also challenging, as the kinetics modeling and software both require some training (Essig et al. 2013).
Limitations to ASL include sensitivity to motion and artifact from metal in the face and head region from dental/orthodontic procedures. There may also be an underestimation of CBF in regions of delayed flow such as white matter (van Gelderen et al. 2008).
13.4 Nuclear Medicine
13.4.1 Principles
The role of radionuclide CNS imaging continues to evolve. The most commonly used techniques are single photon emission computed tomography (SPECT and positron emission tomography (PET)). Areas of current study include: differentiating lesions with similar imaging appearances (e.g., lymphoma from toxoplasmosis by thallium uptake), differentiating treatment injury from residual neoplasm, grading neoplasms, localizing the most aggressive portion of the tumor prior to therapy, predicting response to therapy, and localizing eloquent cortices prior to surgery (Maria et al. 1998; Ricci et al. 1998).
The most widely practiced application is that of differentiating residual neoplasm from treatment injury. Without special techniques (such as pMRI, see earlier section), this differentiation can be extremely difficult by conventional CT and MRI (Brunelle 2000; Di Chiro et al. 1988; Valk and Dillon 1991). Both entities produce altered vasculature that can result in identical-appearing edema and enhancement. Even biopsy can lead to a false diagnosis. It is difficult to know which area of enhancement represents an aggressive margin of neoplasm or just an area of active necrosis and BBB breakdown (Poussaint et al. 1995). If cognizant of the limitations, radionuclide imaging may be very helpful to select clinical scenarios.
Both SPECT and PET, utilizing several radionuclide imaging agents, have been studied in attempts to distinguish treatment injury from neoplasm. 99mTechnetium, 201thallium, 18fluorine, and 11carbon agents are the most cited (Di Chiro et al. 1988; Dadparvar et al. 2000; Go et al. 1994; Kim et al. 1992; Maria et al. 1994; Ogawa et al. 1991; Shinoura et al. 1997). 201Thallium SPECT and 18F-fluorodeoxyglucose (FDG) PET are currently the most utilized methods, but additional promising radionuclides are on the horizon (Chen and Silverman 2008; Hatakeyama et al. 2008; Lorberboym et al. 1997; Maria et al. 1997). The remaining discussion is limited to these agents.
13.4.2 Mechanism and Technique
The mechanism of thallium sequestration within tumor cells is unknown. The most accepted theories propose either passive uptake over a potential membrane gradient or high affinity for potassium-activated adenosine triphosphatase (Kim et al. 1992; Kaplan et al. 1987). Alteration of the BBB also contributes (Kim et al. 1992). Whatever the mechanism, thallium seems to be incorporated into neoplastic glial cells considerably more than into nonneoplastic cells. A typical dose for a 201thallium brain scan is 0.03–0.05 mCi/kg, and images are obtained 5–10 min after administering the dose intravenously (O’Tuama et al. 1998).
PET imaging for brain tumors is primarily with 18FDG, a compound that has chemical properties similar to glucose and is therefore incorporated into astrocytes as an energy source. However, 18FDG cannot be normally metabolized and, therefore, becomes entrapped within cells (Wang et al. 1996b). Increased 18FDG within tumor cells is attributed to the increased rate of glycolysis in rapidly growing neoplasms (Shinoura et al. 1997; De Witte et al. 2000). For pediatric brain scans, 0.14 mCi/kg of 18FDG is given intravenously and images are usually obtained 30 min later (Kaplan et al. 1999; Kincaid et al. 1998).
More recently, 18F-fluorothymidine (18FLT) and 11C-thymidine (TdR) have shown promise as alternatives to 18FDG for the evaluation of brain tumors in adult patients and animal models. These agents may more accurately reflect tumor-cell biology, owing to their interaction with thymidine kinase 1 (TK1), which is preferentially expressed during the S-phase of the cell cycle in proliferating cells. Intracellular phosphorylation of these agents by TK1 results in their retention within tumor cells. In addition, the near absence of proliferating cells in normal brain results in increased conspicuity of tumor from background with these agents. The higher cortical background activity of 18FDG results in a relatively lower sensitivity to distinguish between normal tissue and brain tumor cells (Hatakeyama et al. 2008; Bradbury et al. 2008; Muzi et al. 2006; Ullrich et al. 2008). O-(2-18F-fluoroethyl)-L-tyrosine (18F-FET) has been recently evaluated in children and adolescents with brain tumors with promising results (Dunkl et al. 2015), although only limited data exist. 18F-fluoromisoidazole is an agent sensitive to detecting hypoxia and is being studied as hypoxic regions within tumor are intrinsically more resistant to both chemotherapy and radiotherapy (Puttick et al. 2014).
13.4.3 Applications and Limitations
The usage of PET and SPECT to distinguish tumor from posttreatment injury has been studied extensively (Fig. 13.3). Both sensitivity and specificity of 18FDG PET are in the range of 80–90 % (Di Chiro et al. 1988; Valk and Dillon 1991; Kim et al. 1992; Pujol et al. 1998). At least 80 % of pediatric tumors have a high affinity for thallium. It may therefore be useful to distinguish neoplasm from posttreatment granulation tissue (Maria et al. 1998; Brunelle 2000). However, the grade of the neoplasm and histologic type do not always correlate with the amount of thallium uptake (Maria et al. 1994). Pilocytic astrocytoma has a very high metabolic rate and therefore often a high radiotracer uptake, even though it is a relatively benign neoplasm.
Fig. 13.3
PET imaging complimenting anatomic MR imaging in a case of tumor recurrence. (a) Axial T1-weighted gadolinium-enhanced image of a tectal glioma at presentation. (b) Axial T1-weighted gadolinium-enhanced image of the same tectal glioma (white arrow) after radiation treatment. The enhancing mass may represent posttreatment granulation tissue or residual neoplasm. (c) Axial PET image showing increased activity (black arrow) within the tectal mass, indicating residual active neoplasm
The data for PET are calculated from lesions that are at least 5–7 mm in dimension, the lower limits of resolution for this modality. This imposes a limitation on early detection of subtle neoplastic recurrence. Furthermore, the percentage of false negatives is rather high and, as a result, many authors do not consider this method acceptable for making therapeutic (Kim et al. 1992; Ogawa et al. 1991; Barker et al. 1997; Valk et al. 1988). Other PET agents, such as FLT, TdR 11C-methionine, 11C–choline, and 11C-tyrosine, have either had limited success in detecting neoplastic recurrence or are under active investigation (Go et al. 1994; Shinoura et al. 1997; Hatakeyama et al. 2008; Pirotte et al. 2007). The 20-min half-life of 11C agents necessitates on-site production, which is an obstacle to widespread use.
Biopsy guidance by PET has been successful in the limited number of patients studied (Go et al. 1994; Pirotte et al. 2007; Massager et al. 2000). In theory, the most aggressive portion of a tumor has the highest glucose uptake and, thus, the highest 18FDG uptake; thus, the PET can assist in localizing the most aggressive portion of a heterogeneous neoplasm for proper staging. However, identification of the most aggressive portion of the tumor has not been reproducible at every institution. This may be due to difficulties in coregistering the PET images to anatomic imaging (e.g., MR imaging) and, perhaps, a result of the difficulty in identifying very small regions of high-grade tumor (Maria et al. 1994, 1998). Furthermore, it can be difficult to differentiate regions of cortex (which has higher 18FDG uptake compared to normal white matter) from regions of tumor recurrence without additional MR imaging.
The thymidine radionuclides do not suffer from this high background activity. Yet, analysis of uptake kinetics for thymidine tracers offers conflicting results as to their utility in assessing tumor proliferation (Muzi et al. 2006; Ullrich et al. 2008). Localizing the most aggressive portion of the tumor with thymidine agents has been most successful with suspected high-grade, untreated gliomas (Muzi et al. 2006).
Accurately predicting tumor grade by imaging is imprecise and remains an elusive goal in practice. Some authors claim that radionuclide imaging is an equivalent, or occasionally better, predictor of survival in patients with a malignant glioma compared with the prediction based on histologic grade (Valk et al. 1988). Others believe that PET is at least adequate to distinguish high- from low-grade brain neoplasms (Valk and Dillon 1991; Kincaid et al. 1998; Pirotte et al. 2007; Black et al. 1994; Provenzale et al. 1999). However, most results indicate that nuclear imaging does not grade brain neoplasms with adequate accuracy to make it useful in clinical practice (Hatakeyama et al. 2008; O’Tuama et al. 1998; De Witte et al. 2000; Muzi et al. 2006; Choi et al. 2000). For example, high-grade neoplasms, often necrotic in part, have low uptake in the necrotic regions so that when averaged with high-uptake regions, they may appear as low-grade neoplasms when calculating overall uptake. In addition, some low-grade pediatric neoplasms, such as pilocytic astrocytomas have increased uptake, making them appear to be high-grade neoplasms.
Another potential application of radionuclides is to identify tumors that are sensitive to anti-angiogenic agents (O’Tuama et al. 1998; Valk et al. 1988). Some authors suggest using PET to localize eloquent cortices preoperatively for patients unable to tolerate MR imaging (Kaplan et al. 1999).
In general, radionuclide imaging is infrequently used for pediatric brain neoplasms at UCSF, with conventional MR imaging, perfusion imaging, and magnetic source imaging (MSI) being the imaging tools of choice. Radionuclide imaging also imposes a significant radiation dose, which is a significant issue in the pediatric population, as the effects of radiation exposure to children have a longer time to develop, with a resulting increase in its potential effects (Mettler et al. 2008). Each institution should determine the optimal tools for their patients depending upon their equipment and individual strengths.
One area of growing research is the use of combined PET-MRI via single modality scanning in the assessment of adult brain tumors (Puttick et al. 2014). PET-MRI scanners have improved temporal and spatial coregistration as opposed to scanning separately. In addition, the combined use will help validate the other modality. Our institution is currently evaluating this new modality to determine if this combined role can provide benefit.
13.5 BOLD/MSI
13.5.1 Principles
Two techniques used for locating brain activity during specific tasks are blood oxygenation level-dependent (BOLD) imaging and MSI. Many clinical applications of these techniques are under investigation, including evaluating reorganization after injury and deterioration during progressive disease, evaluation of therapies, and cortical mapping prior to neurosurgery (Roberts et al. 2000b; Vezina 1997). These techniques are well-developed in adults but are less useful in children, as they require a great deal of cooperation by the patient. Some authors have had success in children through the use of multiple training sessions. However, such training requires considerable time, personnel, and space, which are rarely available in most centers. Task-related activations, which require that the patient perform specific tasks, may be difficult or impossible in individuals with deficits such as reading disorders, mental retardation, hearing loss, and paralysis (Breier et al. 1999; Otsubo and Snead 2001; Simos et al. 1999). It is possible to perform some studies on sedated children, but it is not yet clear how much effect the sedation has on the results. Therefore, this section is based mainly on results in adults, in the hope that the difficulties in performing these studies in children will soon be overcome.
13.5.2 Mechanism of BOLD Imaging
In BOLD images, contrast is created by a local increase of oxygenated blood in activated tissue (Martin and Marcar 2001; Stippich et al. 1998). In theory, an activated group of neurons requires increased oxygenation. This increased need is fulfilled by local vasodilation, allowing more oxygenated blood to be transported to the activated cerebral cortex. The increase in blood flow more than compensates for the increased oxygen consumption, resulting in local increase in oxyhemoglobin and decrease in deoxyhemoglobin. As oxyhemoglobin is diamagnetic (does not alter the local magnetic field) and deoxyhemoglobin is paramagnetic (alters the local magnetic field and results in local signal loss), the reduced local concentration of deoxyhemoglobin results in less signal loss and increased local signal intensity (Beisteiner et al. 1995; Boxerman et al. 1995). This local signal alteration can be detected by susceptibility-weighted MR imaging sequences, if multiple acquisitions are performed.
13.5.3 Mechanism of MSI
Neuronal activation results in electrical current, which can be measured with electroencephalography. The electrical current generates magnetic flux, the magnitude of which is in the order of a few picoTeslas, a quantity that is 8 orders of magnitude smaller than that produced from the earth’s magnetic field and 12 orders smaller than that produced from MR imaging (Alberstone et al. 2000; Lev and Grant 2000). When performed in a room shielded from external magnetic fields, superconducting quantum interference devices (SQUIDs) (Stippich et al. 1998; Ganslandt et al. 1999) can be used to measure and localize these minute neuromagnetic signals using small receivers placed on the scalp (Alberstone et al. 2000; Papanicolaou et al. 2001). This technique is known as magnetoencephalography (MEG). MEG signal is generated from intracellular electron flux, not local vascular changes (as seen with fMRI) (Roberts and Rowley 1997), distinguishing it from EEG, which detects extracellular currents and is therefore less precise than MEG (Alberstone et al. 2000). Superimposition of MEG data on colocalized MR images is referred to as MSI (Stippich et al. 1998).
13.5.4 Applications of BOLD and MSI
The most widely used clinical application of BOLD imaging and MSI is the localization of eloquent function in the brain for preoperative planning (Fig. 13.4) (Roberts and Rowley 1997; Disbrow et al. 1999). Both BOLD and MSI can accurately localize the primary motor cortex (Pujol et al. 1998; Roberts and Rowley 1997). Sensitivity varies from 82 to 100 %, and often depends on whether the primary motor cortex is merely displaced, or partially destroyed by the pathologic process. Both techniques can also be used for localizing the language centers prior to surgical resection of neoplasm or of the temporal lobe for epilepsy (Simos et al. 1999). BOLD may have the additional benefit over MEG of simultaneously localizing multiple areas involved in complex brain function (Roberts et al. 2000b).
Fig. 13.4
Magnetic source imaging for preoperative surgical planning in a patient who presented with grand mal seizure and aura but without speech or motor deficits. (a) Axial T1-weighted gadolinium-enhanced image showing a nonenhancing left temporal lobe/basal ganglia low-grade glioma. (b) Axial T2-weighted image showing white squares (arrows) that correspond to areas of auditory stimulation with a 1,000 Hz frequency tone. The auditory cortex on the left side is displaced, but not invaded, by the neoplasm
The definitive test used to localize motor cortex is intraoperative cortical surface recording (Suzuki and Yasui 1992). For identification of language centers in either the right or left cerebral hemispheres, the Wada test (intracarotid amytal test) has been the standard test for many years, but BOLD techniques have similar sensitivities and are less invasive.
BOLD imaging has two major advantages in comparison to intraoperative surface recording: (1) localization is obtained preoperatively, allowing prospective surgical planning, and (2) the study can be performed at the same time as the preoperative MR imaging instead of lengthening operating room time for an additional procedure. Both techniques suffer when anatomic landmarks are distorted by the tumor, as the surgeon may encounter inadequate surgical exposure of the primary motor cortex, and the navigation based on the MR image may be changed by opening of the calvarium (Cedzich et al. 1996). Anesthetic agents may also influence the sensitivity of both the intraoperative and BOLD techniques (Cedzich et al. 1996), although older children and teens can generally undergo BOLD analysis without the need for sedation. In adults, overall sensitivity of intra-operatively localized eloquent function is roughly 91–94 % (estimated by postoperative deficits), which is similar to functional imaging (Simos et al. 1999; Ganslandt et al. 1999; Szymanski et al. 2001).
The Wada test requires an invasive catheter angiogram and sedation, both with inherent risks. Hemispheric dominance can be established in the majority of cases, but more specific cortical mapping is not possible (Simos et al. 1999). MSI and BOLD are both as sensitive and provide additional information that guides surgical approach and extent of resection (Pujol et al. 1998; Alberstone et al. 2000; Ganslandt et al. 1999; Dillon and Roberts 1999). MSI localizes eloquent regions of cerebral cortex, such as the primary motor cortex, within 3–4 mm in comparison to intraoperative electrocortical stimulation (Breier et al. 1999; Szymanski et al. 2001; Wheless et al. 1999).
13.5.5 Limitations
Several pitfalls must be kept in mind when implementing these new techniques. Limitations of BOLD imaging include poor temporal resolution that can never be better than the time that is required to produce a hemodynamic response to activated neurons, roughly 2–5 s (Martin and Marcar 2001; Lev and Grant 2000; Roberts and Rowley 1997). The spatial resolution is dependent on the anatomic proximity of vessels to activated brain; high-signal contribution by sulcal veins has a marked negative effect on resolution (Roberts and Rowley 1997; Dillon and Roberts 1999; Holodny et al. 1999). Infiltration by neoplasm and edema can further distort the anatomic relationship and possibly alter the autoregulation of local vessels (Pujol et al. 1998; Dillon and Roberts 1999; Holodny et al. 1999). Motion artifact, larger caliber vessels, and inflow effects can further distort localization (Pujol et al. 1998; Beisteiner et al. 1995; Boxerman et al. 1995; Holodny et al. 1999; Field et al. 2000). Despite these shortcomings, BOLD generally localizes activated groups of neurons within 1–2 cm of their anatomic location.
MSI is hindered by susceptibility artifact from orthodontia and other ferromagnetic metals that cause overwhelming artifacts (Breier et al. 1999); BOLD imaging is also affected by such artifacts, but not as severely. The precision of labeling eloquent cortex by MEG is very good, but not perfect. Point localization is reduced by the inaccuracies of transposing data from MEG to MRI, by roughly 4 mm of dispersal (Szymanski et al. 2001). Overall error in localization is thought to be approximately 1 cm (Beisteiner et al. 1995). This is superior to other accepted techniques, including BOLD. The largest drawback of MSI is the cost and lack of availability of the necessary equipment; whereas BOLD can be performed on a clinical magnet with software upgrade, MSI requires an expensive neuromagnetometer in addition to a clinical magnet.
In summary, functional imaging has some potential for use in pediatric brain tumor patients, but a number of problems need to be overcome before these techniques will be used routinely.
13.6 Diffusion Imaging
13.6.1 Principles
Diffusion-weighted imaging (DWI) is a technique that relies on the fact that the motion of water molecules causes decreased signal on specially acquired MR images (Mitchell 1999). Also available are special types of DWI, known as diffusion tensor imaging (DTI) and high angular resolution diffusion imaging (HARDI), which allow both the net direction and the magnitude of water motion in a voxel to be determined. These techniques have applications in the assessment of brain tumors.
13.6.2 Technique
All diffusion techniques allow the calculation of net water motion in a volume of tissue. The mean diffusivity (MD) represents the average motion of all free water molecules in a voxel during the period of the MR data acquisition (Filippi et al. 2001; Inglis et al. 1999; Poupon et al. 2000).
Related posts:

Stay updated, free articles. Join our Telegram channel

Full access? Get Clinical Tree


