6 Metabolic Imaging
 Positron Emission Tomography
Positron emission tomography (PET) provides metabolic in vivo measurement of local tracer activity at a very high sensitivity. This is a unique property unmatched by other imaging modalities. As major structural lesions, brain tumors are diagnosed and clinically managed primarily with computed tomography (CT) and magnetic resonance imaging (MRI). However, it is possible to improve clinical management by using PET to provide physiological and biochemical information related to tumor metabolism, proliferation rate, and invasiveness as well as relation to functionally important tissue.1
In this context, image registration is extremely important for accurately correlating abnormalities on the MRI with findings on the PET scan. Different modalities, such as methyl– [11C]-L-methionine ([11C]-MET) and 2-[18F]fluoro-2-deoxy-D-glucose ([18F]-FDG), can be co-registered to magnetic resonance images in glioma patients.
If the images are not registered, the location of a small abnormality on MRI cannot be accurately identified on PET. The registration with MRI permits the accurate characterization of even small MRI lesions. The image registration permits the interpreting physician to be more accurate and confident in the diagnosis.
Imaging Glucose Metabolism
Glucose is the main substrate for energy supply of the brain by oxidation. It is transported into the brain by the insulindependent carrier GLUT 1, which is expressed in brain capillary endothelial cells. Transport rates depend on the plasma glucose levels in accordance with Michaelis-Menten kinetics for facilitated transport. The standard PET tracer for measuring cerebral metabolic rate of glucose (CMRGlc) is [18F]-FDG. [18F]-FDG is transported into the tissue and phosphorylated to [18F]-FDG-phosphate but does not undergo significant further metabolism. It accumulates in brain in proportion to local CMRGlc. Methods for quantification are based on physiological monitoring. Because [18F]-FDG is an analogue tracer and has different physiological properties than glucose, conversion factors like the “lumped constant” are necessary to calculate CMRClc.2
Glucose consumption measured by [18F]-FDG-PET is increased in most malignant gliomas.3 Although uptake correlates with degree of malignancy, there are concerns about the use of the [18F]-FDG model to calculate the CMRClc in brain tumors. The lumped constant used in the model to estimate glucose consumption from [18F]-FDG uptake seems to be higher in tumors and therefore overestimates the glucose consumption if the value for the normal brain is used. Changes in the lumped constant in tumors compared to normal brain may be due to increased expression of hexokinase II in tumors. Hexokinase II has a higher affinity to [18F]-FDG compared to hexokinase I, which is expressed in the normal brain.4 Increased transport may also play a role together with increased glycolysis compared to oxidative metabolism of glucose.
In clinical routine, [18F]-FDG images are analyzed visually or the relative [18F]-FDG uptake compared to normal brain structures that are not affected by the tumor is calculated. Preferably, uptake in the cerebral cortex or the deep white matter is used to calculate relative uptake ratios by using average uptake in regions of interest.
Imaging for Primary Diagnosis
At the point of first diagnosis, patients with brain tumors most often have either new-onset generalized or focal seizures or demonstrate progressive focal neurologic symptoms. They are referred for CT or MRI, and in most cases the diagnosis of a primary brain tumor can be made from MRI alone. But it is not uncommon that other differential diagnoses, such as acute inflammatory lesions or ischemic or hemorrhagic stroke, cannot be excluded by MRI findings. Differentiating tumors from nontumorous lesions with [18F]-FDG is difficult because of the high [18F]-FDG-uptake in normal cortex (Figs. 6.1 and 6.2). Low [18F]-FDG uptake is frequently seen in brain tumors; low-grade gliomas especially show [18F]-FDG levels comparable to those of white matter and cannot be distinguished from nontumorous lesions like inflammation or acute stroke. On the other hand, high [18F]-FDG uptake is not specific for brain tumors, but may also be seen in inflammatory lesions (e.g., sarcoidosis, acute demyelinating encephalomyelitis), focal epilepsy, and recent ischemic infarcts with nonoxidative glycolysis. On [18F]-FDG-PET imaging tumors often demonstrate a wide rim of reduced [18F]-FDG uptake, which might be also due to functional inactivation by the infiltrating tumor growth or edema formation (Figs. 6.1 and 6.2).
Pitfall
• For the interpretation of FDG brain scans, the similarity of FDG uptake of tumor and cortex is a limiting factor, which is especially critical for small lesions. Due to the limited spatial resolution of PET and partial volume averaging, FDG uptake can be underestimated in small lesions. The best assessment of FDG uptake in brain tumors is obtained if co-registration with MRI permits reliable localization of PET data.
The sensitivity to detect lesions is further decreased by the high variance of [18F]-FDG uptake and its heterogeneity within a single tumor that has areas of low uptake and areas of high uptake near each other. Therefore, [18F]-FDG grading of newly discovered gliomas must be applied with caution, and the high variability must be taken into consideration. Delayed imaging (3 to 8 hours after injection) can improve the distinction between tumor and normal gray matter,5 because excretion of the tracer is faster in normal brain than in tumor tissue.6
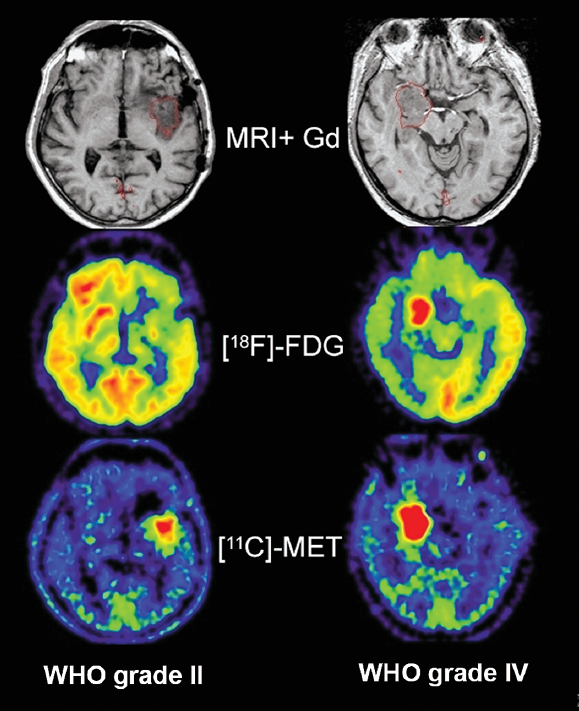
Fig. 6.2 MRI, [18F]-FDG-PET, and [11C]-MET-PET in low- and high- grade gliomas. [18F]-FDG clearly distinguishes between the low-grade and the high-grade tumor in contrast to MRI. [11C]-MET shows higher uptake in the malignant tumor but a clear differentiation is not possible in these examples. (From Jacobs AH. PET in gliomas. In: Schlegel U, Weller M, Westphal M, eds. Neuroonkologie. Berlin: Thieme-Verlag, 2003:72–76. Copyright 2003, Thieme-Verlag. All rights reserved. Reproduced with permission.)
The amount of accumulation of FDG in a primary brain tumor correlates to histological tumor grade,7 to cell density,8 and to survival.9
Low-grade tumors have [18F]-FDG uptake similar to or less than that of normal white matter, whereas high-grade tumors have [18F]-FDG uptake equal to or exceeding that of normal gray matter (Figs. 6.1, 6.2). In a study of 58 patients tumor-to-white matter (T/WM) and tumor-to-gray matter (T/GM) ratios were able to distinguish benign (grades I and II) from malignant tumors (grades III and IV).10 T/WM ratios greater than 1.5 and T/GM ratios greater than 0.6 showed a sensitivity of 94% and a specificity of 77% for the detection of malignant tumors.10 Glucose consumption in normal brain tissue is reduced in most patients with malignant brain tumors.11 The impairment of tissue metabolism is related to prognosis.12 The most malignant gliomas (grade IV, glioblastoma) show high uptake, which is often heterogeneous due to necroses typical for this tumor type. Relatively benign tumors with high FDG uptake include pilocytic astrocytoma, which is characterized by metabolically active fenestrated endothelial cells, and ganglioglioma. In meningiomas FDG uptake is variable and may be related to aggressiveness and probability of recurrence.13 Other malignant tumors in the brain—primitive neuroectodermal tumors, medulloblastomas, malignant lymphomas, and brain metastases from systemic cancers—often show high FDG uptake (review in14).
Differentiation Between Recurrent Tumor and Necrosis
After tumor resection, normal postsurgical changes do not show increased FDG uptake. Therefore, hypermetabolic activity after surgery is highly indicative of residual tumor, and [18F]-FDG-PET can be performed within a few days after surgery.15
One of the most important applications of PET tracers is in the post–radiation therapy setting, where it can be used to differentiate between radiation-induced changes like necrosis or recurrent or residual tumor.3 Generally, the question “tumor or necrosis” is an oversimplification, as in most cases both tumor and necrotic tissue can be found next to each other in individual patients.
Several weeks after treatment, the therapeutic effects of radiotherapy can be visualized. [18F]-FDG shows a transient increase of uptake in the initial phase caused by infiltrating macrophages consuming [18F]-FDG.16,17 A newly detected hypermetabolism weeks after therapy indicates a recurrent tumor and progression from low-grade to high-grade glioma.15 One study showed that the sensitivity of [18F]-FDG-PET for the detection of recurrent tumor versus radiation necrosis was 75% and the specificity was 81%.18 Another study showed that there is a certain overlap in [18F]-FDG uptake in recurrent tumor and radiation necrosis.19 Disadvantages of [18F]-FDGPET include accumulation of [18F]-FDG in macrophages that may infiltrate the sites having received radiation therapy. Therefore, radiation necrosis may be indistinguishable from recurrent tumor.
Patients with brain tumors have decreased glucose metabolism in the contralateral cortex and the degree of decrease correlates with tumor size.20 This phenomenon might also be caused by corticosteroids, but a functional inactivation of the contralateral hemisphere by deafferentation of the input from the ipsilateral hemisphere cannot be excluded.20
Biopsy Planning
Gliomas are characteristically heterogeneous and may pre sent with areas of different histological grade when they progress to a more malignant subtype. This smaller part of the tumor that already has progressed to a more malignant grade might not show contrast enhancement on MRI or CT. Therefore, MRI- or CT-guided biopsies may be associated with significant sampling error and potentially incorrect staging. Trajectory planning in stereotactic biopsy based on [18F]-FDG-PET improves the detection of tumor tissue when compared to anatomic imaging alone.21
Therapy Response Assessment
It is very important to detect responders and nonresponders as early as possible during chemotherapy regimens, and it is crucial not to forfeit bone marrow reserve and quality of life to an ineffective treatment.
One study of patients with recurrent high-grade gliomas undergoing treatment with temozolomide (TMZ) looked at early evaluation of tumor metabolic response using [18F]-FDG–PET.16 The metabolic rate of glucose was quantified in nine patients prior to and 14 days after TMZ treatment and was compared with objective response after 8 weeks. Pretreatment metabolic rate of glucose was higher in responders than nonresponders. The responding patient group had a greater than 25% reduction in CMRGlc in regions of high focal tumor uptake after 8 weeks.16 FDG-PET imaging has been shown to predict tumor metabolic response to TMZ versus TMZ plus radiotherapy in recurrent high-grade glioma.22 Therefore, monitoring of therapeutic response by PET imaging is now done to provide an early assessment of therapy efficacy and aid oncologists in optimizing therapeutic management of brain tumors.
Another study evaluated the ability of FDG-PET to detect response to a mammalian target of rapamycin (mTOR) inhibitor used to treat glioblastoma multiforme.23 mTOR functions within the phosphatidylinositol 3-kinase (PI3K)/Akt signaling pathway as a critical modulator of cell survival. On the basis of promising preclinical data, the safety and tolerability of therapy with the mTOR inhibitor everolimus in combination with radiation therapy and TMZ was evaluated in a phase I study. The study concluded that changes in tumor metabolism could be detected by FDG-PET in a subset of patients within days of initiating everolimus therapy.23
Special Consideration
• Positron emission tomography imaging is now used in the clinical setting to assess early response to certain therapies and help guide further therapeutic strategies
 Imaging Amino Acid Metabolism
Several studies using different amino acid tracers demonstrate that increased amino acid uptake in gliomas is not a direct measure of protein synthesis but rather seems to be due to increased transport mediated by type L amino acid carriers.24,25 In a rat tumor model, facilitated transport of amino acids was upregulated, which suggested that tumors can influence transporter expression in their vasculature.25 At the normal blood–brain barrier the sodium-independent L-transporter system in the luminal membrane of endothelial cells is the main mechanism of methionine and tyrosine transport into brain tissue.26,27 Movement of an amino acid across sodium-independent transporter systems is driven by its extra- to intracellular concentration gradient, but it is frequently associated with countertransport of a second amino acid. The gradient of this second amino acid can be established by one of the sodium-dependent carriers like the A-system, which is located in the abluminal endothelial cell membrane at the blood–brain barrier and transports amino acids with short, polar side chains.26,27 Transport system A is overexpressed in neoplastic cells and seems to be positively correlated with tumor cell growth rate.28 This increased growth rate requires an efficient and increased supply of nutrients for protein synthesis, energy metabolism, and proliferation. Therefore, elevated transport of amino acids is not only a result of increased protein synthesis but also reflects the increased demand for the different metabolic activities in the tumor cell. It is well known that tumors can influence growth of their vasculature and therefore can regulate their nutrient supply, including amino acids.
Amino acid uptake in the normal cortex is higher than in white matter, but relatively low when compared to the high background activity of the normal cortex in [18F]-FDG-PET (Fig. 6.2).
Tracers
The most frequently used radiolabeled amino acid is methyl– [11C]-L-methionine ([11C]-MET).29 Various amino acids have been labeled for tumor imaging especially with PET. As [11C]-labeled tracers can only be used in centers with an onsite cyclotron, there were several attempts to label amino acids with [18F]-fluorine to facilitate a wider use of amino acid tracers. Clinically relevant findings have been obtained mainly with two of them: (1) O-(2-[18F]fluoroethyl)-L-tyrosine (18FET), which showed similar results when compared to [11C]-MET; and (2) [18F]fluoro-Dopa (18F-Dopa), which is a very interesting amino acid tracer that has been successfully used in movement disorders for several years and that also showed comparable results to [11C]-MET.29
18FET and 18F-Dopa are transported into the brain and tumor, but no further metabolism takes place; thus they reflect transport only. [11C]-MET, in contrast, is used in different metabolic pathways. It is incorporated into proteins, used for methylation, and is needed for DNA translation.
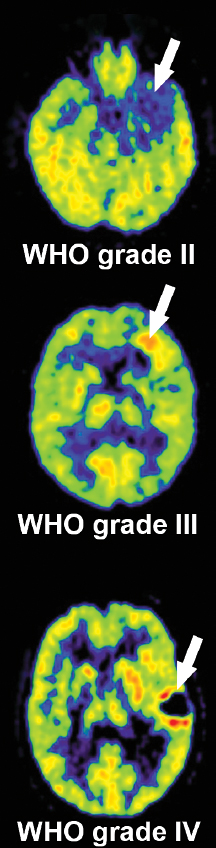
[11C]-MET uptake ratios compared with background activity in tumors is in the range of 1.2 to 6.0 for gliomas. Uptake correlates to cell proliferation in cell culture, Ki-67 expression, proliferating cell nuclear antigen expression, and microvessel density,30 indicating its role as a marker for active tumor proliferation and angiogenesis. Of all the gliomas, the highest uptake is observed in anaplastic oligodendrogliomas World Health Organization (WHO) grade III.
Imaging for Primary Diagnosis
In a study of 89 patients, [11C]-MET demonstrated a sensitivity of 76% and a specificity of 87% for distinguishing brain tumors from nontumoral brain lesions.31 Low-grade tumors are especially better detected by amino acid tracers because of the low background activity of normal brain (Fig. 6.3
Related posts:

Stay updated, free articles. Join our Telegram channel

Full access? Get Clinical Tree


