Measurement of Lipids, Lipoproteins, and Apolipoproteins
Measurement of Lipids, Lipoproteins, and Apolipoproteins
Paul S. Bachorik
The concentrations of the plasma lipoproteins strongly predict the development of cardiovascular disease (CVD) and are used to evaluate the dyslipoproteinemias and assess the success of treatment to prevent CVD. The accurate and reproducible measurement of the plasma lipoproteins is therefore of paramount importance and constitutes the subject of this chapter.
Plasma lipids are transported by special lipid-carrying molecules called lipoproteins. Such transport requires the presence of apolipoproteins, a distinct class of proteins that helps to solubilize hydrophobic lipids. Four major classes of lipoproteins are found in blood. Three of these, very-low-density lipoproteins (VLDL), low-density lipoproteins (LDL), and high-density lipoproteins (HDL) are always present in normal plasma. The fourth, chylomicrons, appear transiently following a fat-containing meal, are metabolized rapidly and are normally completely removed after 12 hours.
The total protein concentration of plasma is normally about 7 g/dL. The apolipoprotein components of the lipoproteins together account for only about 2.5% of this, but transport virtually all of the plasma lipids.
Nonpolar lipids, primarily cholesteryl ester (CE) and triglycerides (TG), form the core of the lipoprotein particle. Unesterified cholesterol (UC) and phospholipids (PL), principally phospatidylcholine (lecithin) and sphingomyelin, are at the surface of the particle with the apolipoproteins. Lipoproteins have neither unique chemical structures nor fixed lipid-protein compositions. Each lipoprotein class comprises a population of similar particles whose compositions vary somewhat. Table 2.1 summarizes the properties of the plasma lipoproteins.
TABLE 2.1 PROPERTIES OF THE MAJOR LIPOPROTEIN CLASSES
aData from Bachorik PS, Denke MA, Stein EA, et al. Lipids and dyslipoproteinemia. In: Henry JB, ed. Clinical Diagnosis and Management by Laboratory Methods. 20th ed. Philadelphia: WB Saunders; 2001:224-248(30); Rifai N, Bachorik PS, Albers JJ. Lipids, lipoproteins and apolipoproteins. In: Burtis CA, Ashwood ER, eds. Tietz Textbook of Clinical Chemistry. Philadelphia: WB Saunders; 1999:809-861 (3); and Scanu AM. Lipoprotein(a). Arch Pathol Lab Med. 1988;112:1045-1047 (31).
bFor purpose of this comparison, HDL3 is assigned a value of 1.
Chylomicrons are synthesized in the intestine and appear postprandially; they are not normally found in fasting individuals. Each chylomicron contains one molecule of apolipoprotein B-48 (apoB-48), the intestinal form of apoB. TG make up about 90% of the mass of chylomicrons. VLDL is secreted primarily by the liver and contains about 55% TG. Each VLDL particle contains one molecule of apoB-100, the hepatic form of apoB. VLDL-TG are hydrolyzed in the circulation to produce VLDL remnant particles that are smaller and more cholesterol enriched. The TG in VLDL remnants are hydrolyzed, producing intermediate-density lipoproteins (IDL) that are taken up by the liver or converted into LDL. About 55% of the weight of LDL is cholesterol, two-thirds of which is esterified. IDL, the immediate precursor of LDL, has a lipid composition intermediate between VLDL and LDL, and is normally present in low concentration. LDL, the major cholesterol carrier in normal plasma, transports about two-thirds of the plasma cholesterol. Each molecule of VLDL contains a single molecule of apoB-100, and this apolipoprotein remains with the lipoprotein particle as it is metabolized from VLDL to IDL to LDL (see also Chapter 1).
β-VLDL (floating beta lipoprotein) is an abnormal lipoprotein that accumulates in type III hyperlipoproteinemia (see the following text) and arises from incompletely metabolized TG-rich lipoproteins. β-VLDL is enriched in cholesterol compared to normal VLDL, and although this lipoprotein has a density similar to VLDL, its electrophoretic migration is similar to that of LDL. These properties are used to detect β-VLDL when it is present (see the following text and Chapter 7).
Lipoprotein(a) (Lp(a)), also an apoB-containing lipoprotein, is a minor lipoprotein class and normally accounts for a few mg/dL cholesterol. Lp(a) consists of an LDL molecule whose apoB-100 component is covalently bound by a disulfide bridge with apo(a), a glycoprotein homologous to plasminogen. The functions of Lp(a) are incompletely understood, but it is also an acute phase reactant that can increase substantially after acute trauma or infection (see also Chapter 18).
HDL comprise two major subfractions, HDL2 and HDL3. ApoA-I is the major protein of HDL, comprising about 70% of the protein. AapoA-II accounts for about 15% of the protein in HDL. PL are the major lipids of HDL (about 50% by weight) (Table 2.1). HDL participates in the metabolism of the TG-rich lipoproteins and the transport of cholesterol from peripheral tissues to the liver for reuse or excretion in bile (see also Chapter 9).
Increased amounts of the apoB-containing lipoproteins increase risk for CVD. Conversely, low levels of the apoA-I-containing lipoproteins are associated with higher risk for CVD.
BIOCHEMISTRY AND CLINICAL CHEMISTRY OF LIPOPROTEIN ANALYSIS
Analytical Ultracentrifugation
One of the earliest methods used to study the lipoproteins was analytical ultracentrifugation, developed by Dr. John Gofman, the “father of lipoproteins.” The rate of sedimentation of a protein depends on its size, shape, and density. The ultracentrifugal migration of a protein in a solution of initially uniform concentration can be followed by measuring the rate at which its concentration changes across the moving boundary that forms as the protein sediments. A system of Schlieren optics is used to follow the change in refractive index of the solution as a measure of its concentration.
The hydrated densities of most proteins exceed 1.3 g/mL, compared to <1.21 g/mL for the lipoproteins. Ultracentrifugation affords a method by which to isolate lipoproteins and determine their concentrations.
The lipoprotein fractions of plasma from fasted subjects are floated free of the other plasma proteins by preparative ultracentrifugation at two densities, d = 1.063 and 1.21 g/mL. The lipoproteins that float at d = 1.063 g/mL include VLDL, IDL, LDL, and part of the Lp(a). The lipoproteins that float at d = 1.21 mg/dL include all the apoB-containing lipoproteins and all the apoA-I-containing lipoproteins (HDL2 and HDL3). The pattern of lipoproteins in a particular plasma specimen was determined by subjecting both fractions to analytical ultracentrifugation at their respective densities. The flotation rates vary with lipoprotein density and can be measured by following the changes in refractive index as described in the preceding text for proteins.
For example, at d = 1.063 g/mL, VLDL floats more quickly than IDL, which is faster than LDL. The relative concentrations of the three lipoproteins can be determined by recording the Schlieren patterns after specified times of ultracentrifugation and using the areas under the curves as a measure of lipoprotein mass. The relationship between lipoprotein mass and refractive index is determined empirically for each of the lipoproteins.
Analytical ultracentrifugation is a technically demanding method requiring strict attention to the details of sample preparation, density adjustment, temperature, and centrifugation times and acceleration rate. Various physical-chemical effects must also be taken into account: Ogston-Johnson effects; changes in the flotation rates of each lipoprotein class as its concentration changes during the run; and the formation of salt gradients in the ultracentrifugal field. Finally, to ensure uniformity of reporting, the observed data are adjusted to standard conditions of temperature and density. For these reasons, analytical ultracentrifugation was never widely used in either clinical or research laboratories. It remains of historical interest because it was originally used to define the major lipoprotein classes.
Measuring Lipoprotein Cholesterol
The measurement of the total mass (i.e., the sum of the masses of each lipid and apolipoprotein) of a lipoprotein particle is difficult and time-consuming. Because plasma total cholesterol (TC) was initially found to be associated with CVD, and cholesterol is distributed among the lipoproteins, it was natural to analyze lipoprotein cholesterol (LP-C) as a measure of lipoprotein concentration. This has several advantages. First, LP-C can be measured in the presence of the other plasma proteins. It is only necessary to separate the lipoproteins from each other. Second, TC can be used to estimate quantitatively the recovery of lipoprotein fractions and to set standards for acceptable recoveries.
Low-density Lipoproteins
LDL carries most of the cholesterol in plasma and was the first of the apoB-containing lipoproteins to be recognized as atherogenic. Chylomicrons and VLDL are too large to enter the vascular wall, but the remnants of their metabolism can enter when they become sufficiently small and persist in the circulation. Thus, unmetabolized chylomicrons and VLDL are not felt to be atherogenic, even at high concentration. However, both these TG-rich lipoproteins can increase TC concentration if the concentration(s) of either or both in the blood is sufficiently high. Note that increased amounts of HDL-C can also contribute significantly to TC and would overestimate the risk for CVD if determined from TC alone. Conversely, TC could underestimate risk for CVD when HDL-C is very low. For these reasons, it was necessary to distinguish cholesterol in LDL from that in the other major lipoproteins, and reliable methods applicable for clinical use have been available for over 50 years. They are well understood and are described in more detail in the following text.
TG-rich Remnants and IDL
Chylomicron and VLDL remnants, and IDL, are atherogenic when they persist in the circulation too long because their cholesterol content increases as they are catabolized and the particles become smaller and more depleted of TG (see also Chapter 7). The LDL methods described in the following text do capture the contribution of IDL, and there has also been interest in capturing the contributions of remnant cholesterol to the risk for CVD (see the following text).
High-density Lipoproteins
HDL carries about 20% of the circulating cholesterol. HDL can be separated into two major subfractions, HDL2, the larger and less dense of the two, and HDL3. In practice, total HDL-C is usually measured. VHDL (d = 1.21 − 1.25) is a particle found in trace amounts and appears to contain newly secreted apoA-I. The particle is composed primarily of apoA-I and lecithin.
Blood Samples from Fasting versus Nonfasting Subjects
The measurement of lipids and lipoproteins is ordinarily performed in samples taken from patients who have fasted for at least 10 hours. However, TC, non-HDL-C (calculated as the difference between TC and HDL-C), and apoB and apoA-I can be measured in specimens from nonfasting patients. It has also been the practice of some workers to measure HDL-C in the nonfasting patient, but because of the transient compositional changes that occur during the metabolism of chylomicrons, the HDL-C concentration will be slightly lower than in the fasting state.
MEASUREMENT METHODS
Measuring lipoproteins is basically a two-step process, isolating the lipoproteins of interest and quantitatively measuring them. With some methods, the observed data must be converted to clinically useful measurements (see the following text). “Isolation” can refer to the physical removal of the lipoprotein of interest from plasma, or its functional isolation by using specific agents to render it nonreactive (see the following text).
Many methods have been used for lipoprotein analysis, including ultracentrifugation; electrophoresis in media such as paper, cellulose acetate, agarose gel, and polyacrylamide gel; column chromatography, high-performance liquid chromatography (HPLC); nuclear magnetic resonance (NMR) spectroscopy; selective precipitation with polyanions and divalent cations; immunochemical assays; and various combinations of methods.
It is instructive first to discuss two of the best understood methods, “beta quantification” and use of the Friedewald equation (1). Several newer methods will also be described.
Beta quantification is used to measure low-density lipoprotein cholesterol (LDL-C) in patients with very high TG, and to evaluate the presence of β-VLDL (floating beta lipoprotein), found in patients with type III hyperlipoproteinemia. The Friedewald equation is used to screen for hyperlipidemia and for follow-up after the nature of the dyslipoproteinemia has been defined. Both are performed in plasma from fasted subjects. Plasma is used for the beta quantification method and either plasma or serum is used for the Friedewald equation (but see section “Plasma-Serum Differences”).
Both methods assume the following relationship:
Small amounts of IDL-C and Lp(a)-C can also be present, and together usually contribute 2 to 4 mg/dL to the TC concentration in most people.
We need first to specify exactly what is meant by the term “lipoprotein cholesterol.” Consider LDL-C. About 8% of the mass of LDL is UC and about 42% is CE. However, the value reported as LDL-C specifically refers to the LDL-sterol nucleus; it excludes the mass of the fatty acid moieties of CE. Since the sterol nucleus contributes about 60% to CE mass, its contribution to LDL mass is 0.42 × 0.60, or about 25%. Thus, about one-third (8% UC + 25% CE) of the mass of LDL is due to sterol nucleus. Therefore, an LDL-C concentration of 100 mg/dL would correspond to a total LDL mass concentration of about 300 mg/dL.
Beta Quantification
Beta quantification is a well-characterized lipoprotein method. The term “beta quantification” actually refers to a battery of tests used to measure the concentrations of the major lipoprotein classes, and to detect chylomicrons and β-VLDL if present.
The Standing Plasma Test
This test is easy to perform and detects the presence of chylomicrons. Plasma from a patient whose TG concentration exceeds 400 mg/dL is generally turbid, reflecting the presence of chylomicrons, elevated VLDL, or both. It is necessary to distinguish the two and the standing plasma test does this. A standard volume of plasma, usually 2.0 mL, is placed into a 10 mm × 75 mm test tube and allowed to stand in the refrigerator undisturbed overnight. Normal plasma is clear when fresh and remains clear upon standing. Chylomicrons lend turbidity to fresh plasma, but because of their extremely low density, they form a floating white creamy layer upon standing. The underlying plasma remains turbid if VLDL is also elevated, but clear if it is not. The presence of visually detectable chylomicrons in the fasting state is abnormal. In a rare genetic dyslipidemia, type I hyperlipoproteinemia, TG concentrations can considerably exceed 2,000 mg/dL (see also Chapter 7). The catabolism of TG in chylomicrons is faulty, either because of a genetic lack of lipoprotein lipase (LPL) or its cofactor, apoC-II. Upon standing, the chylomicron layer is prominent, and can extend 50% or more down from the surface, while the infranatant plasma is completely clear. Assays exist to differentiate between the lack of LPL or apoC-II (see also Chapter 7), but the results would not alter treatment of a patient with a type I lipoprotein pattern.
In types III and V hyperlipoproteinemia, the catabolism of the TG-rich lipoproteins is not completely blocked. Upon standing, the chylomicrons are visible as a much less prominent layer than in type I, and the underlying plasma is usually turbid due to the presence of β-VLDL (type III), or a high VLDL concentration (type V). Occasionally, a wisp of chylomicrons may be observed overlying clear plasma in which TG are not elevated. This can occur if the plasma specimen is taken from a nonfasting or insufficiently fasting patient.
When only LDL is elevated, freshly drawn plasma is clear, even with LDL-C values that exceed 800 mg/dL, and it remains clear on standing overnight in the refrigerator. The standing plasma test in this case gives the same result as for normal plasma. If VLDL is elevated, either alone or with elevated LDL, freshly drawn plasma is turbid. It remains turbid upon standing, but lacks the chylomicron layer.
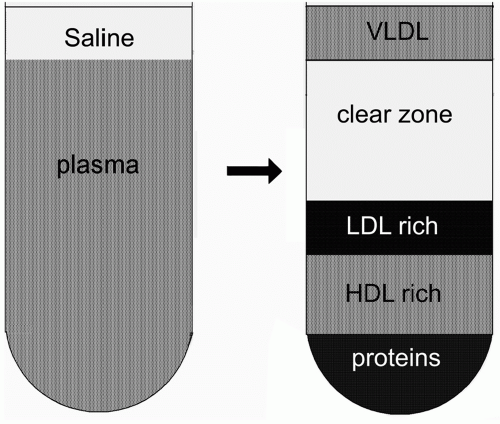
Ultracentrifugation
The nonprotein density of plasma is 1.006 g/mL. Plasma is overlaid with isotonic saline and subjected to ultracentrifugation at its own density for 18 hours at 105,000 × g (i.e., 1.89 × 10⁶ g-hr) at 10°C (Fig. 2.1). Under these conditions, VLDL floats to the top of the ultracentrifuge tube. The floating layer also contains any chylomicrons and/or β-VLDL present. This layer is quantitatively removed and reconstituted to known volume with isotonic saline.
The other plasma proteins and lipoproteins have densities >1.006 g/mL and remain in the ultracentrifugal bottom fraction. They can be observed layered according to their densities, serum proteins at the bottom, the HDL-rich layer next, and the LDL-rich layer lies atop the HDL layer (Fig. 2.1). The bottom fraction is quantitatively recovered and reconstituted to known volume with isotonic saline.
TC in unfractionated plasma and cholesterol in both ultracentrifugal fractions are measured. The recovery of cholesterol is calculated and should average about 98% in proficient laboratories. A recovery of <95% should be rejected and the separation repeated.
FIGURE 2.1 Graphic representation of preparative ultracentrifugation. (Left) Unfractionated plasma. (Right) After ultracentrifugation at 105,000 × g for 18 hour at 10°C.
The top fraction can be difficult to recover quantitatively. Unless TG are markedly elevated, the top fraction contains a relatively small proportion of the plasma cholesterol, and the loss of just a few mg/dL of VLDL-C can translate into a fairly large percent loss in VLDL. For this reason, the concentration of VLDL-C is calculated as the difference between TC and that in the bottom fraction.
Cholesterol in the bottom fraction is in LDL and HDL. After measuring HDL-C in a separate assay, LDL-C concentration is calculated as
Of course the bottom fraction contains all of the lipoproteins of d > 1.006 g/mL, including Lp(a) and IDL. The value reported as “LDL-C” includes the cholesterol in these two lipoproteins. This is not usually a serious problem for two reasons. First, IDL and Lp(a) are both atherogenic. Second, most of the data that relate LDL-C with the risk for CVD were collected using this method or the Friedewald method (see the following text), which also includes IDL-C and Lp(a)-C in the LDL-C measurement. Thus, when the relationship between LDL-C and CVD risk is determined, it also includes any contributions from IDL-C and Lp(a)-C.
Electrophoresis
The lipoproteins in the two ultracentrifugal fractions are next examined qualitatively by electrophoresis, usually in agarose gels. Unfractionated plasma is included in a contiguous lane, each specimen serving as its own control (Fig. 2.2).
LDL migrates with beta mobility, VLDL with pre-β mobility, and HDL with α mobility (Fig. 2.3). Chylomicrons, if present, remain at the origin. The top fraction from normal plasma contains only VLDL. The bottom fraction contains LDL and HDL, along with Lp(a), if it is present in sufficient concentration to be visible. Lp(a) migrates with pre-β mobility.
β-VLDL results from the presence of chylomicron and VLDL remnants that accumulate in the circulation because their clearance by the liver is impaired. When present, it is visible in the top fraction, generally as a broad band extending from the β to pre-β region, although it can also appear as a band with more distinct beta mobility. Recall that β-VLDL is enriched in cholesterol compared with normal VLDL. The ratio of VLDL-C to plasma TG exceeds 0.3 in the type III patient, compared with ≤0.2 for normal VLDL. The presence of β-VLDL in the top fraction, and a VLDL-C:TG ratio ≥0.3 defines type III hyperlipoproteinemia. The pattern persists even in the treated type III patient, and beta quantification is necessary whenever an accurate LDL-C measurement is required.
Beta quantification has never been widely available in routine clinical laboratories because of the technical skill, specialized equipment, and time required for the test. Such analyses were generally referred to commercial lipoprotein laboratories, or those operating in conjunction with specialized lipid clinics. Today, even many lipid clinics have stopped requesting beta quantification and rely instead on a pharmacologic approach to distinguish between type III and familial combined hyperlipidemia (FCHL), a disorder in which TC and TG are also elevated. A patient with elevated TC and TG is treated with a fibrate. In a type III patient, the fibrate dramatically lowers both TC and TG, and LDL-C, which is not elevated in type III, remains low or normal. On the other hand, fibrates lower TG markedly, but increase LDL-C in a patient with FCHL. The diagnosis of type III is further supported if the patient manifests the typical physical signs of type III such as palmar planar xanthomas, and tuberoeruptive xanthomas, signs that are absent in FCHL (see also Chapters 7 and 16). ApoE2, an isoform of apoE, occurs in the homozygous state (apoE2/E2) in about 1:100 individuals in the general population, and about 1% of these exhibit overt type III hyperlipoproteinemia. Furthermore, most individuals exhibiting type III are homozygous for apoE2.
FIGURE 2.2 Graphic representation of agarose gel electrophoresis of plasma. (Left lanes) Unfractionated plasma; (middle and right lanes) ultracentrifugal top and bottom fractions. (A) Normal plasma. (B) Type III hyperlipoproteinemia. β-VLDL can appear in both unfractionated plasma and the top fraction as a discrete band with LDL mobility, as shown, or as a broad band spanning the LDL-VLDL region. LDL, low-density lipoproteins; VLDL, very low-density lipoproteins; HDL, high-density lipoproteins; beta VLDL, β very-low-density-lipoproteins; Lp(a), Lp(a) lipoprotein.
It should be pointed out that while the pharmacologic approach serves to differentiate type III from FCHL, type III hyperlipoproteinemia itself is still defined in terms of the presence of β-VLDL and cholesterol-enriched lipoproteins of d < 1.006 g/mL. In practice, however, the pharmacologic approach is very useful because the effect of fibrates is so striking (see Chapters 7 and 16).
The Friedewald Method
The Friedewald (1) method is one of the best characterized and widely used lipoprotein methods for clinical purposes and is also often used in epidemiologic, pharmacologic, and clinical research. This method is used to screen for dyslipidemia and for follow-up measurements once the nature of the dyslipoproteinemia has been defined. It should be accompanied by a standing plasma test to evaluate the presence of chylomicrons (see the following text).
Like beta quantification, the Friedewald method assumes that TC is the sum of cholesterol in the three major lipoprotein classes (see Eq. 1). TC and HDL-C are measured directly. VLDL-C is calculated as [TG]/5, when the lipid concentrations are expressed in mg/dL, or [TG]/2.3, when concentrations are expressed in mmoles/L.
Equation 1 can be rearranged to the usual form of the Friedewald equation:
In the absence of chylomicrons or β-VLDL, the Friedewald equation gives fairly accurate LDL-C values at TG concentrations up to about 400 mg/dL. From time to time, other ratios of TG/5 in particular populations have been proposed to provide the best correspondence with beta quantification. After examining the question in detail, however, the National Cholesterol Education Program (NCEP) Lipoprotein Measurement Working Group recommended that the original factor TG/5 was best overall (2).
The proper use of the Friedewald method requires an appreciation of its limitations. It cannot be used when chylomicrons are present, when TG > 400 mg/dL, or when β-VLDL is present. Beta quantification should be used in these cases. The reasons for this are as follows.
When TG exceeds 400 mg/dL, the ratio of plasma TG:VLDL-C can be significantly >5, either because VLDL is more enriched in TG, chylomicrons are present, or both. Under these conditions, the ratio of plasma TG:VLDL-C in the TG-rich lipoproteins can be 10 or higher. The factor TG/5 will overestimate VLDL-C and therefore underestimate LDL-C.
Note that the presence of chylomicrons can also lead to an underestimate of LDL-C when TG are below 400 mg/dL, and the chylomicrons account for a significant proportion of the TG present. For example, consider a case in which TG is 300 mg/dL but chylomicrons account for two-thirds of this. Without knowing that chylomicrons were present, the ratio TG/5 would suggest a VLDL-C concentration of 60 mg/dL. However, the actual VLDL-C concentration would be about 20 mg/dL. Use of the Friedewald equation under these conditions would underestimate LDL-C by 40 mg/dL. It is for this reason that a standing plasma test should accompany an LDL-C estimated by the Friedewald equation.
The opposite error occurs in specimens from type III patients. Since β-VLDL is cholesterol enriched, the factor TG/5 again does not apply, in this case because it would underestimate the VLDL-C, and give a falsely high value for LDL-C. The patient would therefore appear to have a high LDL-C concentration and the type III pattern would be missed altogether. The misdiagnosis is to be avoided because the medical management of type III differs from that of elevated LDL-C.
Despite these limitations, the Friedewald equation can be used in most people. First, few people have TG concentrations exceeding 400 mg/dL because the 95th percentile for TG in the United States is about 300 mg/dL or less (3) (see also Chapter 1). Second, the prevalence of type III hyperlipoproteinemia is only about 3 per 1,000 in the population (4), and others have provided estimates of 1 per 1,000 or less (5). The Friedewald equation can therefore be used reliably in over 95% of the population. It is prudent, however, to rule out type III hyperlipoproteinemia because while uncommon, it is by no means rare. Assuming a U.S. population of about 350 million, 300 million of whom are adults, this disorder might affect 150,000 to 900,000 individuals in the United States alone.
Direct LDL
Over the past decade, methods have become available to measure LDL-C directly without removing the other lipoproteins. These methods are fast and readily automated.
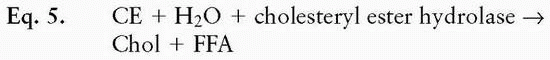
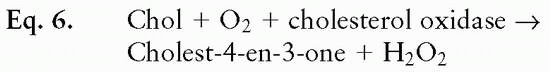
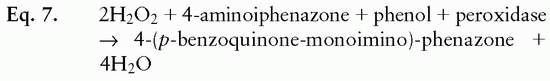
Two general approaches have been used to ensure the analyses are specific for LDL-C. Both use surfactants to shield one or more of the lipoproteins so that LDL-C can be measured specifically. All of the direct LDL methods use cholesteryl esterase to hydrolyze CE, and cholesterol oxidase to oxidize the 3-OH group of cholesterol to cholestenone. The H2O2 produced is used to quantitate cholesterol colorimetrically as described for TC analysis (see the following text).
In one commonly used method, HDL-C is blocked with α-cyclodextrin, and chylomicrons and VLDL with the polymer polyoxyethylene-polyoxypropylene. The surfactants prevent the enzymes in the cholesterol reagent from gaining access to these lipoproteins. Thus, only the cholesterol in LDL is available to react.
Other methods use the opposite approach. Surfactants are added to block LDL. Cholesterol associated with the other lipoproteins is free to react. The H2O2 produced from non-LDL cholesterol is first removed enzymatically. Another detergent is then added to disrupt the surfactant-LDL complex, and the newly accessible LDL-C is measured colorimetrically.
In earlier years when chemical precipitation methods were being developed for lipoprotein measurement, it became evident that the more dissimilar the lipoproteins were, the more easily they could be separated from each other. Chemical precipitation methods were most successfully applied to measure HDL-C because they precipitated essentially all the apoB-containing lipoproteins, but left HDL in solution. They were not very satisfactory for separating VLDL (and chylomicrons, if present) from LDL because they were not sufficiently specific for either.
These concerns apply to the direct LDL methods also. Recall that beta quantification and the Friedewald method both include IDL, Lp(a), and LDL in the LDL-C measurement. As a group, however, the direct LDL-C methods appear to include only half or less of the IDL and do not completely exclude VLDL. Some of the direct LDL-C methods apparently include only about half the Lp(a) (6), and some are subject to positive or negative bias when TG are elevated. Overall, the direct LDL-C methods tend to display negative biases (6,7,8) and can misclassify patients with LDL-C concentrations in the 130 to 160 mg/dL concentration range. Finally, the direct LDL methods apparently do not exclude β-VLDL, inasmuch as they overestimate LDL-C in patients with type III hyperlipoproteinemia.
TC, TG, and HDL-C Measurement
Cholesterol and TG
Prior to the 1980s, TC and TG were measured with chemical methods. The most accurate methods required extracting lipids from plasma with an organic solvent, and treating the extract to remove PL and glucose, which would otherwise interfere with TG methods. TG were hydrolyzed and the glycerol released was measured using colorimetric or fluorometric methods. TC was analyzed colorimetrically with or without preliminary hydrolysis of CE.
It should be noted that the fatty acyl group of CE is not unique. Any of several fatty acids can be bound to a particular cholesterol molecule. The preliminary removal of the fatty acyl group allows cholesterol to be analyzed using pure cholesterol as the primary standard, or a secondary standard whose cholesterol concentration is referable to the primary standard. In other words, cholesterol itself serves as the accuracy base for cholesterol measurements.
The situation for TG is a little more complicated because TG as they occur in vivo contain fatty acyl residues of various lengths, mostly in the range of 16 to 20 carbon atoms. The three fatty acyl groups can differ in any particular TG molecule, and the particular fatty acyl residues present are influenced by diet, and therefore can change within an individual as diet is altered. What we call “plasma TG” is mixture of different TG, and TG standards do not reflect the actual TG compositions of particular clinical specimens. Instead, a single TG, triolein, a liquid at room temperature and the main fat in olive oil, was selected as the generally agreed upon primary standard for clinical TG measurements. TG assayed using triolein as the standard will differ a little from a direct gravimetric analysis of the TG mixture isolated from a particular plasma specimen. Most clinical methods actually measure glycerol released after TG are hydrolyzed (see the following text). Therefore, when TG concentration is expressed in mmoles/L, its fatty acid composition does not influence the results. But even when expressed in mg/dL, as is common in the United States, the difference will be small and clinically insignificant.
Fully enzymatic methods for measurement of TC and TG were developed in the 1980s and 1990s, and within the next decade completely replaced chemical methods for most purposes. The reactions for a commonly used enzymatic cholesterol reagent are as follows:
Only gold members can continue reading. Log In or Register to continue

 Disorders of Hypertriglyceridemia


