The SI unit for absorbed dose is joule per kilogram (J kg−1) and its special name is gray (Gy) [11]. In nuclear medicine
 represents the number of radionuclide disintegrations in a particular volume multiplied by the energy emitted per disintegration of the radionuclide and multiplied by the fraction of emitted energy that is absorbed by a particular (target) mass.
The concept of absorbed dose is only applicable in a macroscopic scale as it is generally done in nuclear medicine dosimetry. In “macrodosimetry,” one considers mean parameters (mean doses). It should be noted that the mean absorbed dose can be calculated for a large (i.e., organ) volume or at the microscopic level, as long as the criteria applicable to macrodosimetry are met. The energy deposition, however, is a stochastic process and shows inherent statistical fluctuations. If particle flux – and energy deposition – is large enough, then the mean absorbed dose is relevant as the standard deviation due to stochastic fluctuations is small.
9.2.1.2 Effective Dose (E)
For a risk assessment of medical diagnostic procedures involving ionizing radiation and radiation protection, the concept of the effective dose (E) has been widely adapted [11, 12]. The risk associated with the effective dose is based on assumptions such as the concept of considering the risk to the general public or to workers. This does not necessarily reflect the situation for patients in nuclear medicine as, particularly in patients with cancer, the life expectancy is likely to be different of that of the general public or of workers. Another aspect is the strong age and sex dependency of the radiation risk, which is not included in the effective dose. Therefore, the effective dose should not be used for individual risk-benefit assessments in patients; instead, the relevant quantity is the equivalent dose or the absorbed dose to irradiated organs. E is defined as
 ω T is the tissue weighting factor for the tissue T and represents the radiation sensitivity for stochastic radiation damage of each tissue considered. The sum over all tissue weighting factors is 1:
  = 1. H T is the organ dose (unit: Sv) caused by internal or external exposure. For nuclear medicine applications using beta and gamma emitters, the organ doses are calculated by multiplying the absorbed dose (unit: Gy) by the radiation weighting factor for photons and electrons (=1 Sv/Gy). According to ICRP103 [11], the effective dose E is then the arithmetic mean of the gender-specific organ doses
  (male) and
  (female):
 Table 9.1 summarizes the tissue weighting factors according to ICRP103.

 = 1. H T is the organ dose (unit: Sv) caused by internal or external exposure. For nuclear medicine applications using beta and gamma emitters, the organ doses are calculated by multiplying the absorbed dose (unit: Gy) by the radiation weighting factor for photons and electrons (=1 Sv/Gy). According to ICRP103 [11], the effective dose E is then the arithmetic mean of the gender-specific organ doses
  (male) and
  (female):
Tissue | ωT | ΣT ωT |
|---|---|---|
Bone marrow (red), colon, lung, stomach, breast, remainder tissuesa | 0.12 | 0.72 |
Gonads | 0.08 | 0.08 |
Bladder, esophagus, liver, thyroid | 0.04 | 0.16 |
Bone surface, brain, salivary glands, skin | 0.01 | 0.04 |
Total | 1.00 |
The term effective dose is, according to ICRP103 [11], only a protection quantity which provides a dose value that is related to the probability of health detriment to a reference person due to stochastic effects from exposure to low doses of ionizing radiation [11–13] and should not be used for an individual risk analysis. For comparing both different diagnostic procedures and similar procedures in different hospitals and countries, the effective dose can be very useful. Furthermore, it is a good quantity to compare the use of different technologies for the same medical examination. But one has to consider that this only holds for patient populations with the same age and sex distribution [11].
9.2.2 Dosimetry in Nuclear Medicine
Methods for calculating the absorbed dose from administration of a radiopharmaceutical were first standardized in the 1960s by the Medical Internal Radiation Dosimetry (MIRD) committee, with the initial aim of estimating average doses to critical organs resulting from diagnostic procedures [14]. Essentially this methodology allows the calculation of absorbed dose using the simplified version of the basic equation [15]:


 : : | the mean absorbed dose to a target region r k from the cumulated activity in source region r h . |
à h : | the cumulated activity (i.e., the integral of the activity-time curve from zero to infinity) in a given target region r h . |
 : : | the radionuclide-specific S factor for target region r k and source region r h per unit cumulated activity in source region r h . |
à denotes the total number of radioactive decays occurring within an organ in which a radiopharmaceutical accumulates (the “source organ”). The MIRD S factor accounts for the energy released from each radioactive decay and the relative geometry of the source organ and the organ for which the absorbed dose is to be calculated. Thus, the cumulated activity is dependent on biological parameters, while the S factor deals with the physical components of the absorbed dose.
There is no assumption made concerning the source or target, other than that the radioactive distribution is homogeneous in the source h: the source and target can be of any size or composition. Theoretically, if the activity in the source is heterogeneously distributed, it is possible to subdivide the source into smaller volumes in which the activity can be considered homogeneous.
For determining Ã, quantitative imaging of the biokinetics of the administered radiolabeled substance is a prerequisite followed by absorbed dose calculation. This comprises the following steps [16, 17]:
- 1.
The percentage of administered activity of the radiopharmaceutical must be determined for the accumulating organs. This step mainly requires the implementation of quantitative imaging procedures and/or blood sampling. The established method for quantitative imaging for dosimetry relies on the measurement of the biokinetics by serial gamma-camera scans, if possible, including SPECT/CT and/or PET/CT to increase dosimetric accuracy. The quantitative accuracy depends on these different settings and needs to be carefully checked. If organ or lesion dosimetry is performed, precise determination of organ/lesion volumes is necessary, as the use of standard organ volumes may be severely incorrect leading to serious under- or overdosing in targeted radiotherapy. Dosimetry based on quantitative 3-dimensional data is more accurate, provided that all effects that degrade the quantitative content of the images have been corrected for, and allows a more individualized dosing approach. In addition, inhomogeneous organ accumulation of the radionuclide can be detected and possibly taken into account. Blood samples can be measured easily using a calibrated well counter in order to provide time-activity curves for the disappearance of the radiolabeled pharmaceutical from the blood. These measurements can be performed either pre-therapeutically for assessing the activity to be administered or post-therapeutically for verification of the absorbed doses.
- 2.
The previous step needs to be repeated at different time points in order to assess the pharmacokinetics of the radiopharmaceutical. This requires the determination of a correct temporal sampling and the use of ad hoc procedures to integrate the activity over time to obtain the total number of decays occurring in the source organs or the residence times. A proposal for choosing optimal time points is provided by MIRD pamphlet 16 [18] and for obtaining optimized fit procedures for nuclear medicine by Kletting et al. [19].
As the cumulated activity constitutes the sum of all radioactive emissions during the time considered, the energy deposition rate with time is not taken into account, although the absorbed dose rate (Gy s−1) is known to impact on the biological consequences of the irradiation. The relevance of this is indicated by the fact that the aim of most dosimetric studies is to relate a physical parameter (i.e., energy absorbed per unit mass) to the observed biological effect: the relation between these two parameters may not be simple, and scientifically sound dosimetric protocols are simply a prerequisite for subsequent radiobiological studies.
Radionuclide S-values for all combinations of source and target tissues, as needed for internal dosimetry in diagnostic nuclear medicine, should be based upon internationally accepted reference anatomic phantoms as defined by the International Commission on Radiological Protection [20]. In this way, organ dose estimates may be harmonized across all imaging modalities for the purpose of quantifying stochastic risk.
In therapeutic applications, the absorbed doses of critical organs must be determined. This is usually obtained for an anthropomorphic computational model using adequate knowledge about radiation transport. A variety of methods exists for the calculation of the absorbed doses. As a basis for the calculation of absorbed doses, the number of decays per administered activity must be determined. This can be done for whole body only, for each accumulating organ, for each voxel, or even on a cellular level. Different dose calculation approaches exist, and these may be based on absorbed dose rates per unit activity (with mass correction) of anthropomorphic phantoms, convolution kernels, or on Monte Carlo simulations [21]. Figure 9.1 shows, in a schematic drawing, a flowchart denoting the single steps needed for dosimetry.
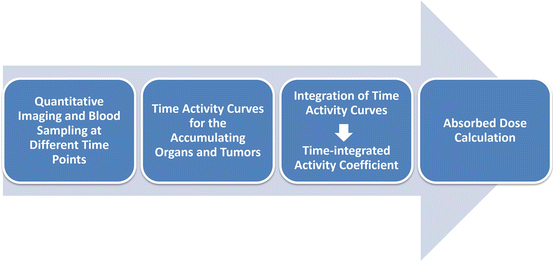

Fig. 9.1
Dosimetry flowchart
9.2.3 Radiobiology
9.2.3.1 Linear Quadratic Model and Biological Effective Dose
During internal or external irradiation, patients are exposed to ionizing radiation, which does not only destroy the malignant cells but also damages healthy tissue and cells. This is mainly caused by direct and indirect interaction of the radiation with the DNA which damages the DNA structure. Most frequently, there are single-strand breaks and base damages. DNA double-strand breaks (DSBs) are rare; nevertheless, they are the most critical lesions for cells as repairing the damage is difficult. Unrepaired or misrepaired DNA could cause mutations and chromosomal aberrations or lead to cell death.
It is assumed that there are two different ways of producing a DSB [22]:
Type A damage: adjacent DNA strands are broken by a single ionizing event.
Type B damage: two different ionizing events destroy adjacent DNA strands. They can be considered as two individual single-strand breaks and are therefore assumed as potentially repairable because the first single-strand break could be repaired before the second occurs. They are also called sublethal damages. This effect depends on the dose rate.
During radionuclide therapy, the radioactive decay of the nuclide and its biokinetics cause the dose rate to be time dependent and decreasing. The influence of the time dependence of the dose rate on the biological effects should, therefore, not be neglected. An important point is the influence of repair mechanisms taking place during the continuous irradiation.
The survival of cells after irradiation is usually expressed by survival curves, which are represented by the linear quadratic model (LQ)
 Whereas F S is the survival fraction of the cells, D is the absorbed dose, and α and β are tissue-specific cell parameters.

It is assumed that the first part of the equation describes the type A damage because those are linearly increasing with the absorbed dose and, therefore, the cell survival decreases with increasing absorbed dose. The second part represents the type B damage, which increases quadratically with the absorbed dose [23].
During internal irradiation in nuclear medicine, the cells and organs not only are irradiated for seconds or minutes but are continuously irradiated over a longer period with permanently changing dose rate. This is in contrast to external irradiation, for example, in radiotherapy. This fact potentially alters the impact of the ionizing radiation, although the same absorbed dose is delivered. Therefore, the sparing effect in nuclear medicine already occurs during the therapy.
To compare therapies with different dose rates and fractionation, the concept of the biological effective dose (BED) is used [22, 24]:
 RE(D) defines the relative effectiveness and has to be modified for nuclear medicine by a factor G which takes the repair of sublethal damage taking place during the therapy into account:
 with
with
 and
and
 while λ is the effective decay rate of the nuclide from the organ of question, T 1/2 is the effective half-life and μ is the damage recovery constant.


For more than one therapy cycle, the BEDs can be summed, if one assumes that there is no activity left and the sublethal damage is repaired.
With those formulas, the adjusted linear quadratic model for nuclear medicine treatments is written as
 F s describes the surviving fraction of the cells as a function of the absorbed dose D. The alpha/beta ratios are individual parameters for each organ, tumors, and healthy tissue.

How this concept can be applied to kidney dosimetry in PRRTs with 90Y-labeled compounds is illustrated in Fig. 9.2. Data for the kidney alpha/beta ratios, the repair half-life, and the effective half-life were taken from MIRD pamphlet 20 [25]. The dotted lines denote the intersection of a BED of 40 Gy and an absorbed dose to the kidney of 33 Gy for 4 therapy cycles. This graph shows that the normally accepted tolerance dose of healthy kidneys (23 Gy [26]) can be exceeded if the therapy is fractionated. It also shows that increasing the number of cycles to more than four does not lead to a substantial increase in the tolerance dose.
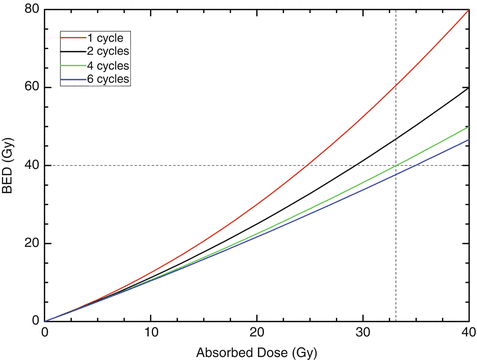

Fig. 9.2
BED as a function of the absorbed dose for healthy kidneys after PRRTs with 90Y-labeled compounds. The fractionation schemes were one cycle (red), two cycles (black), four cycles (green), and six cycles (blue). The dotted lines denote, for four therapy cycles, the intersection of a BED of 40 Gy and an absorbed dose to the kidney of 33 Gy
9.2.3.2 Biodosimetry
Specific biomarkers representing DSBs also provide additional information after irradiation. Well-known biomarkers used for this purpose are γ-H2AX and 53BP1.
The formation of a DNA DSB in nuclear chromatin results in the rapid phosphorylation of the histone H2 variant H2AX, which then called γ-H2AX. Furthermore, DSBs also recruit the damage sensor 53BP1 to the chromatin surrounding the DSBs, which leads to 53BP1 and γ-H2AX co-localization in the chromatin surrounding a DSB. By immunofluorescence staining with γ-H2AX and 53BP1 antibodies, those biomarkers can be addressed by microscopically visible DNA damage protein foci; this is also known as the DNA damage focus assay [27–29].
For PRRT, there are two studies that addressed the absorbed dose to the blood and the number and temporal behavior of radiation-induced DNA double-strand breaks in peripheral blood samples [28, 30]. Only the study by Eberlein et al. [28] could establish, for the first time, a linear correlation between the average numbers of radiation-induced foci per cell (RIF/cell) and the absorbed dose to the blood up to 5 h after 177Lu administration. Thereafter, the number of RIF/cell is no longer linearly dependent on the absorbed dose. The time- and dose-dependent increase and decay of the number of RIF/cell could best be described by a linear increase and an exponential decay.
Figure 9.3 illustrates this finding for one of the study patients (after administration of 7.9 GBq 177Lu-DOTATATE). There is a linear increase of the foci number up to 5 h as a function of the absorbed dose to the blood (left panel); the later time points are characterized by a decreasing number of radiation-induced foci which is in accordance with the progression of DNA repair and the declining dose rates (right panel, solid line). 120 h after therapy, the number of RIF/cell are almost back to the pretreatment level.
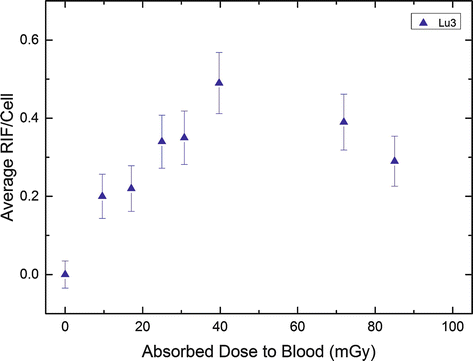

Fig. 9.3
Average RIF per cell in lymphocytes after PRRT as a function of the absorbed dose to the blood in an example patient (Lu3). The blood sampling times were 0, 0.6, 1.1, 1.7, 2.3, 3.6, 24.1, and 44.7 h. The graph was taken from the work of Eberlein et al. [28] (Copyright with the authors)
In the future, mores studies like this will help us better understanding the biological effects of nuclear medicine therapies.
9.3 Applications
9.3.1 Diagnostic Procedures
Two papers by Eberlein et al. [1] and by Machado et al. [31] summarize the most recent data on dosimetry for 68Ga-labeled compounds. For 111In-octreotate, the data are taken from the review on the dosimetry of diagnostic compounds by Eberlein et al. [32]. The results are compiled in Table 9.2.
Table 9.2


Effective dose coefficients (mSv/MBq)
Stay updated, free articles. Join our Telegram channel

Full access? Get Clinical Tree


