Chapter Outline
Comparative Genomic Hybridization
Single Nucleotide Polymorphism Arrays
Chromatin Immunoprecipitation, ChIP-Chip, ChIP-Seq
Genome-Wide Association Studies
Exome Sequencing/Targeted Sequencing
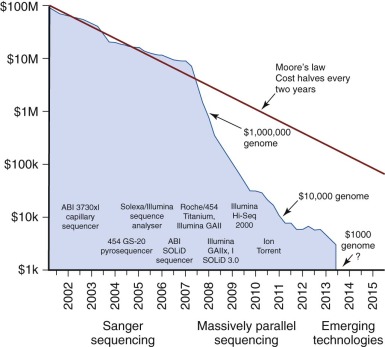
The first genome to be sequenced came at a cost of $100 million. Only 13 years later, the price for sequencing an entire genome is nearing $1000 ( Fig. 41-1 ). Rapid increases in the speed and complexity of genomic sequencing technologies, coupled with dramatically decreasing costs, have created an overwhelming array of platforms, methods, and informatics analysis algorithms. In many publications the authors assume the reader is facile with the platform used in the study described, yet most clinicians and researchers have a limited or narrow knowledge of the wide range of methods capable of describing the genomic or proteomic content of a biologic sample. This chapter focuses on describing the basic framework with which to understand most of the common platforms in use today.
Genomic platforms can be classified in many ways, and one can consider the starting material (e.g., deoxyribonucleic acid [DNA], ribonucleic acid [RNA], proteins, and small molecules) or the questions being asked (e.g., copy number, mutations, loss of heterozygosity [LOH], transcript expression, and methylation). The classification scheme shown in Table 41-1 classifies each platform according to the underlying structure, and the remainder of this chapter is organized in this fashion.
| Underlying Structure | “-omics” | Alterations in Disease | Technologies |
|---|---|---|---|
| DNA | Genome | Point mutations | Capillary (Sanger) sequencing Pyrosequencing Genotyping Targeted-sequencing/WES RNA-seq |
| Copy number gains or losses | FISH Array CGH SNP array Targeted-sequencing/WES WGS | ||
| Rearrangements/fusion genes | Karyotyping FISH WGS RNA-seq | ||
| Pathogenic sequences | PCR Microbial arrays WGS RNA-seq | ||
| Epigenome | DNA methylation Histone modifications | Bisulfite sequencing Methyl-specific PCR ChIP-seq | |
| mRNA | Transcriptome | Altered transcript expression Altered allele-specific expression Differential alternative splicing | Microarrays RNA-seq |
| microRNA | Epigenome | Altered transcriptional control | Microarrays |
| Proteins | Proteome | Mutated or deleted proteins Altered posttranslational modification Increased or decreased regulation | Microarrays Mass spectrometry |
| Small molecules | Metabolome | Modulations in small molecules | Mass spectrometry NMR spectroscopy |
DNA-Based Methods
Most of the time the goal of studying DNA is to learn about the genes encoded, including mutations, rearrangements, and changes in copy number. Low-resolution methods prevailed for years as the standard way of understanding copy number variations and rearrangements (e.g., karyotyping and fluorescent in situ hybridization [FISH]), and low-throughput techniques were required to evaluate point mutations and pathogenic sequences (e.g., capillary sequencing, pyrosequencing, polymerase chain reaction [PCR], and microbial arrays). The emergence of high-throughput, high-resolution techniques has revolutionized the study of the genome.
Comparative Genomic Hybridization
Until the development of comparative genomic hybridization (CGH), chromosomal or subchromosomal gains and losses were discovered though Giemsa banding (“karyotyping”) or FISH. Although similar in resolution to these techniques (5 to 10 megabases ), CGH can be used in an unbiased and agnostic way to detect unbalanced chromosomal abnormalities by competitive FISH using different fluorophores for two different isolates of DNA (e.g., test and control). The technique was also novel because it did not require cells to be undergoing active cellular division. With the popularization of DNA microarrays, a higher resolution technique was developed: array CGH (aCGH). As is common to all microarray techniques, probes (oligonucleotides) are deposited onto a solid support (glass slide), with the resolution dependent on the size of the probes and the genomic distance separating them. DNA from a test sample and control are extracted, labeled with different fluorescent dyes, and applied to the probes ( Fig. 41-2 ). Complementary strands will bind and can be visualized with use of a digital imaging system to quantify the relative amounts of each target bound. The ratio of test to control for each DNA region can then be used to determine copy number variation throughout the genome. Compared with prior methods, aCGH can detect copy number changes at any locus, as long as it is represented in the array. The technique has been productively applied to the study of thousands of diseases and complex traits, and despite the emergence of newer high-resolution methods, aCGH continues to be a significant platform for the study of copy numbers.

Genotyping
Genotyping is simply determining the genetic variation in an individual. Many methods may be used to perform genotyping with varying degrees of throughput. Restriction fragment length polymorphism analysis was productively applied to describe human leukocyte antigen polymorphisms, followed by PCR-based methods using membrane- or bead-bound sequence-specific oligonucleotide probes and sequence-specific priming (reviewed in references and ). For the specific application of identifying a point mutation or allelic variant, genotyping via PCR followed by restriction digestion is a simple approach that has been applied to many diseases and conditions, including fatty acid binding protein mutations in insulin resistance and identification of polymorphisms in thiopurine methyltransferase in leukemia and methylenetetrahydrofolate reductase in childhood acute leukemia.
Capillary (Sanger) Sequencing
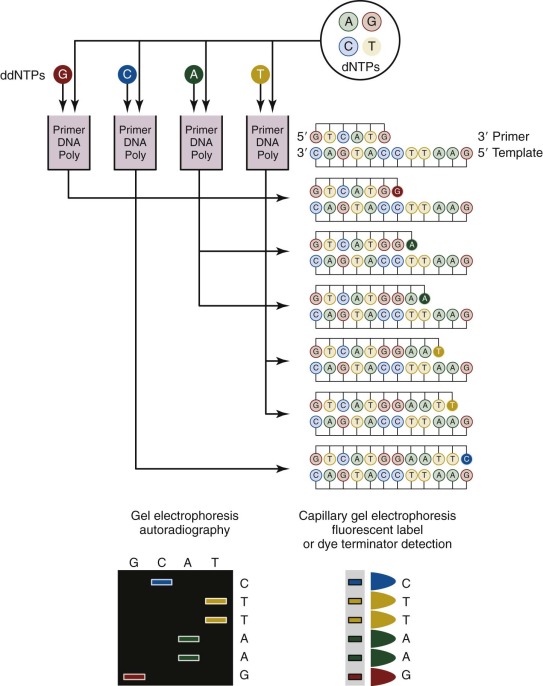
Sanger sequencing, which was first developed in 1977, has been routinely used for more than 25 years for genomic studies. In the classic method ( Fig. 41-3 ), chain-terminating nucleotides are incorporated by DNA polymerase during DNA replication with a synthesized primer specific to the region of interest. Compared with normal deoxynucleoside triphosphates, terminating dideoxynucleoside triphosphates lack a 3′-hydroxyl group, and DNA polymerase is unable to create the phosphodiester bond between two nucleotides, thus halting transcription. Four DNA replication samples are prepared, each with a different radiolabeled or fluorescently tagged dideoxynucleoside triphosphate, and the resulting DNA products are separated by electrophoresis and visualized by autoradiography or ultraviolet light. Current instruments use dye terminators instead of fluorescent labels, resulting in faster and more accurate readings. The relatively high cost for reagents and the nonautomated nature of traditional Sanger sequencing have been largely obviated by the development of microfluidic technology. All of the steps for Sanger sequencing are carried out on a small chip using nanoliter volumes. This “lab-on-a-chip” or “sequencing-on-a-chip” technique increases speed and accuracy while decreasing costs. Despite limited resolving power for the first 25 to 50 bases and read lengths fewer than 1000 bases, Sanger sequencing is still being used for smaller scale projects or when a long contiguous read is desired.
Pyrosequencing
In pyrosequencing, liberated pyrophosphates from nucleotide incorporation are detected and the DNA sequence is determined by light emitted upon nucleotide incorporation. Because only one nucleotide at a time is presented to the DNA template and DNA polymerase, the base responsible for the emitted light is the one incorporated into the growing strand. The pyrophosphate release during the reaction is converted to adenosine triphosphate, fueling a luciferase-based fluorescent reaction. Although the reads are shorter (300 to 500 base pair [bp]), multiple reactions can be detected simultaneously, thereby increasing throughput.
DNA Microarrays
A microarray is simply a small piece of DNA (the “probe”) that is attached to a solid support, which is usually a glass, plastic, or silicon chip (e.g., an Affymetrix [Santa Clara, CA] genome chip, gene array, or DNA chip) or polystyrene beads (Illumina, San Diego, CA). The process of “printing” the array refers to the deposition of the DNA onto the solid support, either through “spotting” (complementary DNA [cDNA] microarray ) or by synthesizing the oligonucleotides directly onto the array surface. For a spotted array, the probes are produced beforehand, either through the production of a cDNA library, by PCR, or by the generation of oligonucleotides that are then “spotted” directly onto the support surface, often by a robot.
Single Nucleotide Polymorphism Arrays
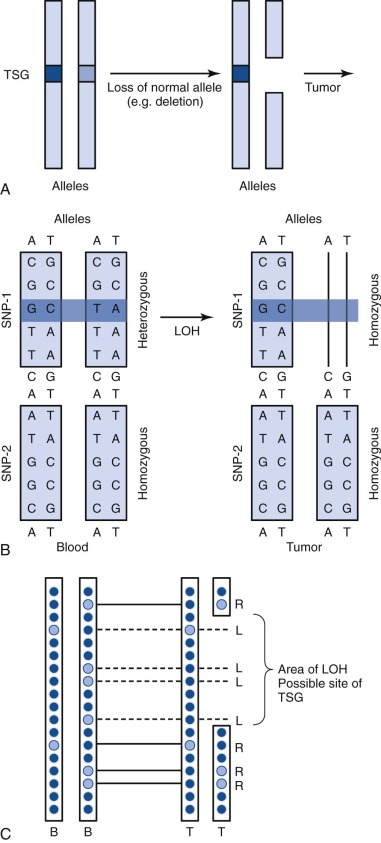
A single nucleotide polymorphism (SNP) is any sequence variation in the genome for which both alleles occur at a relatively high frequency. The vast majority do not appear to confer functional consequences. Although they are located most often in noncoding regions, SNPs can occur anywhere throughout the genome. More than 50 million SNPs have been cataloged in the SNP database. High-density SNP arrays can be used for genetic linkage studies to map disease loci and complex traits. Because SNP arrays can detect slight differences between individual genomes, the polymorphisms detected can be used to characterize disease susceptibility or drug effectiveness. A comparison of intensities of DNA-bound SNP probes can be used to determine the relative DNA copy number for a given locus based on the SNP map. A specific application of SNP arrays is in detection of LOH in tumors and other malignancies ( Fig. 41-4 ). When examining paired blood and tumor samples, SNPs detected as heterozygous in blood and homozygous in tumor (LOH) may be part of a region where a normal copy of a tumor suppressor gene was lost. A special case of LOH called uniparental disomy is a copy-neutral gene conversion. Instead of a deletion leading to the loss of the normal allele, a nondisjunction event results in LOH without a change in copy number. Although undetectable by FISH or karyotyping, this important type of LOH can be inferred from an SNP virtual karyotype.
Chromatin Immunoprecipitation, ChIP-Chip, ChIP-Seq
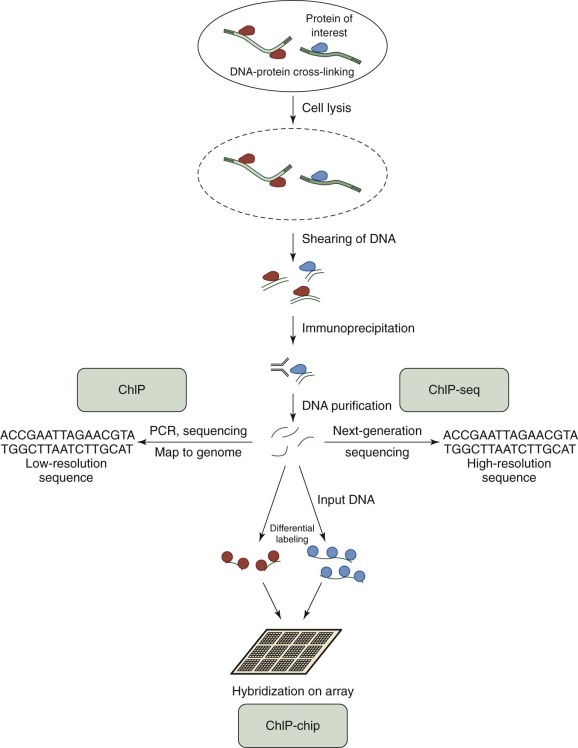
Chromatin immunoprecipitation (ChIP) is used to investigate the interaction between proteins and DNA. In addition to defining the locations of transcription factor binding, ChIP can also aid in determining the location of histone modifications. The basic concepts for all ChIP studies are similar ( Fig. 41-5 ). Proteins are cross-linked to DNA, and the cell is lysed. The protein-bound DNA is sheared, and immunoprecipitation is used to “pull down” the protein-bound DNA regions of interest. The DNA is then isolated and purified, and different techniques are used to determine the sequence and region of DNA bound by the protein. In standard ChIP, low-resolution, traditional sequencing methods or PCR are used, followed by genome mapping. ChIP has been productively applied to study histone binding, histone acetylation, and cell differentiation in myeloid leukemia cells. To increase the coverage and depth of DNA binding site discovery, the analysis of protein-bound DNA was extended to DNA microarrays (“ChIP-chip” or “ChIP-on-chip”). This technique has been applied to describe histone binding patterns, identify therapeutic targets in persons with acute myelogenous leukemia, and describe and map transcriptional networks and histone modifications in leukemia. With the development and popularization of next-generation sequencing (NGS) techniques, the products of ChIP can be subjected to high-resolution sequencing (“ChIP-seq”). This technique has been used to describe a genome-wide map of chromatin binding in stem cells, delineate histone phosphorylation, identify transcription factor binding sites, demonstrate the requirement of histone ligase in mixed-lineage leukemia–rearranged leukemia, describe transcriptional networks, and provide overall maps of chromatin binding and histone modifications in leukemia.
Genome-Wide Association Studies
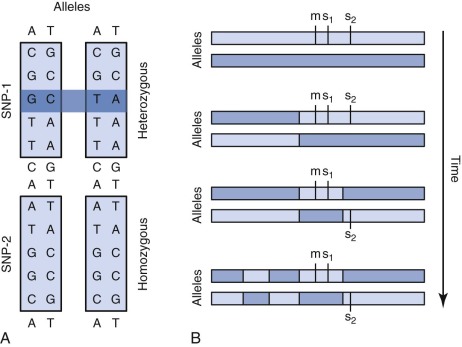
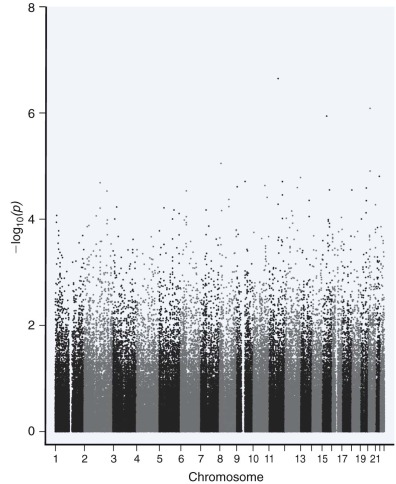
The purpose of a genome-wide association study (GWAS) is typically to compare two groups (e.g., cases/control) to find common genetic variants associated with either group. As a by-product of sequencing the human genome, the discovery of large numbers of SNP variants facilitated an unbiased interrogation of the genome. Useful SNPs must be selectively neutral and have relatively high frequencies (generally >0.05). More than 1 million SNPs were collected for the HapMap project, capturing most of the genomic variation in a select number of human populations. GWA studies are only dependent on linkage disequilibrium between the genotyped SNP and the nongenotyped causal variants, with the strength of the association depending on their allele frequencies ( Fig. 41-6 ). Hundreds of loci have been discovered for many complex diseases and traits such as Crohn disease, ulcerative colitis, and short stature. Metabolic traits, autoimmune diseases, cancer, and many complex traits have been studied extensively and with large sample sizes by GWA studies. Data from a GWA study are typically visualized with use of a Manhattan plot ( Fig. 41-7 ). Much of the statistical analysis of GWA study data focuses on determining the significance threshold given the sample size and the large number of features (multiple testing).
Exome Sequencing/Targeted Sequencing
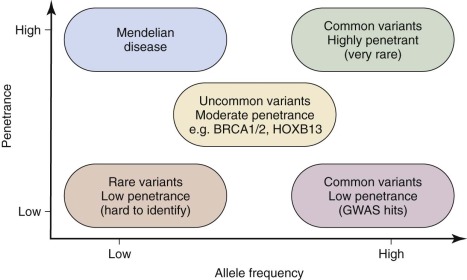
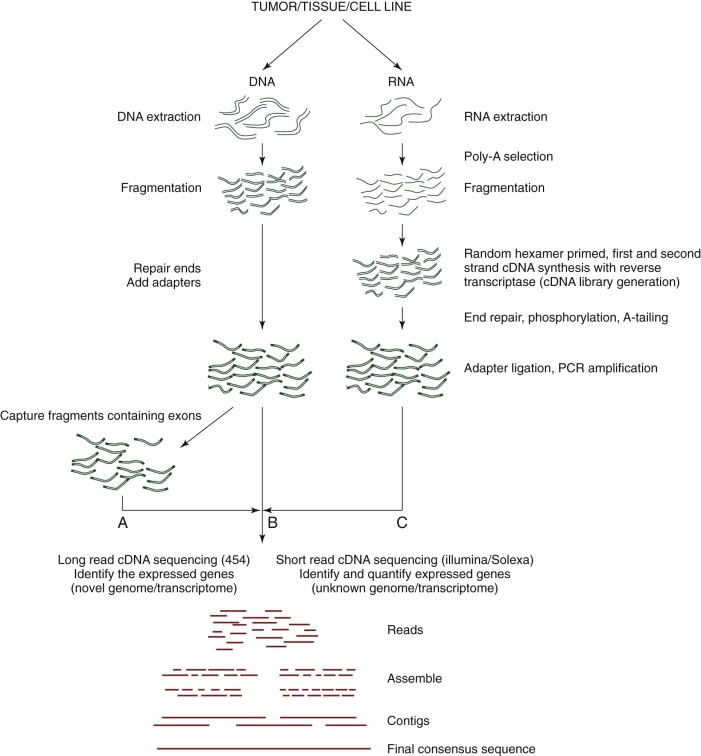
Although GWA studies have identified many loci contributing to diseases and complex traits, most findings account for only a small proportion of the heritability. Many mendelian disorders have been attributed to underlying genetic changes through linkage analysis and resequencing. Nevertheless, the causative mutations for more than half of the ~6000 known mendelian disorders remain unknown, mostly because of the paucity of cases and low penetrance. Therefore an abundance of low-penetrant common variants are now described that reportedly contribute to the inheritance of common diseases ( Fig. 41-8 ). Highly penetrant but rare mutations that contribute to diseases with mendelian inheritance are being identified through NGS high-throughput methods that parallelize the sequencing process, producing millions of concurrent sequences. To better focus on these potential causes of disease, target enrichment strategies were developed to facilitate a focused sequencing to determine the coding variation in the entire genome ( Fig. 41-9 ). The exome represents the 1% of the genome (30 megabases) that is translated into proteins. Although the untranslated regions are part of the exon, exome sequencing studies usually do not include these regions. The general workflow for whole exome sequencing (WES) involves DNA extraction, fragmentation, exome segment isolation, and sequencing ( Fig. 41-10 ). For many diseases for which conventional approaches have failed, exome sequencing has led to candidate gene identification. Targeted exome sequencing has also provided evidence for alternative transcriptional start sites in colorectal carcinoma, RET gene fusion in lung cancer in nonsmokers, and stage-specific alternative splicing in neuroblastoma. Of course, identifying the disease-related genes among all of the sequencing errors and non–disease-causing polymorphisms remains a considerable challenge. The application of exome sequencing typically results in identification of more than 20,000 single nucleotide variants, and although most are known polymorphisms, other details are necessary, such as the pedigree, mode of inheritance, and sample size. The informatics techniques for identifying causal and alternatively spliced variants are well established. Although the costs of whole genome sequencing (WGS) are decreasing, WES remains a mainstay for identifying causal variants of genetic diseases.

Whole Genome Sequencing
NGS methodologies can be applied to determine the entire sequence of an organism’s genome. A current role for WGS and WES is to study whether common complex diseases are driven by rare variants (“rare variant hypothesis”) or by many common variants with small effects on risk (“common disease–common variant”). Methods for WGS are similar to exome and whole transcriptome sequencing ( Fig. 41-10 ). Isolated and fragmented DNA is subjected to repetitive and overlapping sequencing to achieve the most robust coverage. Although the cost of WGS remains relatively high, identification of rare disease-causing variants is often achieved by family studies in which sequencing efforts are focused on individuals at the extremes of the trait’s distribution or by studying the most distant coaffected subjects. As might be expected, considerable informatics challenges exist for determining significant rare variants.
RNA-Based Methods
Whole Transcriptome Shotgun Sequencing (RNA-Seq)
Although hybridization-based (e.g., microarray) studies target the millions of common alleles (SNPs) in the genome, such libraries are limited in their ability to detect rare variants that cause disease. NGS methodologies facilitate the unbiased sequencing of all RNA transcripts in a cell (RNA-seq ; Fig. 41-9 ), providing a means to study gene fusions, mutations, alternative splicing, and modulation in gene expression levels. Subpopulations of RNA such as microRNA (miRNA), transfer RNA, and ribosomes can be characterized as well. Sequencing of the transcriptome has been applied to many malignancies, including prostate cancer, mesothelioma, squamous cell lung cancer, Fanconi anemia, and breast cancer. The general workflow for transcriptome sequencing is similar to WGS and WES, except that isolated RNA must first be converted into a cDNA library ( Fig. 41-10 ). Once sequencing data have been collected, alignment and contig generation depend on the presence of a scaffold for a known genome or de novo methods for a novel genome.
Expression Profiling
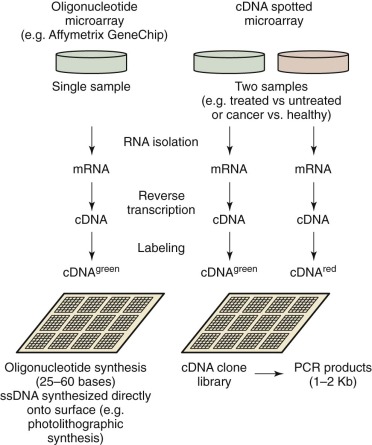
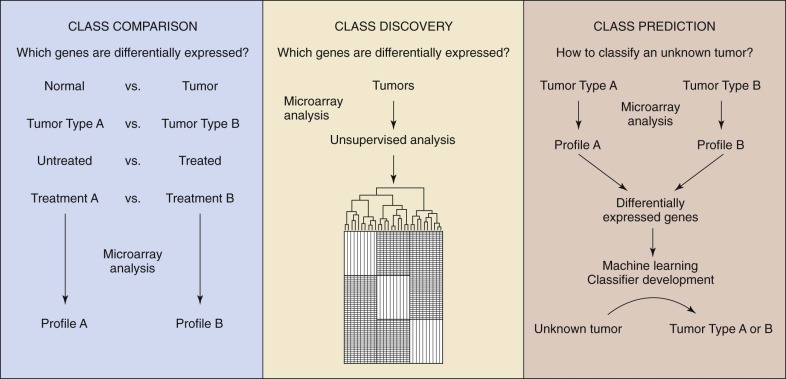
By measuring the activity of thousands of genes simultaneously, it is possible to make broad global assessments of cellular activity or compare expression levels of genes between two different states or conditions. The development and commercialization of DNA microarrays have commoditized the analysis of gene expression, making it a common method of study of biologic systems. The general process is similar to other microarray-based workflows ( Fig. 41-11 ). Commercial systems (e.g., Affymetrix GeneChip and Illumina BeadArray) utilize oligonucleotide arrays of varying density, depending on the application. The target sample is prepared by extracting miRNA, creating cDNA using reverse transcriptase, and then labeling the DNA. Even though each chip characterizes a single sample, the high reproducibility of the system facilitates comparison of expression levels between more than one condition. To compare two conditions directly, they are first differentially labeled (e.g., green and red), combined, and then applied to a cDNA array with subsequent measurement of the intensity ratios. Three applications for gene expression profiling are: (1) class comparison, (2) class prediction, and (3) class discovery. For class comparison, the objective is to understand which genes are differentially expressed between two known disease subtypes or conditions ( Fig. 41-12 ). The goal of class prediction is to define a classifier that can facilitate class membership for a sample based on its gene expression profile. Class discovery is useful when trying to define clinically relevant molecular subtypes. MiRNA functions as a regulator of gene expression both during and after transcription. The expression of miRNA can be monitored with use of microarrays, as described earlier. Such methods were used to show a novel miRNA profile for chronic lymphocytic leukemia.
Protein-Based Methods
Protein Microarrays
The large-scale monitoring of protein expression, function determination, and interaction can be assessed through the use of protein microarrays. Similar to DNA microarrays in concept, proteins are immobilized on the surface of a solid support, such as a glass slide. Protein probes labeled with fluorescent dye are applied to the array and the interactions are monitored by laser scanning. Protein microarrays have been used to construct interactome maps, monitor protein levels in patients with chronic graft-versus-host disease, and facilitate biomarker identification for cancer and other diseases.
Mass Spectrometry
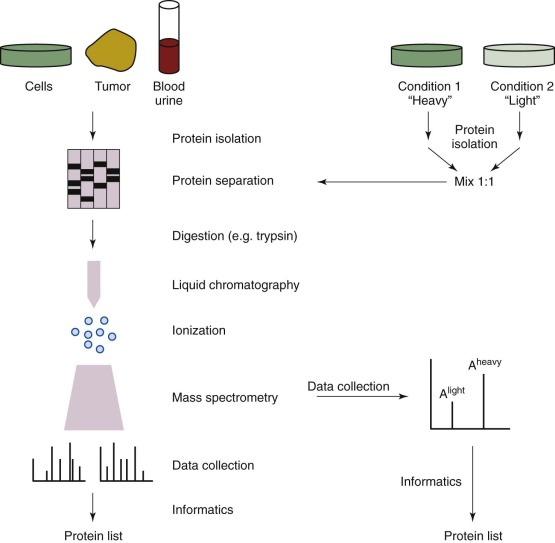
Proteomic analysis by mass spectrometry (MS) remains the mainstay of comprehensive protein analysis in cells and other complex systems. In general, most MS-based studies follow a paradigm of protein isolation, enzymatic digestion, separation, MS, and informatic analysis ( Fig. 41-13 ). For quantitative studies, cells can be grown in differential isotopic media (with stable isotope labeling by amino acids in culture) or labeled during or after enzymatic digestion (oxygen-18 [18O], isobaric tag for relative and absolute quantitation [iTRAQ] ) so that amounts of nonlabeled (light) and labeled (heavy) peptides can be compared. Traditional proteomic approaches involving data-dependent acquisition are based on selecting the top most abundant precursor ions for fragmentation. As a result, protein identifications are disproportionate, with the abundant proteins in a sample getting more coverage and low-abundance (and often more interesting) proteins being missed entirely. The downside of narrow dynamic range is evident in MS analysis of complex samples such as human serum, wherein the most abundant proteins account for more than 85% to 90% of total protein content, whereas the more informative proteins remain in the low molecular weight serum proteome. To circumvent these issues, researchers typically incorporate the use of labeled cell lines, enrichment strategies, fractionation techniques, and protein depletion methods (e.g., Agilent [Santa Clara, Calif.] Multiple Affinity Removal System column) into experimental protocols. On the analysis front, inclusion lists and single/multiple reaction monitoring assays for targeted proteomics are used and have been shown to be sensitive even in the context of biomarker validation in human plasma. However, these methods still have a fundamental flaw in that the candidates for inclusion are chosen without regard for the overlap between the proteins of interest and the dominant background. Thus, in the context of analyzing important cancer protein markers, the complexity of the human proteome makes it difficult for the MS platform to characterize a few select proteins effectively. Informatics challenges present a second major obstacle to the effective use of proteomics in a clinical setting. Providing researchers and clinicians with access to powerful computing resources and data management tools that are capable of rapidly processing the hundreds of samples in large-scale clinical settings remains a challenge. Existing proteomics pipelines such as the Trans-Proteomic Pipeline, OpenMS, and ProteoWizard run on workstations but do not work effectively at these scales. On-demand cloud computing services, such as that operated by Amazon Web Services, provide an intriguing alternative, and cloud-based options for data processing are available. Galaxy-P ( https://usegalaxyp.org/ ), developed at the University of Minnesota, is a framework for performing computation-intensive proteomic data processing on their computer cluster. Inspired by the public Galaxy server that is used for genomics at the University of Pennsylvania, Galaxy-P offers key proteomics software applications on a freely available platform.

