Fig. 1.1
Diabetes impact on health care cost. The increase in obesity in the U.S. over the last 30 years has increased to more than 25 % of the population in many states. The associated rise in diabetes is now estimated to be 79 million pre-diabetic and 23 million type 2 diabetic. This leaves an unmet need for diagnostics to sort emerging diabetics with highly specific and sensitive treatments to stall progression and reduce the cost of complications. Mechanistic progress has been made on several fronts and is reviewed in this chapter
As the pre-diabetic patient progresses to diabetes, significant insulin resistance is observed. Hyperglycemia worsens with increased insulin resistance, as insulin is the major controller of glucose metabolism. It is produced in the pancreas where its secretion is stimulated by a rise in blood glucose. Insulin binds to adipose to inhibit lipolysis and activates the liver and muscle to store glucose as glycogen, and it promotes glucose uptake into muscle and adipose tissues through glucose transporter 4 (GLUT4) (Dugani 2005). The insulin resistant state occurs when insulin receptor responsiveness is reduced. Significant progress has been made in the identification of factors that impact insulin sensitivity, such as adipokines, inflammation signaling, complement factors, and immune cell activation. The recently discovered adipokine hormones such as leptin, adipionectin, and ghrelin also impact insulin action. Additionally, hormones such as growth hormone (GH), insulin-like growth factor (IGF), insulin-like growth factor binding protein (IGFBP), epinephrine, glucagon, and cortisone are known to influence glucose metabolism and secretion and impact insulin action. However, known biomarkers still do not adequately predict insulin resistance (Goldfine et al. 2011). In Chap. 4 we explore the role of reduced insulin degradation during insulin resistance.
1.1.1 Glycation Stress
Hyperglycemia causes biological stress that produces advance glycation end-products (AGEs) that alter proteins, lipids, glycans, and nucleic acids (Goh et al. 2008). AGE are formed either by non-enzymatic glycosylation between reducing sugars and amine residues or by autoxidation of glucose. Non-enzymatic reactions of protein amino groups with glucose form a ketoamine adduct (Amadori product) that is dependent on incubation time and glucose concentration. Lysine is the preferred non-enzymatic glycation site over hydroxylysine and arginine (Garlick et al. 1988). AGE can form with most molecules in human biological fluids and tissues at multiple glycation sites (Zhang et al. 2008; Ramírez-Boo et al. 2012). Basal glycation is typically detectable in relatively high concentration with normal patient samples, and diabetic patient samples are about two to fourfold higher (Calvo et al. 1988; Ramírez-Boo et al. 2012).
The discovery that glycated hemoglobin (HbA1c) is an AGE component of human hemoglobin turned out to be a useful diagnostic tool for diabetic care (Rahbar 2005). Today, HbA1c is well correlated with glycemic control and diabetic complications (Nathan et al. 2014). This correlation is based on the intensive glucose control to reduce carotid intima-media thickness and levels of the HbA1c. HbA1c is also highly correlated with the extent and duration of hyperglycemia over 2–3 months. The duration of the prediction is directly due to the natural turnover of red blood cells. Glycation of human serum albumin (HSA) has also been extensively studied and shown to increase in diabetic patients (Wa et al. 2007). Non-traditional AGE markers of hyperglycemia (glycated albumin, fructosamine, 1,5-anhydroglucitol (1,5-AG)) are responsive to glycemic control over shorter periods (Poon et al. 2014; Parrinello and Selvin 2014). While nontraditional markers are often linked to vascular complications, they are often found to be inversely related to obesity.
Glycation stress and AGE formation are often proposed as having key mechanistic roles in biological damage. AGE formation on endothelial cells and monocytes has been tied to nephropathy, retinopathy, and low grade inflammation in humans (Goh et al. 2008). In the kidneys, AGE formation on glomerular basement membrane (GBM) is correlated with membrane thickening, mesangial matrix expansion, and increased collagen, fibronectin, and laminin (Throckmorton et al. 1995; Skolnik et al. 1991). Guanidine-insoluble collagen is the site extensively glycated on GBM (Garlick et al. 1988). This AGE formation is observed during fibrosis with increased smooth muscle migration and proliferation. Fibrosis requires activation by connective tissue growth factors and Transforming Growth Factor- β (TGF- β). Glycation of lipids is also detectable. For example, high-density lipoprotein (HDL) levels increase by about 400 % in diabetic patients (Calvo et al. 1988). AGE of lipid and proteins are theorized to preserve cellular signal patterns in a pathologically stressed state until they are cleared from the cell (Ceriello et al. 2009). Inhibition by therapeutic agents has been shown to reduce AGE formation (Goh et al. 2008). However, how AGE stimulate molecular damage is not completely clear.
Receptors for AGE (RAGE) are often implicated as a pathway for molecular damage. RAGE are part of the immunoglobulin superfamily of receptors and lectin. RAGE are found to respond to a wide range of proteins through the glycated lysine residues (Neeper 1992). However, the binding of these AGE ligands is not sufficient to induce inflammatory signals. The key ligand primarily responsible for RAGE stimulation appears to be calgranulin (S100), a protein that is secreted from innate immune cells (neutrophils and monocytes) independent of glycation (Bierhaus et al. 2005; Valencia et al. 2004). Activation of RAGE appears to be mainly immune cell mediated and a pathway for molecular damage. Activation increases vascular endothelial cell expression of intercellular adhesion molecule-1 (ICAM-1) and vascular cell adhesion molecule-1 (VCAM-1) and causes innate immune cells to secrete tumor necrosis factors -α (TNF-α) and TGF-β (Valencia et al. 2004; Wautier et al. 1996). These cytokines induce the inflammatory pathways involving the nuclear factor kappa-light-chain-enhancer of activated B cells (NFκB) and the mitogen-activated protein kinase phosphatase (MAPK) pathways (Ramasamy et al. 2011). Additionally, S100 binding of RAGE on innate immune cells activates phospholipase D2 and phosphokinase C (PKC) which are thought to generate additional reactive oxygen species (ROS) by the conversion of nicotinamide adenine dinucleotide phosphate-oxidase (NADPH) to NADPH oxidase (NOX) (Pendyala et al. 2009; Curran and Bertics 2011).
In summary, while glycation stress and glycemic control can be measured by current AGE markers, there has been only a weak molecular connection between the AGE markers and the causation of complications. Next generation AGE markers seek to make stronger connections with the causation of complications. Chapter 2 explores glycated CD59 as one of these next generation markers. The glycation of CD59 occurs at a specific site that blocks CD59 from inhibiting formation of membrane attack complex (MAC) (Halperin et al. 2000). As a result, glycation increases MAC cell lysis during complement formation. Chapter 2 also reviews the importance of complement in diabetic complications.
1.1.2 Oxidative Stress
Hyperglycemia is shown to increase oxidative stress and the production of ROS. Oxidative stress is a normal byproduct of the aerobic metabolism, where oxygen is lost to the formation of superoxide anion free radicals as the predominate ROS (Pitocco 2013; Seifert et al. 2010). The mitochondria electron transport chain produces ROS during the production of adenosine triphosphate (ATP) from the glycolytic pathway (citric acid cycle). Hyperglycemia causes the glycolytic pathway to breakdown into more glucose producing NADH (Yan 2014). Overproduction of NADH increases mitochondrial oxidative stress byproducts by NADH dehydrogenase. Additionally, the consumption of glycolytic pathway byproducts by the hexoamine, methlglyloxyal, enediol, and diahydroxyacetone pathways cause additional ROS. Diacylglycerol also activates NOX through PKC and leads to additional ROS (Pendyala et al. 2009).
The result of ROS is damage to DNA, lipid, and proteins (Piconi 2003; Yan 2014; Seifert et al. 2010). ROS leads to additional free radicals which cause further damage. For example, production of reactive nitrogen species is formed by free radical exchange with nitric oxide that is produced by nitric oxide synthase (NOS) (Pitocco 2013). Oxidative stress is correlated with diabetic inflammation, insulin sensitivity, and β-cell dysfunction (Bashan et al. 2009; Poitout and Robertson 2008). Oxidative stress is also associated with aging, cancer, atherosclerosis, neuropathy, nephropathy, retinopathy, obesity, hypertension, cardiovascular diseases, and heart failure (Lee and Wie 2007; Storz 2005; Lim et al. 2008; Madamanchi et al. 2005; Kanauchi et al. 2002; Knight 1997; Wilkinson-Berka et al. 2013; Pitocco 2013). ROS are implicated in causing epigenetic changes, endothelial dysfunction, impacting vascular tone, apoptosis, cell adhesion, and immune responses (Lim et al. 2008; Lee and Wie 2007; Zhang and Gutterman 2007; Gutterman et al. 2005; Chiarugi et al. 2003; Grisham 2004). Immune cells cause oxidative stress by increasing ROS through immune cell NOX (Hou et al. 2008). ROS impact many cellular processes such as proliferation and apoptosis (Droge 2002). Inflammation, growth factors, and cytokines also impact ROS formation. Overall, oxidative stress is one plausible mechanism for biological damage, but it is non-specific to hyperglycemia.
1.2 Impact of Obesity
1.2.1 Adipose Signaling
Obesity clearly leads to diabetes, and it increases the inflammatory response (Brady et al. 2012; Horakova et al. 2011). Obesity also worsens hyperglycemia and increases ROS and AGE generation. The current epidemic of obesity has increased the population of pre-diabetes with impaired glucose tolerance, insulin resistance, and hypertrophic adipose fat (See Fig. 1.1). The discovery of the hormone, leptin; a product of the obese (ob) gene, opened the door for discoveries of new regulatory factors originating from adipose fat (Zhang et al. 1994). Adipose tissue is now accepted as a source of adipokine signals that impact metabolism and are linked to obesity mediated diabetes (Preedy and Hunter 2011). Adipose tissue is a complex matrix and contains various cell types such as adipocytes, macrophages, fibroblasts, adipocyte precursors, and others (Ahima 2006; Espinoza-Jiménez et al. 2012). Of the molecules released primarily from adipocytes during obesity, leptin, and adiponectin (Adpn) have the strongest correlated impact on glucose metabolism (Wang and Nakayama 2010). Leptin and Adpn have the structural characteristics of a cytokine; therefore, they are called adipokines.
Leptin reduces food intake (loss of appetite, satiety) and increases energy expenditure which leads to weight loss (Gordon 2003). It is produced by the ob gene, and its deficiency causes obesity. Chapter 5 describes leptin resistant animals which become obese and spontaneously develop diabetes. Leptin signals the level of adipose energy stores to the brain’s hypothalamus and causes decreases in food intake and increases its energy expenditure. This results in more fat oxidization. Leptin activates the Janus kinase-signal transducer-activator of transcription (JAK STAT) pathway to stimulate inhibition of neuropeptides and activation of several anorexigenic peptides (Sweeney 2002; Gordon 2003). It has an effect on the central nervous system (CNS), it stimulates fatty acid oxidation in muscle, and it controls triglyceride synthesis in the liver (Minokoshi et al. 2002; Cohen et al. 2002). Leptin contributes to insulin resistance and is involved in the release of inflammatory cytokines (Smith 2012).
Adiponectin has structural similarity to the C1q/TNF family of proteins (Preedy and Hunter 2011). It activates AMPK and upregulates peroxisome proliferator-activated receptor (PPAR α) to enhance glucose uptake and fatty acid oxidation in muscle (Yamauchi et al. 2002) (See Chap. 5 for further details). Adpn suppresses glucose output in the liver and improves insulin sensitivity through a mechanism that is not well understood (Wang et al. 2005). Adpn is also present in CNS and peripheral tissue. Levels of Adpn correlate inversely with obesity; whereas Leptin levels increase in obesity (Satoh 2004). Decreased Adpn is associated with diabetes and cardiovascular disease. Adpn also has anti-inflammatory properties, where it suppresses cytokines, adhesion compounds, and lipid uptake in monocytes (Yamauchi et al. 2002; Ouchi et al. 2000). Chapters 5 and 10 show how cellular models can be used to explore cell signal transduction of Adpn and other biochemical substances on the insulin-dependent pathways of phosphatidylinositol 3-kinase (PI3K), protein kinase B (Akt), and insulin-independent pathways of AMP-activated protein kinase (AMPK).
Even with well-established cell and animal models in place, the mechanism by which Adpn delivers improved insulin sensitivity and anti-inflammatory effects is still disputed. Adpn deficient mice are reported to show small changes in insulin resistance and glucose intolerance (Kubota et al. 2002), while other reports show that Adpn deficient mice do not show any improvement (Ma et al. 2002). Additional studies report higher hepatic glucose production in Adpn deficient mice (Meada et al. 2002). The response appears to be impacted by the combination of a high fat diet and Adpn deficiency. There is also response dependency on the ob gene and PPARα agonists (Nawrocki et al. 2006). Responsiveness correlates with higher tumor necrosis factors -α (TNF-α), mRNA expression, and reduced insulin receptor activity via an unknown mechanism (Meada et al. 2002). Some Adpn oligomers inhibit growth factors (e.g. platelet-derived growth factor (PDGF), fibroblast growth factor (FGF), and epidermal growth factor (EGF)), which explains cytokine production and activation of NFκB (Wang et al. 2005). Adpn also stimulates caspase mediated cell apoptosis during the pro-inflammatory response (Bråkenhielm et al. 2004). The apoptosis and cytokine stimulation aligns with innate immune mediated events that are further described in Sect. 1.4.2, rather than a direct stimulation by Adpn. The responsiveness to insulin secretion might be indirectly related to inflammatory signaling.
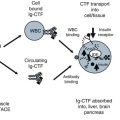
Chapters 4 and 5 describe how the adiponectin receptor (AdipoR) has a direct impact on insulin by inhibition of insulin-degrading enzyme (IDE) and on TNFα release by inhibition of TACE (TNFα alpha cleavage protease). This new finding adds to the previously known functions of the AdipoR to cause glucogenisis and fatty acid oxidation through the AMPK and PPARα pathways (Kadowaki et al. 2005). Chapter 3 reviews the discovery of free adiponectin receptor C terminal fragment (AdipoR CTF) in human plasma and the development new assays for measurement of this signaling receptor. Chapters 4 and 5 make use of these new assays in biochemical studies, animal and cell models, and human clinical trials to explore the impact of AdipoR CTF on the innate immune mediated pathway.
Adipose tissue has additional complex interactions with the brain and other peripheral organs with additional regulatory factors. Ghrelin is a key component of this interaction and originates from the gastrointestinal tract and indirectly impacts the adipose by functioning as the central “hunger hormone on the brain” (Gumbs et al. 2005). As a para gut hormone, ghrelin is an endogenous ligand of the growth hormone secretagogue receptor and stimulates the production of neuropeptide like peptide Y (PPY) through the JAK STAT pathway. Ghrelin levels increase before meals, and it is thought to be involved in meal initiation and shows a rapid postprandial decline. Ghrelin administration causes increased caloric intake and initiation of hunger.
Several additional regulatory factors have weaker connection to glucose metabolism in obesity. Some are primarily produced and secreted by adipose. These include omentin (interlectin), visfatin (nicotinamide phosphoribosyltransferase), and resistin. Other regulatory factors are secondarily secreted by adipose, like retinol-binding protein 4 and vaspin. While they all generally correlate with obesity, the relevance of these regulatory factors is still in question (Preedy and Hunter 2011).
1.2.2 Free Fatty Acid Storage
Adipose is the major site of energy storage in the form of triglyceride (TG). Adipocyte can release free fatty acids (FFA) and TG when the body’s energy level demands it. Adipose, FFA, and TG are controlled by several regulatory factors from adipocytes and other tissue. Acylation stimulating protein (ASP), fatty acid-binding protein (FABP), adipose factor (aka angiopoietin-like protein 4), and cytosolic fatty acid synthase (FAS) are examples.
ASP is produced in adipose and other tissue, and it stimulates glucose uptake, clearance of TG, and it inhibits TG release (Cianflone and Maslowska 1995; Cianflone et al. 2004). ASP is produced by an interaction with complement C3 (aka ASP precursor), factor B, and complement factor D (aka adipsin). All can be produced by adipose. ASP increases with increases in weight, diabetes, obesity, metabolic syndrome, and dietary fat (chlyomicrons) (Faraj et al. 2008; Cianflone 2008). ASP regulates TG synthesis by activating diacylglycerol acyltransferase (DGAT). However, some researchers report no impact of ASP deficiency in animal models (Phieler et al. 2013). Other question the role that ASP plays, whether implicated in complement-mediated injury or in regeneration interaction with complement C3 (Phieler et al. 2013).
In healthy individuals, hypoglycemia decreases insulin levels and increases lipase breakdown of TG into FFA (Stralfors and Honnor 1989). Albumin and FABP transport fatty acids to muscle and liver for fatty acid oxidation. FABP is widely secreted in the body and causes fatty acid uptake and intra-cellular transport (Chmurzyńska 2006). Adipose FABP increases with obesity and correlates with adipose tissue mass and body mass index (BMI) but is poorly predictive of insulin resistance (Horakova et al. 2011). Fatty acid oxidation and release of energy in muscle and liver occur by activation and transport into the mitochondria, β-oxidation, and the electron transport chain.
Hyperglycemia increases insulin levels and signals the liver and muscle to stop fatty acid oxidation and also signals the adipose to store FFA and TG. Under a continued high energy diet in a low exercise environment, increased fat storage and resulting obesity will occur. Large vacuoles of triglyceride fat accumulate in the liver and adipose. This causes steatosis in the liver and greater lipid loading of adipocytes and increased adipose mass in the adipose, which leads to hypertrophic and hypoxic adipose tissue. Adipose factor is produced by adipose and other tissue to inhibit storage of FFA and TG (Preedy and Hunter 2011). It is produced in the liver and contributes to the development of diabetic dyslipidemia; it inhibits lipoprotein lipase in adipose tissue lipolysis; and it raises plasma TG and FFA (Mandard et al. 2006). However adipose factor has poor diagnostic predictive value for diabetic onset.
Adipose fat synthesis is stimulated by insulin directly by stimulating pyruvate dehydrogenase and the acetyl-CoA carboxylase enzymes and indirectly by glucose uptake, which then stimulates nuclear receptors. Synthesis of most fatty acid moieties of the membrane lipids is done by FAS, which synthesizes fatty acids from malonyl CoA. Synthesis and metabolism of both fatty acids and cholesterol lipids is through transcriptional regulation by nuclear receptors such as sterol regulatory element binding proteins (SREBP), farnesoid X receptor  (FXR), and the liver X receptors (LXR). Activation causes transcription of genes for cholesterol synthesis and the LDL receptor (Ulven et al. 2005; Calkin 2013). Glucose induces FXR gene expression in a dose- and time-dependent manner. FXR expression decrease triglyceride levels by regulating the expression of several lipid-modulating proteins.
(FXR), and the liver X receptors (LXR). Activation causes transcription of genes for cholesterol synthesis and the LDL receptor (Ulven et al. 2005; Calkin 2013). Glucose induces FXR gene expression in a dose- and time-dependent manner. FXR expression decrease triglyceride levels by regulating the expression of several lipid-modulating proteins.1.3 Inflammation in Obesity and Diabetes
With the development of obesity, there is an increase in adipocyte mass, greater lipid loading (TG, FFA, chylomicrons), tissue hypertrophy, and reduced vascularization of the adipose tissue. The reduced capacity of the bloodstream to oxygenate adipose tissue results in hypoxia. Hypoxia then produces a pro-inflammatory response from adipose through hypoxia-inducible factor (HIF) (Nizet and Johnson 2009; Trayhurn et al. 2008). Alternative complement pathway reviewed in Chap. 2 is activated in hypoxia stress via C1q complement which causes deposits, tissue injury, and further cellular activation (Collard et al. 1999). Alternative complement pathway is not triggered directly by glucose or insulin in high fat diets (Peake et al. 2005). Complement activation in adipose tissue, liver, and pancreas occurs under conditions of oxidative stress with upregulated complement receptors (Phieler et al. 2013). This activation is highly varied and not completely understood. Plasma C3 levels do appear to be higher in patients with diabetes, and this is mainly from adipose activation. However, complement activation is observed in the vicinity of apoptotic cells in the liver, kidney, and pancreas. Islets cells accumulate extracellular amyloid fibrils which can trigger local complement activation via C1q (Phieler et al. 2013).
Dysfunctional adipose tissue produces cytokines such as TNFα, TGF-β, and interleukins (IL-1, IL-6, IL-8 IL-18), as well as chemokines like macrophage inhibitory cytokine (MIC-1), monocyte chemotactic protein (MCP), and cytokine-induced neutrophil chemoattractant (CINC-1) (Wang and Nakayama 2010; Preedy and Hunter 2011). Lipocalins such as neutrophil gelatinase-associated lipocalin (NGAL, aka Lipocalin-2 (LCN-2)) are released by neutrophils in obesity (Preedy and Hunter 2011). Chitinase-3-like protein 1 (YKL-40, aka CHI3L1) is secreted by macrophages in obesity. Regulatory factors that impact the endothelial, such as endothelin (ET), thrombospondin (TSP-1), plasminogen activator inhibitor 1 (PAI-1), apelin, and angiotensinogen, are also secreted by adipose in addition to primary excretion by other tissue. The regulatory endothelial factor adrenomedullin is primarily produced by epicardial fat.
The innate immune and complement responses increase as obesity progresses to type 2 diabetes (Espinoza-Jiménez et al. 2012; Phieler et al. 2013). The innate cells, which include neutrophils, eosinophiles, monocytes, natural killer cells, and macrophages, increase in diabetes and obesity. In Chap. 7 we review how diabetics are prone to urinary tract infection (UTI) and systemic infections like Upper Respiratory Infection (URI). In Chaps. 7 and 8 we show that non-infective inflammatory activation is common in diabetes and obesity. Chronic mild inflammation in the absence of infection is now widely accepted and supported by mechanisms for activation of inflammation, complement, and innate immunity in diabetes (Tilg 200; Phieler et al. 2013; Espinoza-Jiménez et al. 2012).
1.3.1 Endothelial Dysfunction
Clinical and experimental data support a link between systemic inflammation and endothelial dysfunction in diabetes and obesity (Roberts and Porter 2013). Endothelial dysfunction occurs in diabetes with impaired endothelial-dependent vasodilation. Disruption of systems controlling vascular permeation can cause endothelial dysfunction. The most significant modulator of endothelial vasodilation is nitric oxide that is produced by endothelial nitric oxide synthase (eNOS) in endothelial and muscle cells. Nitric oxide also inhibits platelet aggregation, cell proliferation, and immune cell adhesion. Cell adhesion molecules (VCAM-1 & ICAM-1) are reduced. Meanwhile the renin-angiotensin-aldosterone system (RAAS) is the counter balance system, as it increases vasoconstriction, blood pressure, and fluid volume when angiotensin-converting enzyme forms angiotensin II.
These systems that control vascular permeation are critical to the innate immune response and to tissue repair because they allow migration, adhesion, innate immune cell response, cellular proliferation growth, and remodeling (Pacurari et al. 2014). During normal inflammation that results from injury or infection, muscle cells release serine protease and kallikrein, to form kinins, and they cause vasodilation and hypotension, increased capillary permeability, and infiltration of innate immune cells to the site of injury (Campbell 2000, 2001). Kinin formation is another mechanism for nitric oxide release and promotion of natriuresis and diuresis. Angiotensin-converting enzyme also reduces kinins. There is a direct correlation between vasodilation and increased blood flow to the site of inflammation with the loss of endothelial barrier being a hallmark of inflammation.
Endothelial dysfunction starts in diabetes and obesity when hyperglycemia and adipose signals exert signaling control on the endothelial barrier that overrides normal physiological control. Increased vascular permeability occurs in all diabetic vascular complications. Hyperglycemia is shown to diminish normal nitric oxide signaling and reduce permeability by increasing ROS which reduces nitric oxide levels (Roberts and Porter 2013). Hyperglycemia also increases vascular permeability by increasing the kallikrein response from smooth muscle (Feener et al. 2013; Riad 2007). Hypertrophic adipose diminishes nitric oxide through production of cytokines such as TNF-α, which activates NFκB and impairs eNOS expression (Besler 2011). Insulin resistance is another key promotor of vascular dysfunction, as insulin is less able to play a protective role of controlling eNOS expression via Akt-PI3K (Aroor et al. 2013).
Fat tissue in an obese individual impacts additional signals that both increase and decrease endothelial permeability. Adipose angiotensin is secreted during obesity and activates the RAAS counter balance system in the absence of injury. Adipose angiotensin increases blood pressure, angiotensin II levels, volume expansion, sodium retention, and it reduces glucose uptake (Preedy and Hunter 2011; Aroor et al. 2013). Circulating lipids cause activation of PKC which increases expression of vasoconstrictor endothelin (ET-1) (Nishizuka 1995). Adrenomedullin is secreted by adipose and increases with cytokine signaling, and it increases vasodilation and hypotension by increasing nitric oxide (Preedy and Hunter 2011). Meanwhile, apelin is expressed by adipose tissue in endothelial cells to increase vasodilation and hypotension by increasing nitric oxide production through the expression of eNOS during AMPK activation (Preedy and Hunter 2011). Adiponectin activation of AMPK also causes eNOS expression (Osuka et al. 2012).
Chronic endothelial activation occurs in diabetic and obese individuals even in the absence of infection caused by hyperglycemic and fatty acid stress (Tsuriya et al. 2011). This low level chronic activation is thought to be pathological in nature as it increases vascular dysfunction and contributes to both micro-vascular and macro-vascular complications (Feener et al. 2013; Kaneko et al. 2011). Vasodilation and increased blood flow typically allow the innate immune response to preform tissue repair starting with immune cell migration, adhesion, and response and leading to cellular proliferation signaling, tissue growth, and remodeling (Pacurari et al. 2014). Constant tissue remodeling leads to stiffness in the extra cellular matrix of the vascular system and loss of the elasticity of endothelium with increased endothelial and muscle cell layers. The elastin to collagen ratio is reduced. This reduced elasticity allows damaging innate immune cells to continuously infiltrate tissue and the vascular bed. Cellular proliferation is mediated through the MAPK/extracellular signal-regulated kinase (MAPK/Erk) pathway. The MAPK/Erk pathway also promotes expression of the potent vasoconstrictor endothelin (ET-1) to reverse the vascular dilation (Weil et al. 2011).
Chapter 9 reviews the innate anti-inflammatory response which is activated in both diabetes and obesity and increases with vascular dysfunction. Chapters 7, 8, 9, and 10 review the role of Bikunin (Bik) as a key anti-inflammatory component of this response. Bik is a serpin that inhibits the trypsin family of serine proteases and inhibits kallikrein, vascular dilation, smooth muscle contraction, and coagulation. Additionally, Bik inhibits blood coagulation and serine protease degradation of the endothelial through action of Factors IXa, Xa, XIa and XIIa on plasmin (Kato 2002; Pugia et al. 2007). In the acute phase of tissue injury, Bik is protective in function, stalling immune mediated tissue damage (See Chap. 10). In the chronic phase, Bik stalls tissue repair and cellular proliferation. A prolonged and chronic anti-inflammatory response is thought to impair the vascular system. In long standing inflammatory reactions to chronic diabetic and cardiovascular disease, Bik will be elevated above the normal range for healthy individuals but at levels below the acute response range. Tissue factor pathway inhibitor (TFPI) is another Kunitz-type protease inhibitor that inhibits the initial reactions of blood coagulation and PAR (Kato 2002). Adipose tissue has also been implicated as well as several other serpins. PAI-1 is a serpin that increases in obesity due to cytokine expression and causes obesity associated fibrinolysis (Preedy and Hunter 2011; Pugia et al. 2007). Vaspin is a serpin that is released from adipose and found to inhibit kallkrien (Preedy and Hunter 2011). The impact of prolonged exposure of serpins on innate immunity activation is a current active topic in chronic disease pathways.
1.3.2 Immune Mediated Apoptosis
Chronic low-grade inflammation in adipose tissue induces an innate immune cell response in type 2 diabetes (T2D) and obesity (McNelis and Olefsky 2014). Adipose tissue retains macrophages that are recruited by the pro-inflammatory profile of cytokines (IL-1β, IL-6, IL-18β, TNFα, TGF-α/β), chemokines (MIC-1, MIP-2, MCP-1, CINC-1), YKL-40, and LCN-2. These pro-inflammatory signals are released by adipose tissue due to fatty acid and oxidative stress (Espinoza-Jiménez et al. 2012) (See Fig. 1.2). Lipids retained in the sub-endothelial space are a leading cause of infiltration of macrophages. Activation of complement C3 and C5 also participates in macrophage recruitment and polarization (Phieler et al. 2013). Adipocyte macrophages are recently suggested to increase the ability of metabolic processing of adipocytes. At the same time macrophages are thought to accelerate the progression of insulin resistance and the development of diabetes (Johnson and Milner 2012; Patel et al. 2013). Macrophages also release cytokines and chemokines which further recruit other innate immune cells (Tilg and Moschen 2006).
Fig. 1.2
 Cardiovascular and Metabolic Syndrome Impact on Uristatin
 C-Terminal Fragment of Adiponectin Receptor Clinical Correlations
 Development of Adiponectin Receptor C-Terminal Fragment Bioassays
 Complement and Complement Regulatory Proteins in Diabetes
 Cell and Biological Models for the C Terminal Fragment of Adiponectin Receptor
 Uristatin Immunoassay Usage in Glomerular Nephritis Assessment


Innate Immune Mediated Apoptosis. Innate immune cells such as neutrophils, eosinophiles, monocytes, natural killer cells, and macrophages release serine proteases such as elastase, proteinase 3, cathespin and granzyme B during inflammation. These serine proteases mediate apoptosis through the extrinsic death receptor and mediate cytokine stress signaling through release of growth factors and cytokines (e.g. TNF α, IL-1β, IL-18β, and TGF α/β). The extrinsic death receptor signals the caspase apoptosis pathways. Growth factor increases MAPK p38 signaling of cytokine transcription. Granzyme B released from immune cells bypass the anti-apoptosis effect of nuclear transcription factor (NF-κB) by directly activating Caspase 3
Related posts:
Cardiovascular and Metabolic Syndrome Impact on Uristatin
C-Terminal Fragment of Adiponectin Receptor Clinical Correlations
Development of Adiponectin Receptor C-Terminal Fragment Bioassays
Complement and Complement Regulatory Proteins in Diabetes
Cell and Biological Models for the C Terminal Fragment of Adiponectin Receptor
Uristatin Immunoassay Usage in Glomerular Nephritis Assessment
Stay updated, free articles. Join our Telegram channel
Full access? Get Clinical Tree
