Fig. 5.1
Axial T1-weighted MRI
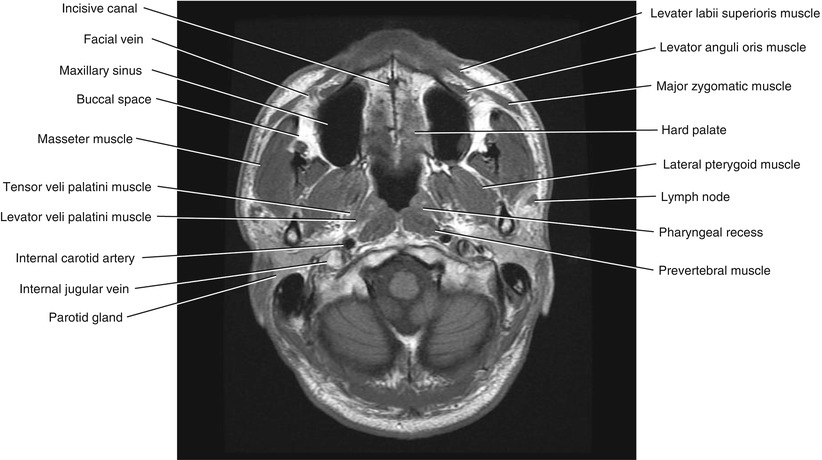
Fig. 5.2
Axial T1-weighted MRI
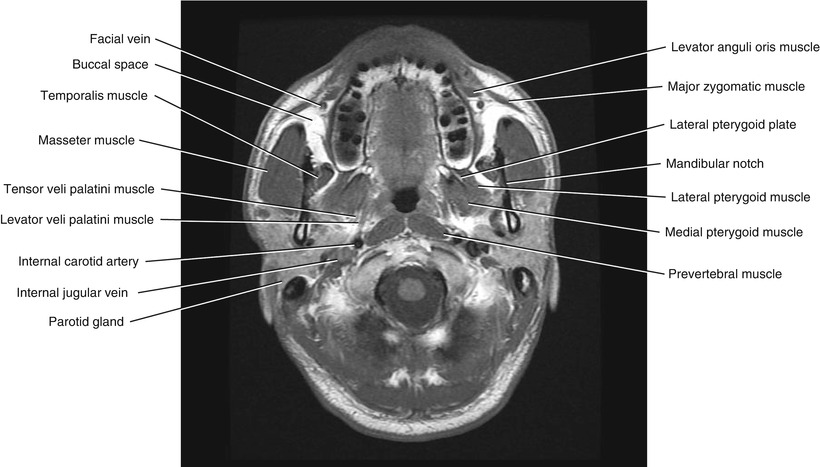
Fig. 5.3
Axial T1-weighted MRI
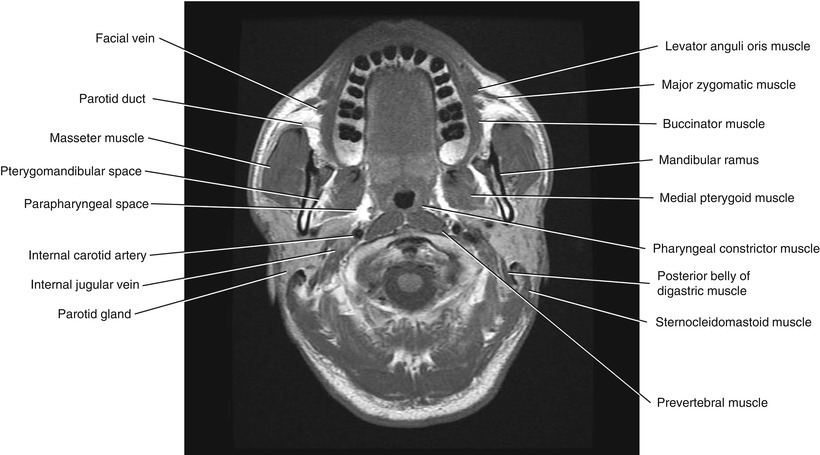
Fig. 5.4
Axial T1-weighted MRI
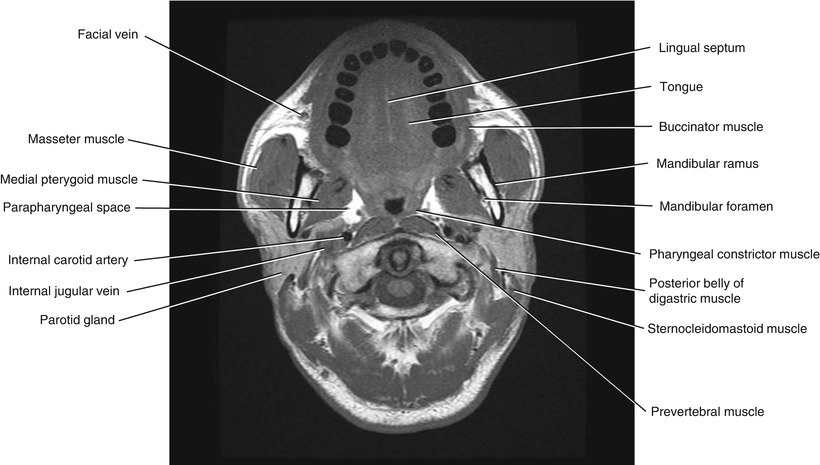
Fig. 5.5
Axial T1-weighted MRI
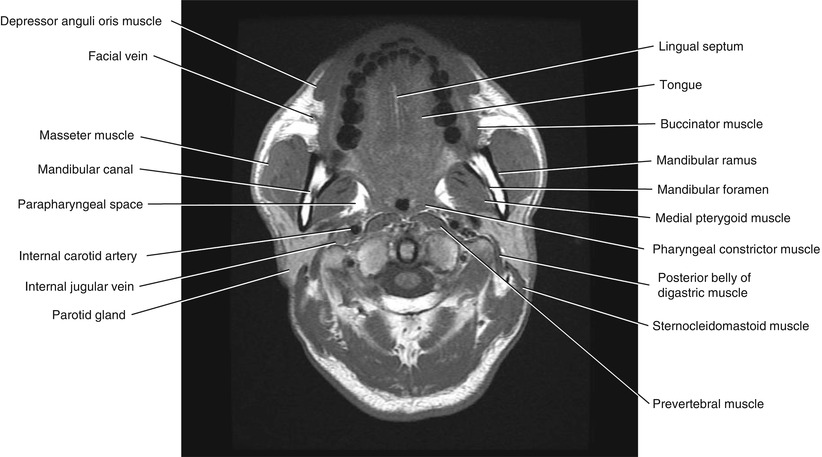
Fig. 5.6
Axial T1-weighted MRI
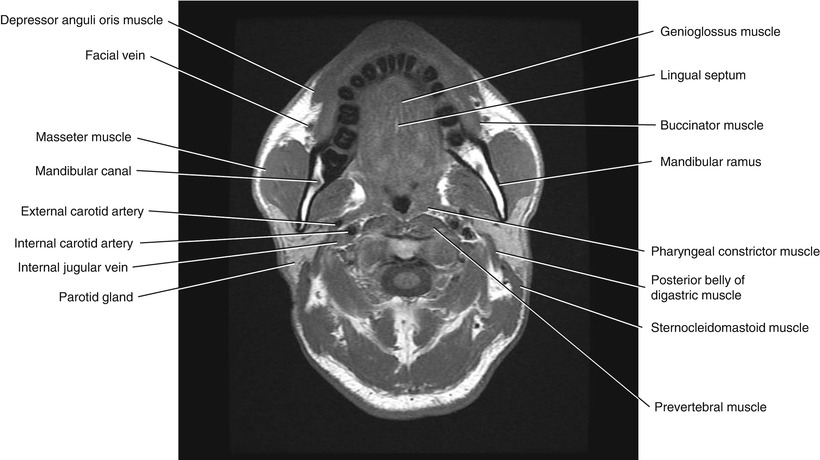
Fig. 5.7
Axial T1-weighted MRI
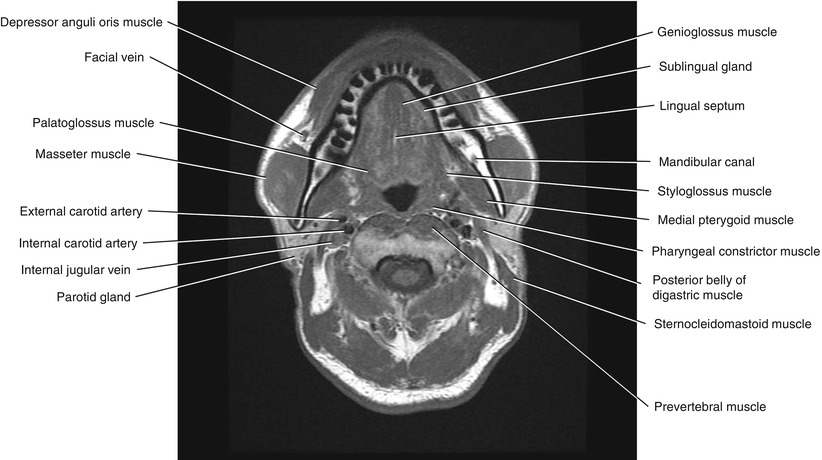
Fig. 5.8
Axial T1-weighted MRI
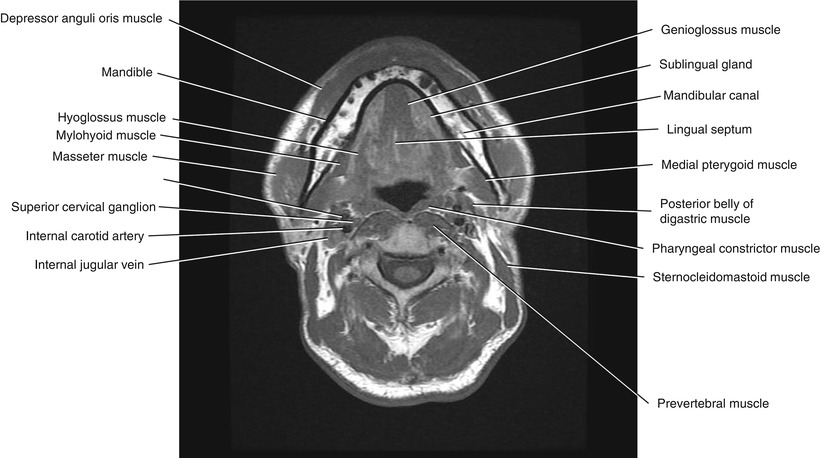
Fig. 5.9
Axial T1-weighted MRI
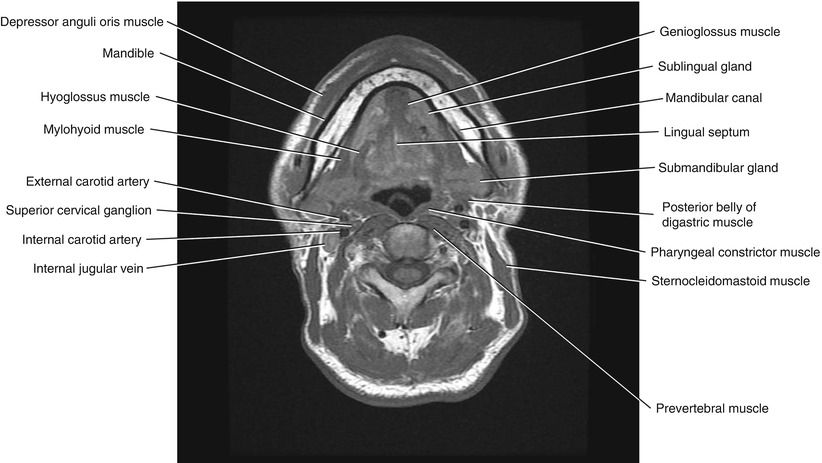
Fig. 5.10
Axial T1-weighted MRI
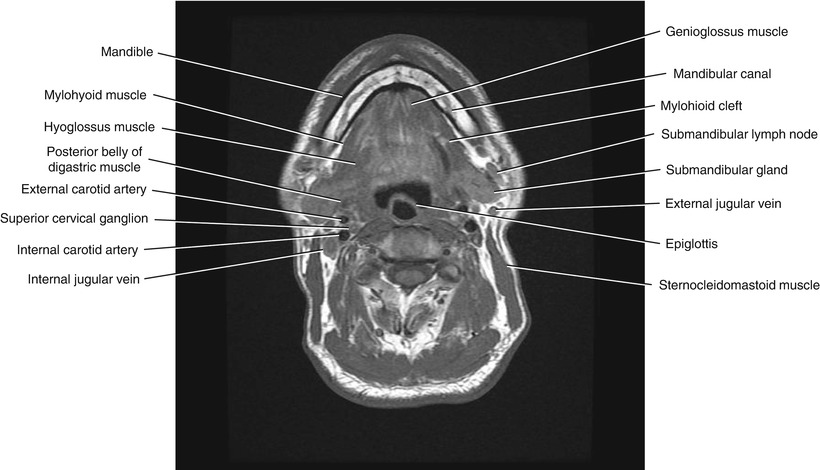
Fig. 5.11
Axial T1-weighted MRI
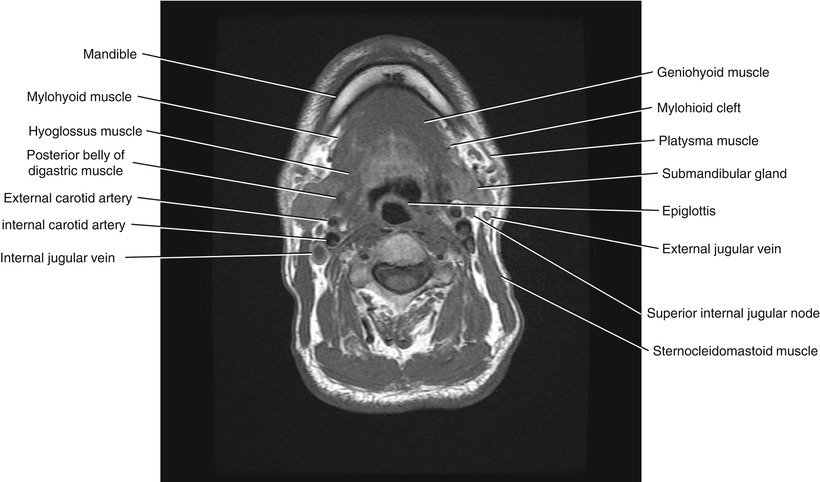
Fig. 5.12
Axial T1-weighted MRI
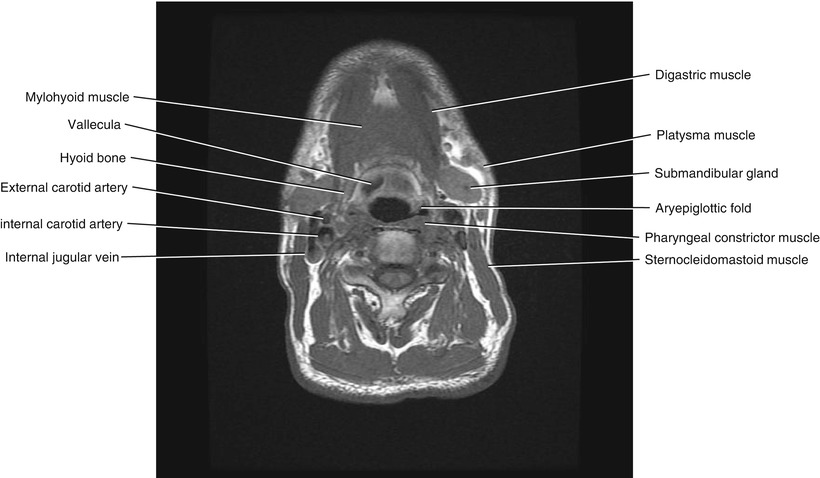
Fig. 5.13
Axial T1-weighted MRI
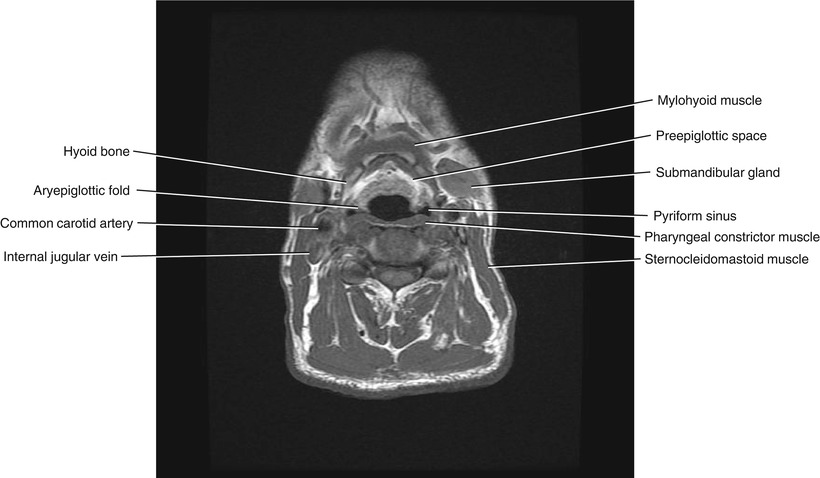
Fig. 5.14
Axial T1-weighted MRI
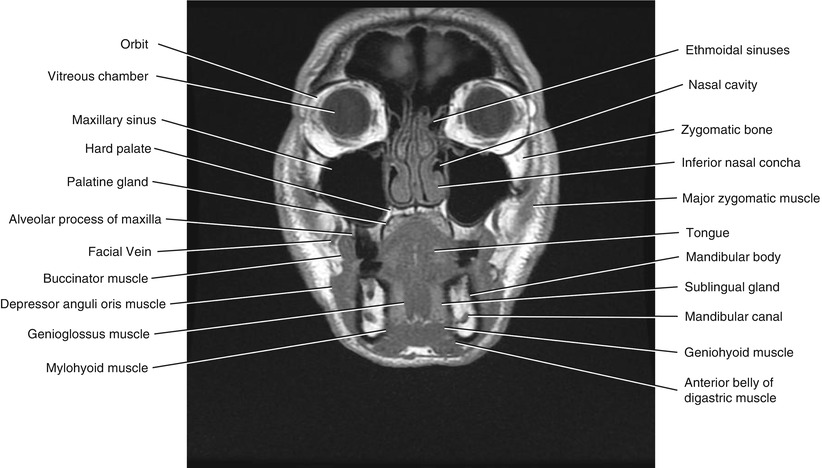
Fig. 5.15
Coronal T1-weighted MRI
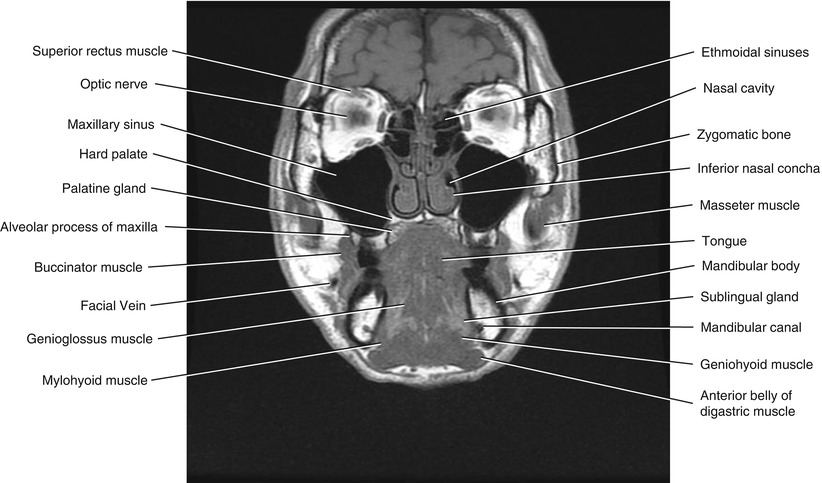
Fig. 5.16
Coronal T1-weighted MRI
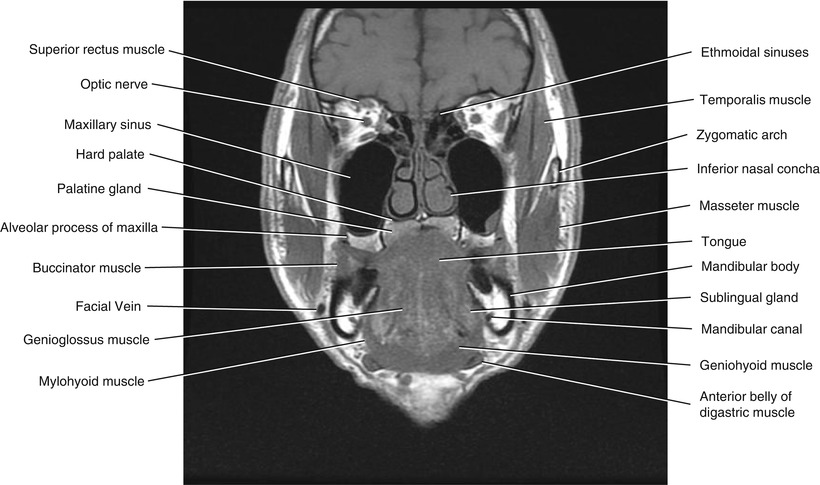
Fig. 5.17
Coronal T1-weighted MRI
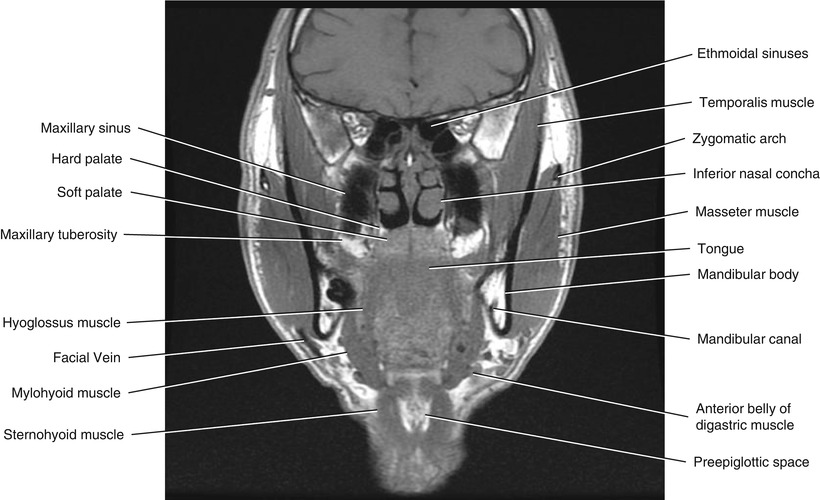
Fig. 5.18
Coronal T1-weighted MRI
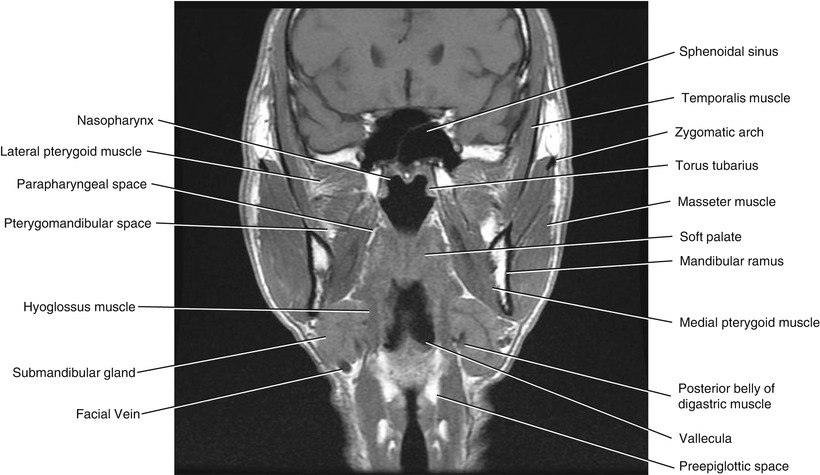
Fig. 5.19
Coronal T1-weighted MRI
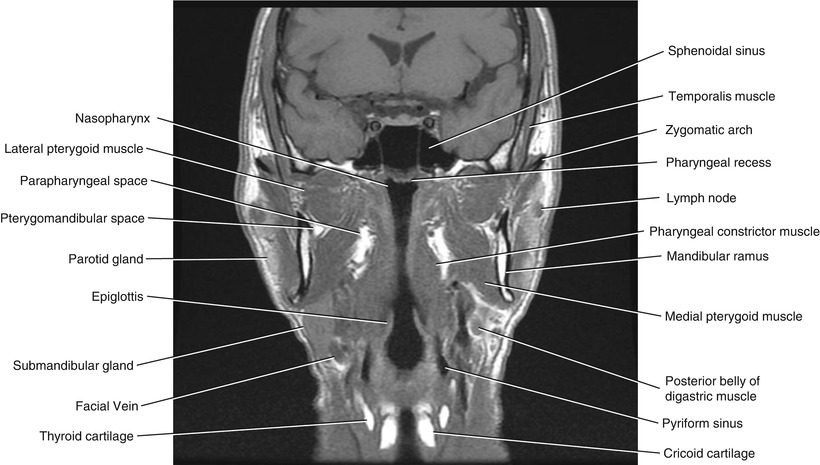
Fig. 5.20
Coronal T1-weighted MRI

Fig. 5.21
Axial CECT
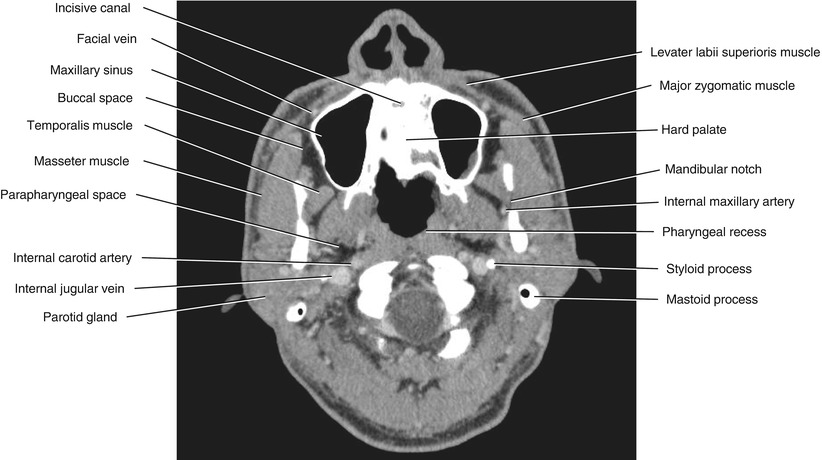
Fig. 5.22
Axial CECT
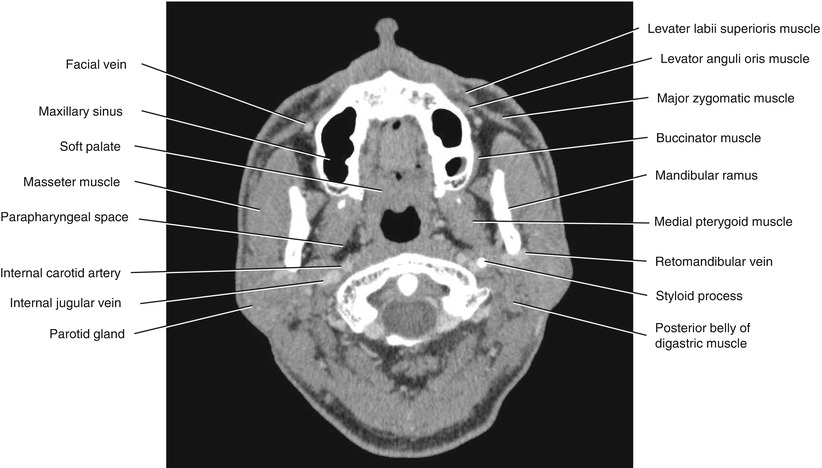
Fig. 5.23
Axial CECT
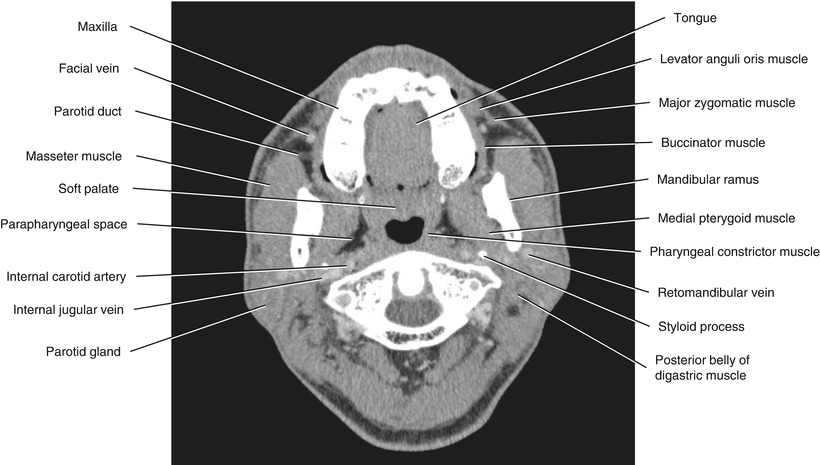
Fig. 5.24
Axial CECT
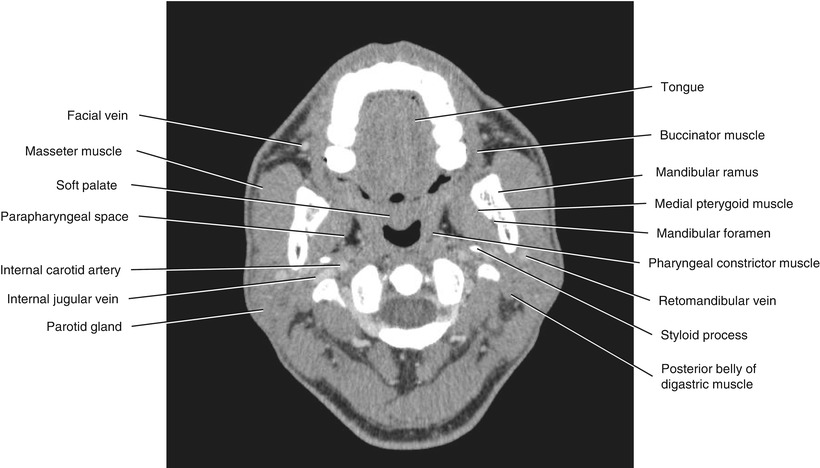
Fig. 5.25
Axial CECT
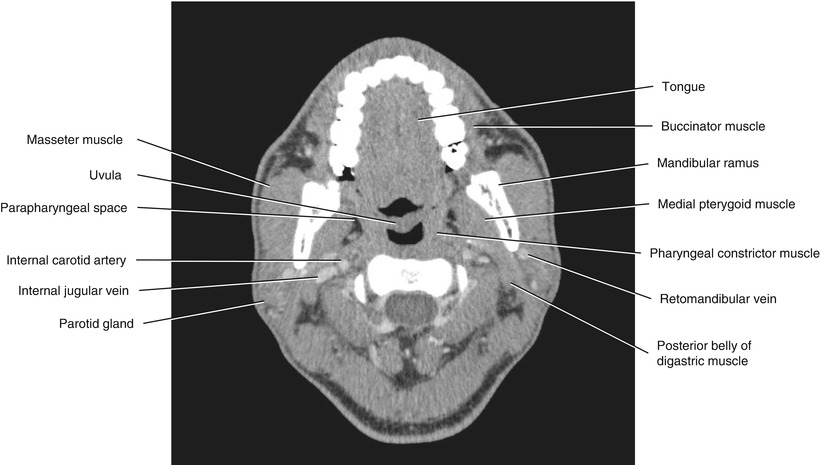
Fig. 5.26
Axial CECT
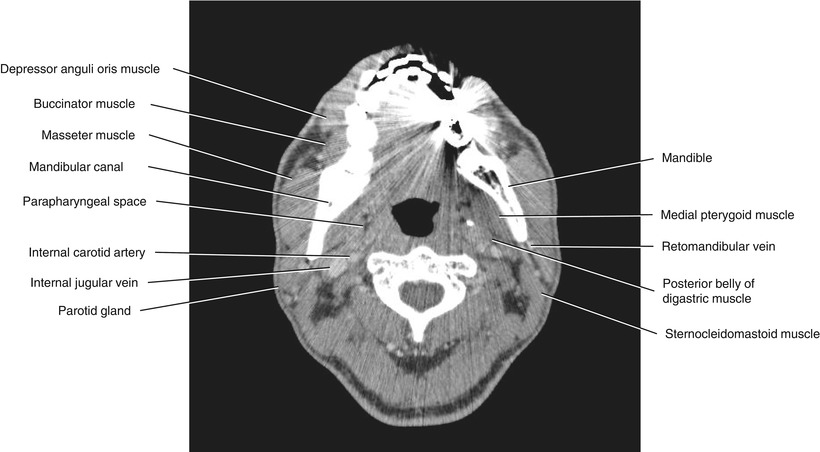
Fig. 5.27
Axial CECT
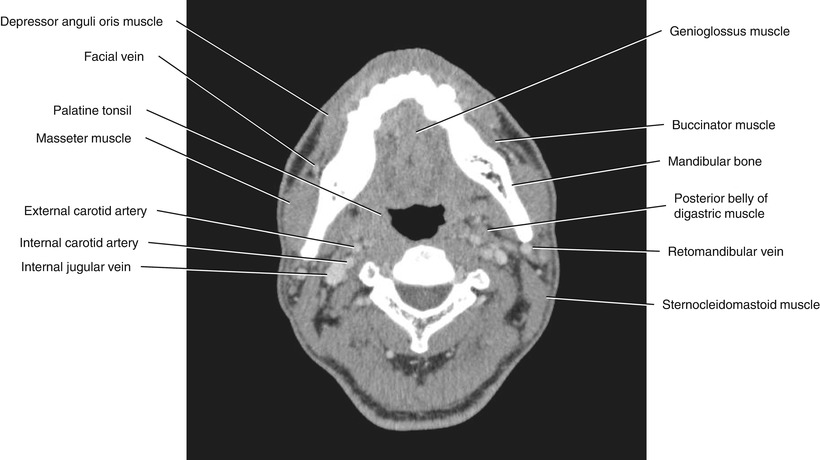
Fig. 5.28
Axial CECT
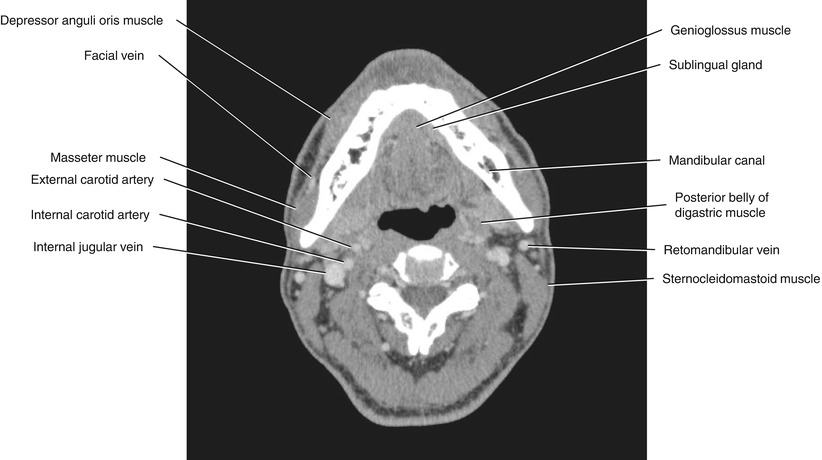
Fig. 5.29
Axial CECT
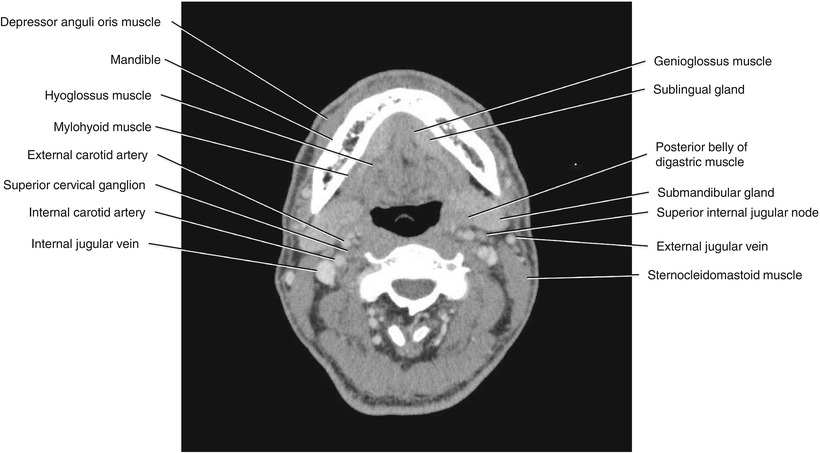
Fig. 5.30
Axial CECT
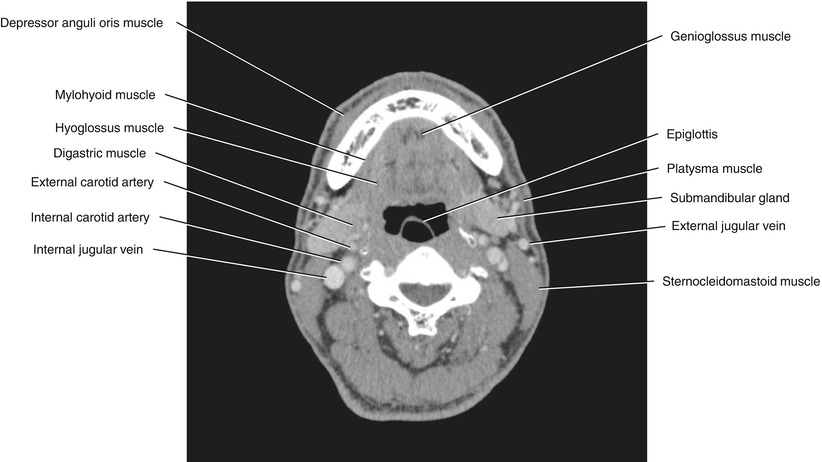
Fig. 5.31
Axial CECT
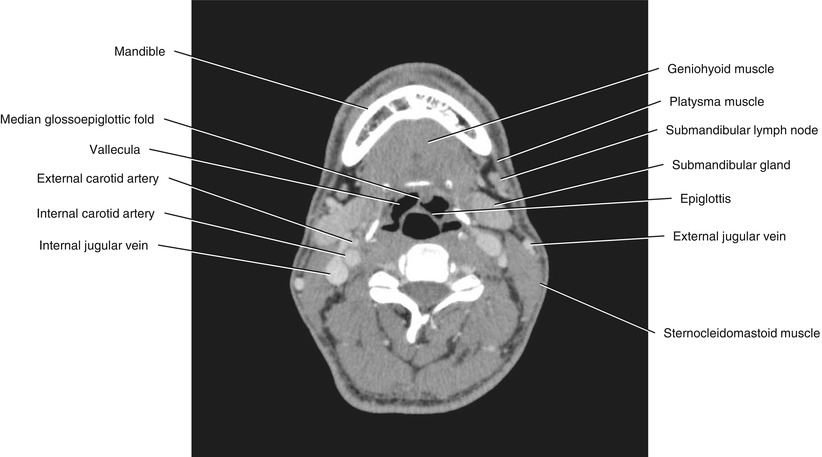
Fig. 5.32
Axial CECT
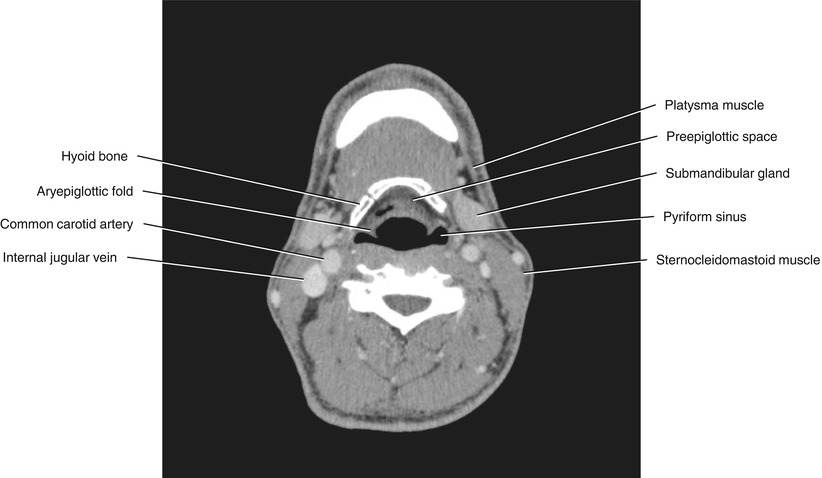
Fig. 5.33
Axial CECT
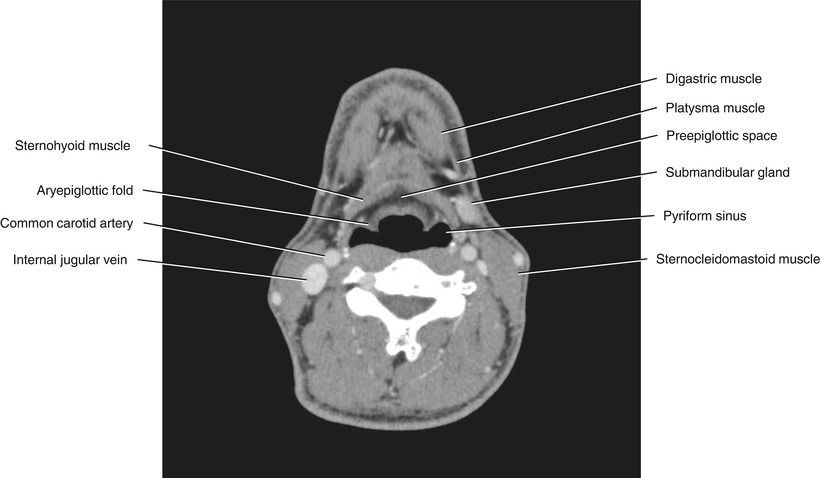
Fig. 5.34
Axial CECT
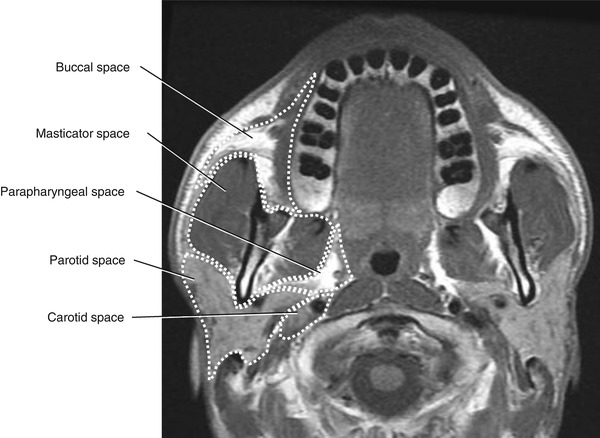
Fig. 5.35
Axial T1-weighted MRI at the level of the maxillary alveolar process
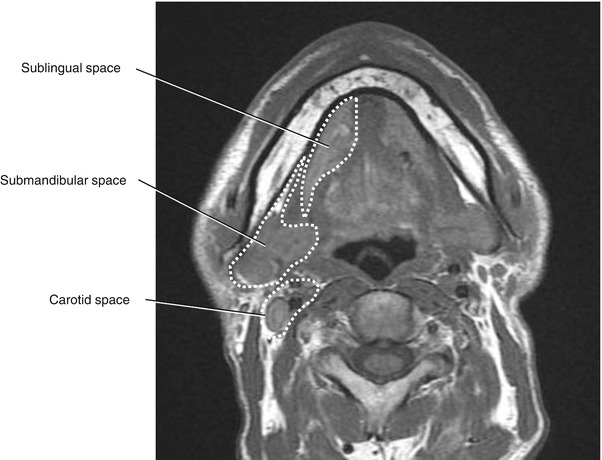
Fig. 5.36
Axial T1-weighted MRI at the level of the mental foramen
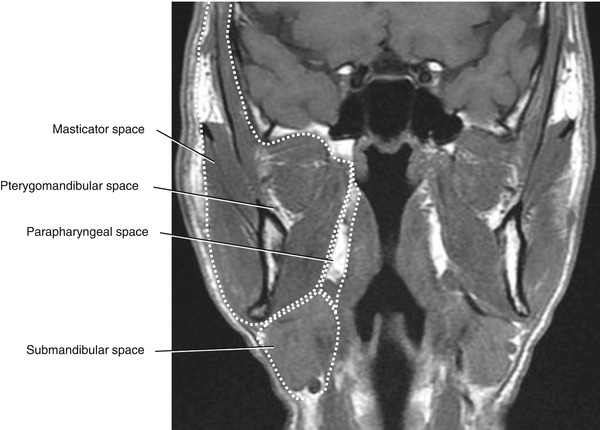
Fig. 5.37
Coronal T1-weighted MRI of the pharyngeal airway
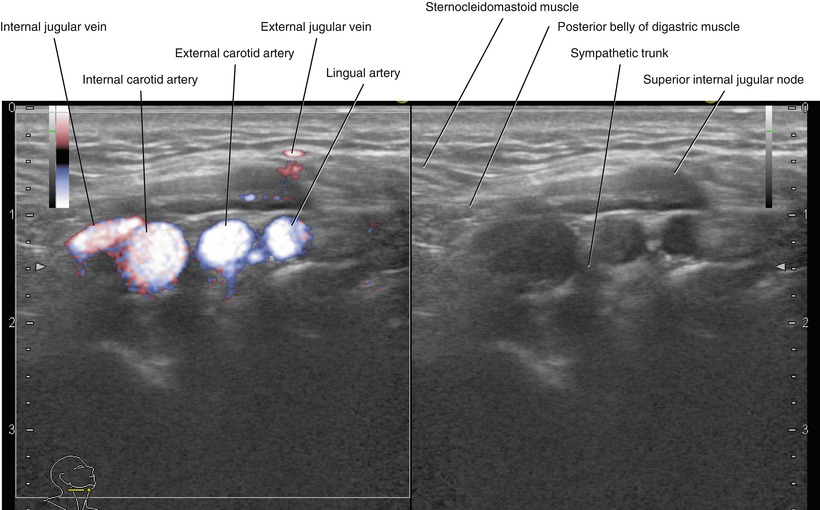
Fig. 5.38
Transverse neck US, right superior internal jugular node (left, fine flow Doppler; right, B-mode)
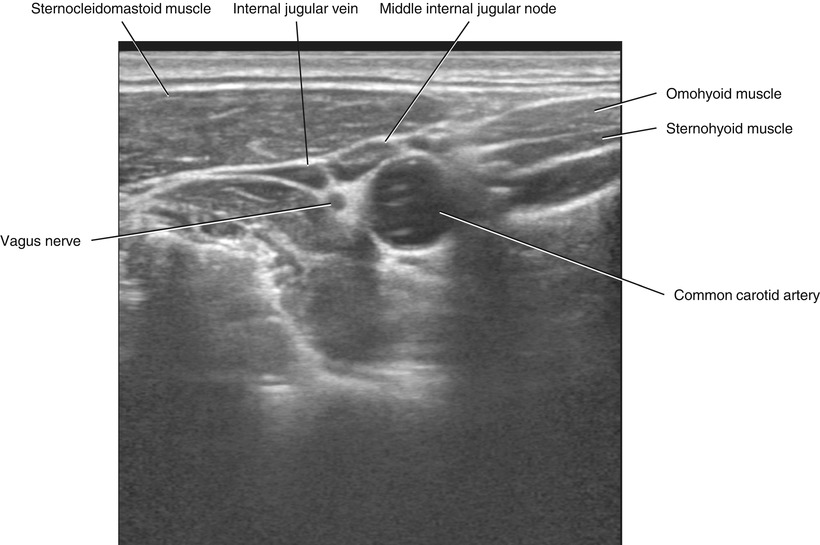
Fig. 5.39
Transverse neck US, right middle internal jugular node
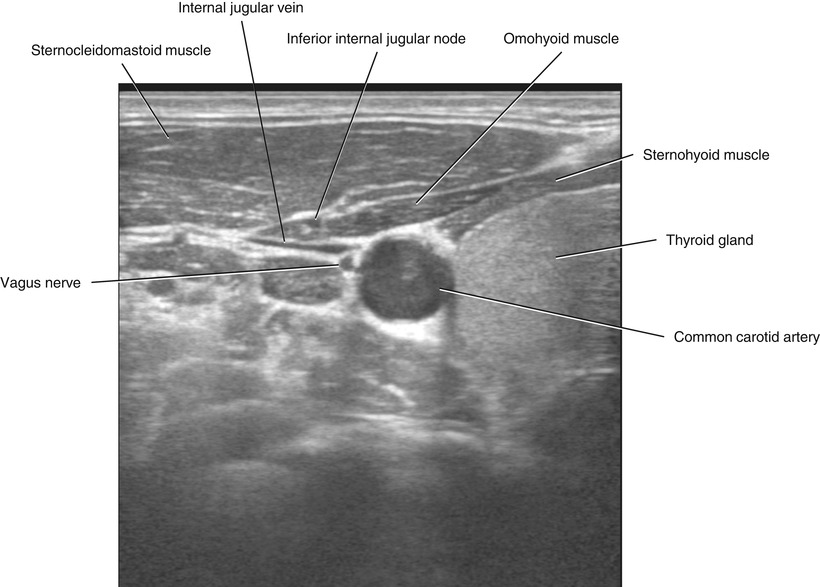
Fig. 5.40
Transverse neck US, right inferior internal jugular node
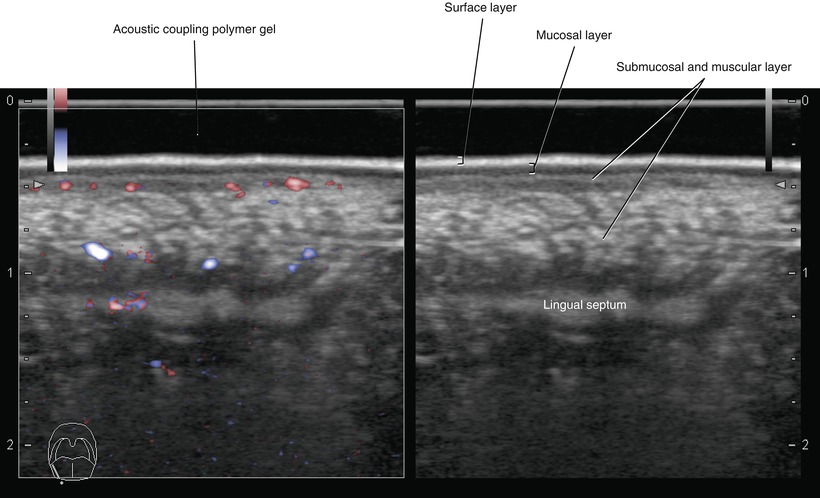
Fig. 5.41
Transverse intraoral US, right lateral margin of the tongue (left, fine flow Doppler; right, B-mode)
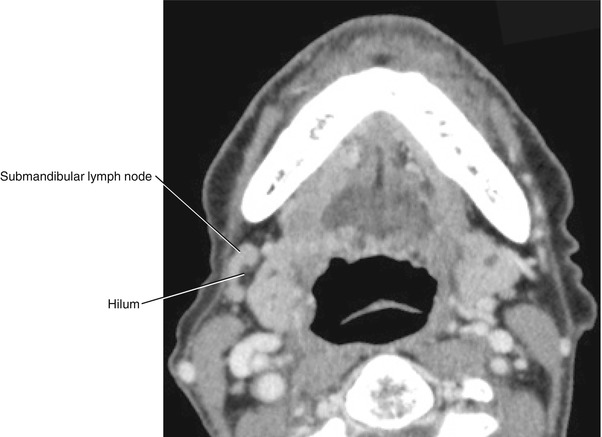
Fig. 5.42
Axial CECT of the right normal submandibular lymph node
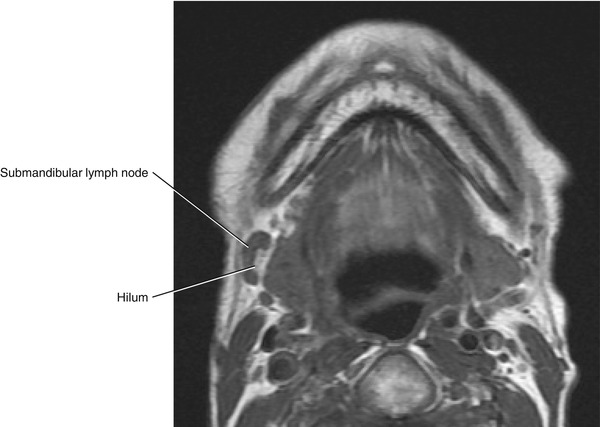
Fig. 5.43
Axial T1-weighted MRI of the right normal submandibular lymph node
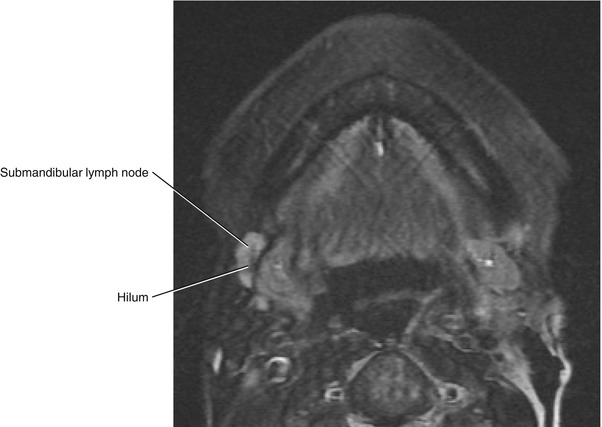
Fig. 5.44
Axial fat-saturated T2-weighted MRI of the right normal submandibular lymph node
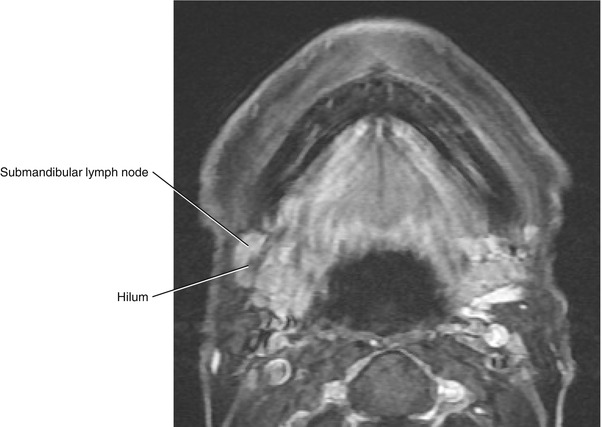
Fig. 5.45
Axial post-contrast fat-saturated T1-weighted MRI of the right normal submandibular lymph node
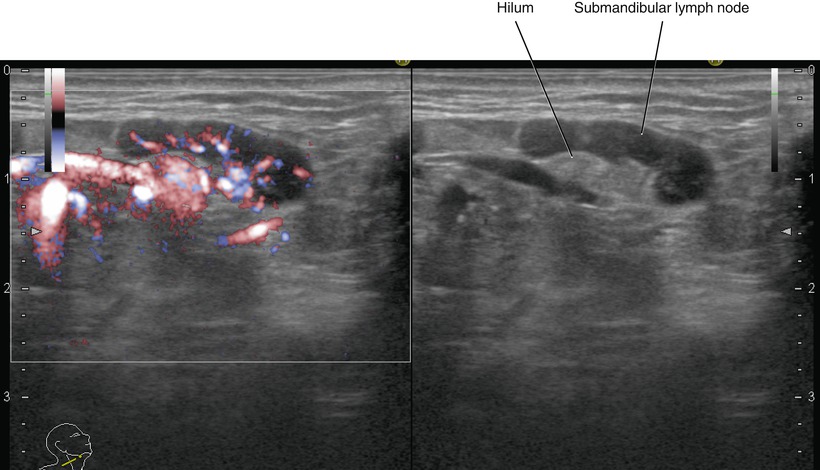
Fig. 5.46
Sagittal ultrasonography of the right normal submandibular lymph node (left, fine flow Doppler; right, B-mode)
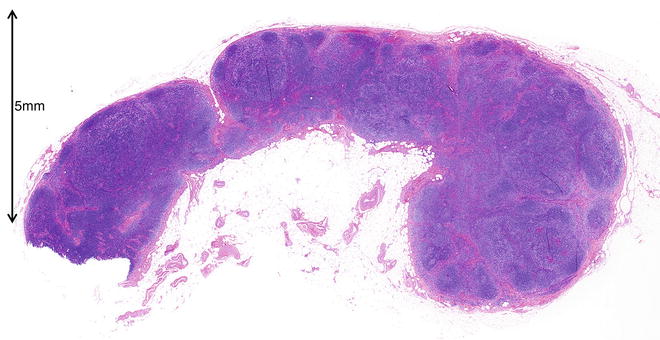
Fig. 5.47
Photomicrograph of histopathological specimen of the right normal submandibular lymph node (hematoxylin-eosin stain)
5.3 Oral Cancer Staging
5.3.1 TNM (UICC Staging)
(Mainly cited from: 2010 American Joint Committee on Cancer Definitions of TNM for the Lip and Oral avity [4])
5.3.2 Primary Tumor (T)
T factor
TX
Primary tumor cannot be assessed
T0
No evidence of primary tumor
Tis
Carcinoma in situ
T1
Tumor 2 cm or less in greatest dimension
T2
Tumor more than 2 cm but not more than 4 cm in greatest dimension
T3
Tumor more than 4 cm in greatest dimension
T4a
Moderately advanced local disease; tumor invades adjacent structures
(according to the 2012 General Rules for Clinical and Pathological Studies on Oral Cancer by the Scientific Committee of Japan Society for Oral Tumors [5]):
1.
Tongue: invasion into the mandibular bone marrow, invasion into the submandibular space, and invasion into the extrinsic muscles of the tongue
2.
Upper gingiva: invasion into the maxillary sinus and nasal cavity and invasion into the buccal space or subcutaneous fat
3.
Lower gingiva: invasion reaching the mandibular canal, invasion into the buccal space or subcutaneous fat, invasion into the submandibular space, and invasion into the extrinsic muscles of the tongue
4.
Buccal mucosa: invasion into the subcutaneous fat, invasion into the maxillary and mandibular bone marrow, and invasion into the maxillary sinus
5.
Floor of the mouth: invasion into the mandibular bone marrow, invasion into the submandibular space, and invasion into the extrinsic muscles of the tongue
6.
Hard palate: invasion into the maxillary sinus and nasal cavity
T4b
Very advanced local disease; tumor invasion into the masticator space, invasion into the pterygoid plate, invasion into the skull base, and invasion circumferentially surrounding the internal carotid artery
5.3.3 Regional Lymph Nodes (N)
The classification and range of cervical lymph nodes are the same as described in the Rules Regarding Lymph Nodes by the Japan Society of Clinical Oncology (JSCO), and lymph node metastasis is evaluated according to the UICC classification. Internationally, the level classification system by the Academy’s Committee for Head and Neck Surgery and Oncology (ACHNSO) based on the area of neck dissection is widely used, and the AAO-HNS classification, a fragmented version of the ACHNSO classification, has also been proposed [5].
N factor
NX
Regional lymph nodes cannot be assessed
N0
No regional lymph node metastasis
N1
Metastasis in a single ipsilateral lymph node, 3 cm or less in greatest diameter
N2
Metastasis in a single ipsilateral lymph node, more than 3 cm but not more than 6 cm in greatest dimension; or in multiple ipsilateral lymph nodes, none more than 6 cm in greatest dimension; or in bilateral or contralateral lymph nodes, none more than 6 cm in greatest dimension
N2a
Metastasis in a single ipsilateral lymph node, more than 3 cm but not more than 6 cm in greatest dimension
N2b
Metastasis in multiple ipsilateral lymph nodes, none more than 6 cm in greatest dimension
N2c
Metastasis in bilateral or contralateral lymph nodes, none more than 6 cm in greatest dimension
N3
Metastasis in a lymph node, more than 6 cm in greatest dimension
5.3.4 Distant Metastasis (M)
M Factor
M0
No distant metastasis
M1
Distant metastasis present
Staging
0
Tis, N0, M0
I
T1, N0, M0
II
T2, N0, M0
III
T3, N0, M0
T1, T2 or T3, N1, M0
IVA
T4a, N0 or N1, M0
T1, T2, T3 or T4a, N2, M0
IVB
Any T, N3, M0
T4a and any N, M0
IVC
Any T and any N M1
Level Classification (Fig. 5.48)
Level IA
Submental lymph nodes; they lie between medial margins of the anterior bellies of the digastric muscles.
Level IB


Submandibular lymph nodes; on each side, they lie lateral to the level IA nodes and anterior to the back of each submandibular gland.
Related posts:

Stay updated, free articles. Join our Telegram channel
Full access? Get Clinical Tree
