CHAPTER 56 Health Literacy
Introduction
Health literacy has been defined as ‘the degree to which individuals have the capacity to obtain, process, and understand basic health information and services needed to make appropriate health decisions.’1 The American Medical Association (AMA) defines it as ‘a constellation of skills including basic reading and numerical tasks required to function in the healthcare environment.’2 These definitions are carefully worded to articulate that health literacy is more than just the ability to read. As our healthcare system gets more complex and as a larger share of responsibility for self-management is moving into patients’ hands, the ability to understand and process complex information is becoming increasingly important. ‘Like a driver trying to reach a destination, a patient must learn how to navigate his or her way to health.’3 A patient must be able to get to appointments on time by reading appointment slips and finding the way to a clinic. He or she must be able to read and fill out clinic forms, communicate with staff, and understand insurance and billing information. The patient also needs to follow directions which are often given in written form, i.e. medication instructions, home care instructions, and follow-up instructions. He or she may be asked to check blood sugars then calculate an insulin dose based on the result. All of this and more is health literacy (Box 56.1).
Health literacy has only recently been the focus of study. A landmark article by Williams et al. in 1995 tested English and Spanish health literacy in patients at public hospitals in Los Angeles and Atlanta. They interviewed patients seeking acute care and excluded anyone whose first language was something other than English or Spanish. In Atlanta they interviewed only English speakers and found that nearly half (47.4%) of them had inadequate (34.7%) or marginal (12.7%) health literacy. The questions on their survey required patients to read things such as appointment slips and prescription instructions and accurately convey what ‘take twice a day,’ meant. In Los Angeles, they found that nearly three quarters (71.7%) of the Spanish-speaking patients, when tested in Spanish, had limited (41.9%) or marginal (19.8%) health literacy.4
There is now strong evidence that low health literacy correlates with poorer health and worse outcomes. The consequences of inadequate health literacy include less health knowledge, poorer health status, higher rates of health services utilization, and higher healthcare costs.5 People with low health literacy are more likely to be hospitalized,6 are less knowledgeable about hypertension goals,7 symptoms of hypoglycemia, and less able to use an inhaler,8 and more likely to report poor health.9 They are also likely to have larger medical bills, largely due to increased hospitalization.5
This mounting evidence has brought health literacy to the attention of government, and providers and organized medicine. In its Unequal Treatment: Confronting Racial and Ethnic Disparities in Health Care the Institute of Medicine highlights health literacy as one of the factors leading to disparities.10 They later developed an entire report on the issue of health literacy.11 The AMA has undertaken a large initiative to develop tools and resources to provide care for patients with low health literacy. They have also produced a book, Understanding Health Literacy, Implications for Medicine and Public Health.12
Immigrants face many barriers to effective healthcare including logistical, cultural, and linguistic.13–16 Although the data are not nearly as robust for immigrant groups, there is every reason to believe that immigrants have higher rates of low health literacy than do US-born people. The impact on immigrants is likely greater as they often have fewer ways to access health information. Low health literacy, compounded by issues of culture, language, and education, means that communication with immigrants is complex. Written materials add more complexity rather than less.
Term Definitions
Health literacy was defined above, but it is important to remember that in this context it implies more than just the ability to read; it also includes the ability to appropriately understand and act on information. A related term is numeracy, also called quantitative literacy. This is the ability to read and understand numbers and perform simple arithmetic. Examples of this include balancing a checkbook, reading a peak flow meter, or using an ATM machine (Box 56.2).
To function in the complex and multidimensional healthcare environment, one must possess a combination of individual-level attributes including abilities in prose, document, and quantitative literacy; ability to engage in two-way communication; skill in media literacy and computer literacy; motivation to receive health information and freedom from impairments and/or communicative assistance from others (surrogate reader).12
The Test of Functional Health Literacy in Adults (TOFHLA)17 is a frequently used test of health literacy and numeracy. It categorizes patients into inadequate, marginal, or adequate health literacy. People who score in the inadequate range often misread dosing instructions on medicine bottles, appointment slips, and phone numbers. Those who score in the marginal range can do the above tasks, but struggle with other information on medicine bottles (i.e. take 2 hours after eating) and legal documents such as a Medicaid rights and responsibilities handout. Those in the highest category, adequate health literacy, may still have trouble with more complex documents such as informed consent and financial eligibility.17
Not only are the health literacy terms confusing, so too are the words that describe immigrants. Here the author will use the terms immigrants and foreign-born interchangeably. Limited English proficiency (LEP) typically refers to someone whose primary language is not English, and struggles some in English. ESL means English as a second language. ELL refers to English language learners. It is important to remember that there are many ESL and ELL people in the US who are not immigrants nor foreign born. Interestingly, according to the National Assessment of Literacy, if one is born in the US, but English is your second language, your literacy is likely to be the same as that of a US-born English speaker. This is also true of immigrants who arrive before age 12. This seems to be an effect of the US education system.18 It is also important to remember that some immigrants come from English-speaking countries (Jamaica, India, Liberia) and are therefore not ESL or LEP. They still may struggle with health literacy, however.
Health Literacy in Immigrants
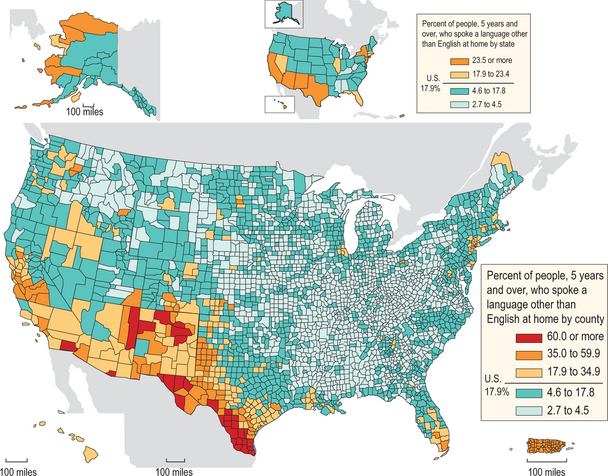
There has been a rapid increase in the number of non-native English speakers in the US. In the 2000 census, nearly 18% of the US population reported speaking a language other than English at home, up from 14% in the 1990 census. Twenty-three percent of this group said they speak English not well or not at all. Over two-thirds of these non-native English speakers speak Spanish and the other 30% have an amazing variety of more than 300 languages. The census also reports that there are 31 million foreign-born in the US and that 47 million citizens and non-citizens speak a language other than English at home (Figs 56.1, 56.2, 56.3).19
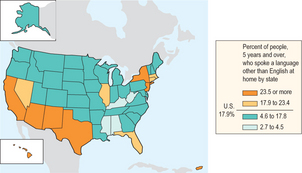
Figure 56.1 Percentage of people 5 years and over who spoke a language other than English at home by state.
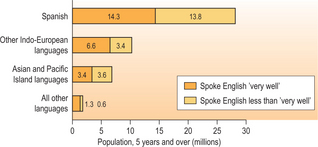
Figure 56.2 Speakers of languages other than English at home and English ability by language group, 2000.
One question to raise with the Ecuadorian colonoscopy patient (see Box 56.1, above) is, ‘Did they give him his instruction in English or Spanish?’ This begs the question, when studying health literacy in immigrants, if we should look at their English health literacy, or literacy in their native tongue? The answer may depend on the context of care. If a healthcare environment is entirely in English with all English signs, all English forms, and all English prescription bottles, then English literacy must be what we care about. If, however, the healthcare environment is providing information in another language then we must address the immigrant’s literacy in the native tongue.
Therefore, for the one in five US residents who don’t speak English in their home, we have only partial data. The National Assessment of Adult Literacy (NALS) from 1993 is the best source of information for the foreign-born. In this US-wide survey of general literacy in immigrants and US-borns, questions were asked about education level, immigration history, language spoken at home, and self-reported literacy in English and a native tongue. Literacy in English and Spanish was measured, but not literacy in other languages.18 The survey was re-done in 2003 and renamed NAAL, National Assessment of Adult Literacy. To date there is only some analysis of ESL people in the updated survey. There were marginal improvements in most of the groups, but a slight decline in literacy in Spanish speakers. Their English-language literacy is shown in Figure 56.4.
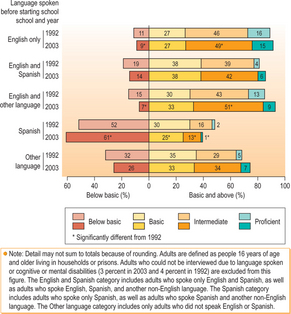
Figure 56.4 Percentage of adults in each prose literacy level, by language spoken before starting school, 1992 and 2003.
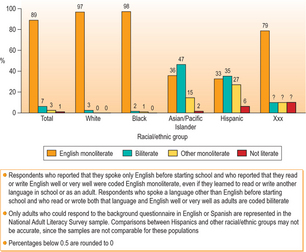
From this point on the author will refer only to the 1993 NALS data, as there is much more analysis than for the later 2003 data. Overall, in NALS few people described themselves as illiterate; however, of those that did, most appeared to be ESL. ‘When we defined literacy using people’s self-assessment of their reading and writing skills, at least 95% of the non-literate population of the United States spoke a language other than English before starting school.’18
NALS has limited demographic breakdown for respondents, but these data showed that 6% of Hispanics report they are illiterate compared with 2% Asian/Pacific Islanders and 0% of whites or blacks. However, 16% of Asian/Pacific Islanders reported literacy only in their native tongue. In fact, 0% of the US-born respondents said that they are illiterate. The national estimates of illiteracy are much higher than this. It is unclear whether immigrants are more or less likely to accurately report illiteracy, but like the US-born, the foreign-born are likely to have much higher illiteracy rates than they self-report (Fig. 56.5).
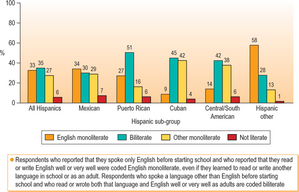
Within the Hispanic group, there was variation by country of origin. Seven percent of Mexicans, 6% of Puerto Ricans and South and Central Americans, and 4% of Cubans reported they were illiterate in any language. Twenty-seven percent of Hispanics reported they were literate only in Spanish and 42% of Cubans reported Spanish-only literacy (Fig. 56.6).
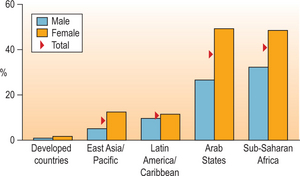
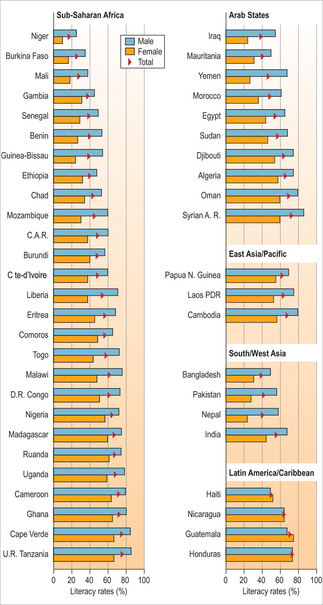
There are wide variations in educational attainment and literacy across the world. There are also likely differences between immigrant groups who choose to move and refugees whose lives and education have been disrupted. The UN reports literacy rates across countries. Figure 56.7 shows a sample of that information. Worldwide, men have higher literacy rates than women. There are wide differences between literacy rates, with a low of 10% to a high of nearly 100%. Therefore, it is difficult to make generalizations about immigrants.20 However, Figure 56.8 points out some clear trends by region of the world. In many developing countries the average female literacy rate is about 50% compared with rates in developed countries in the 90% range.
This education effect explains many of the differences found in the literacy testing. For example, if people immigrate to the US before the age of 12, they are likely to have a much higher level of literacy. In fact, there is no measurable difference in measured literacy between US-born adults and immigrants who arrived prior to age 12. This effect is likely due to greater exposure to the US education system and increased English fluency. These young arrivals are also more likely to complete high school than those who come to the US between the ages of 12 and 18. The education effect also explains differences between immigrant groups. For example, Hispanics were less likely to speak, read, and write English, in part because Hispanic immigrants have, on average, less education than immigrants from non-Spanish-language countries.18
Education prior to arrival in the US is also strongly correlated with literacy attained here. The majority of immigrants who reported fluency and literacy only in their non-English native tongue completed less than 9 years of education prior to arrival in the US. Also, having little or no pre-immigration education is strongly associated with not being able to read or write in any language.18
Immigrants not only start with less education, but are also less likely to complete education in the US. US-born adults have higher levels of education attainment, are more likely to have completed high school, and are more likely to have attended some college.18
However, on average, immigrants and refugees have higher levels of education than those that stay at home. This is true for all countries that immigrants come from except Puerto Rico, where those that move to the mainland US tend to have lower rates of education. There is variation, however; immigrants from Asia tend to have much higher education rates than Asians that stay at home, while the difference is much less pronounced in Latin American and Caribbean immigrants.21
NALS also helps understand the interplay between language spoken at home and English literacy. English is not the primary language spoken in the homes of 41% of Hispanics, 34% of Koreans, 29% of Vietnamese, and 20% of Chinese.18 Not surprisingly, there is a strong correlation with speaking some English while growing up at home and being literate in English as an adult. Regardless of the language at home, Spanish, Asian, or European, if the non-English language was the only one spoken in the house while a child, that child will have lower English literacy than those who grew up in a bilingual home.18 However, not all bilingual backgrounds were the same. Those growing up in a bilingual home with English and an Asian or a European language had on average comparable English literacy skills to the English-speaking native-born. Those from bilingual Spanish and English homes tend to have lower English literacy than native English speakers.18
Being bilingual did not equate to being biliterate. The average score of self-reported biliterate immigrants placed them in level 2 literacy proficiency. English monoliterates averaged level 3 literacy pro ficiency.18 This was true across all racial and ethnic designations, with black and Hispanic biliterates scoring the lowest.
Hispanics were less likely than those from other ethnic groups to claim proficiency in spoken and written English. Hispanics were more likely to retain exclusive use of Spanish than were native speakers of other non-English languages. Hispanics were less likely to speak, read, and write English because Hispanic immigrants were less educated than immigrants from non-Spanish-language countries.18

Stay updated, free articles. Join our Telegram channel

Full access? Get Clinical Tree


