Epidemiologic Methods
Xiaomei Ma
Herbert Yu
INTRODUCTION
Epidemiology is the study of the distribution and determinants of health-related states or events in specified populations and the application of this study to control health problems.1 Epidemiologic principles and methods have long been applied to cancer research, with the assumptions that cancer does not occur at random and the nonrandomness of carcinogenesis can be elucidated through systematic research. An example of such applications is the lung cancer study conducted by Doll and Hill in the early 1950s, which linked tobacco smoking to an increased mortality of lung cancer in over 40,000 medical professionals in the United Kingdom.2 The observation from this study and many other studies, in conjunction with laboratory findings regarding the underlying biologic mechanisms for the effect of tobacco smoking, helped establish the role of tobacco smoking in the etiology of lung cancer. Epidemiologic methods are also used in clinical settings, where trials are conducted to evaluate the efficacy of new treatment protocols or preventive measures and where observational studies of prognostic factors are done.
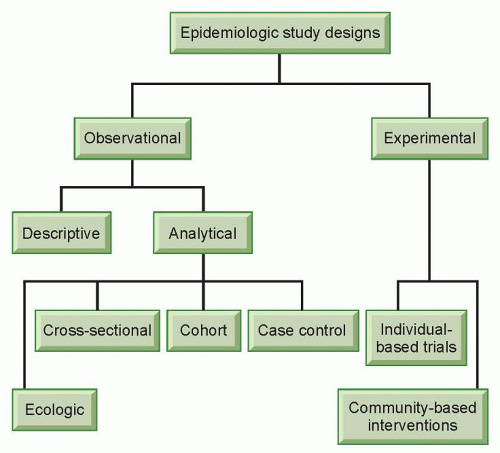
Epidemiologic studies can take different forms, but generally they can be classified into two broad categories, observational studies and experimental studies (Fig. 11.1). In experimental studies, an investigator allocates different study regimens to the subjects, usually with randomization (experimental studies without randomization are sometimes referred to as “quasi-experiments”).3 Experimental studies can be individual based or community based. An experimental study most closely resembles laboratory experiments in that the investigator has control over the study condition. Experimental studies can be used to evaluate the efficacy of a treatment protocol (e.g., low-dose compared with standard-dose chemotherapy for non-Hodgkin’s lymphoma)4 or preventive measures (e.g., tamoxifen for women at an increased risk of breast cancer).5 Although experimental studies are often considered the “gold standard” because of well-controlled study situations, they are only suitable for the evaluation of effects that are beneficial or at least not harmful due to ethical concerns. Experimental studies are discussed in detail in other chapters of this book. This section will focus on observational studies.
Observational studies do not involve the artificial manipulation of study regimens. In an observational study, an investigator stands by to observe what happens or happened to the subjects, in terms of exposure and outcome. Observational studies can be further divided into descriptive and analytical studies (see Fig. 11.1). Descriptive studies focus on the distribution of diseases with respect to person, place, and time (i.e., who, where, and when), whereas analytical studies focus on the determinants of diseases. Descriptive studies are often used to generate hypotheses, whereas analytical studies are often used to test hypotheses. However, the two types of studies should not be considered mutually exclusive entities; rather, they are the opposite ends of a continuum. Descriptive studies are discussed in detail in other chapters of this book.
ANALYTICAL STUDIES
Ecologic Studies
As in experimental studies, the unit of analysis can be individuals or groups of people in observational studies. Studies that use groups of people as the unit of analysis are called ecologic studies, which are relatively easy to carry out when group level measures are available. However, a relationship observed between variables on a group level does not necessarily reflect the relationship that exists at an individual level. For example, the fraction of energy supply from animal products was found to be positively correlated with breast cancer mortality in a recent ecologic study, which used preexisting data on both dietary supply and breast cancer mortality rates from 35 countries.6 Because the data were country based, no reliable inference can be made at an individual level. Within each country, it could be that the people who had a low fraction of energy supply from animal products were actually dying from breast cancer. Results from ecologic studies are useful for inference at an individual level only when the within-group variability of the exposure is low so that a group-level measure can reasonably reflect exposure at an individual level. Alternatively, if the implications for prevention or intervention are at a group level (e.g., taxation of cigarettes to reduce smoking), results from ecologic studies are very useful.
Cross-Sectional Studies
There are three main types of analytical studies in which the unit of analysis is individuals: cross-sectional, cohort, and case-control studies. In a cross-sectional study, the information on various factors is collected from the study population at a given point in time. From a public health perspective, data collected in cross-sectional studies can be of great value in assessing the general health status of a population and allocating resources. For example, the National Health and Nutrition Examination Survey has provided valuable national estimates of health and nutritional status of the US civilian, noninstitutionalized population.7 Findings from cross-sectional studies can also help generate hypotheses that may be tested later in other types of studies. However, it should be noted that cross-sectional studies have serious methodologic limitations if the research purpose is etiologic inference. Because exposures and disease status are evaluated simultaneously, it is usually not possible to know the temporality of events unless the exposure cannot change over time (e.g., blood type, skin color, race, country of birth). If one observes that more brain cancer patients are depressed than people without brain cancer in a cross-sectional study, the correlation does not necessarily mean that depression causes brain cancer. Depression may simply have resulted from the pathogenesis and diagnosis of brain cancer, or depression may
have caused brain cancer in some patients and resulted from brain cancer in other patients. Without additional information on the timing of events, no conclusions can be made. Another concern in cross-sectional studies is the enrollment of prevalent cases, who survived different lengths of time after the incidence of disease. Factors that affect survival may also influence incidence. Prevalent cases may not be representative of incident cases, which makes etiologic inferences based on cross-sectional studies suspect at best.
have caused brain cancer in some patients and resulted from brain cancer in other patients. Without additional information on the timing of events, no conclusions can be made. Another concern in cross-sectional studies is the enrollment of prevalent cases, who survived different lengths of time after the incidence of disease. Factors that affect survival may also influence incidence. Prevalent cases may not be representative of incident cases, which makes etiologic inferences based on cross-sectional studies suspect at best.
Cohort Studies
In a cohort study, a study population free of a specific disease (or any other health-related condition) is grouped based on their exposure status and followed up for a certain period of time. Then the exposed and unexposed subjects are compared with respect to disease status at the end of the follow-up. The objective of a cohort study is usually to evaluate whether the incidence of a disease is associated with an exposure. The cohort design is fundamental in observational epidemiology and is considered “ideal” in that, if unbiased, cohort data reflect the real-life cause/effect sequence of disease.8 Subjects in cohort studies may be a sample of the general population in a geographic area, a group of workers who are exposed to certain occupational hazards in a specific industry, or people who are considered at a high risk for a specific disease. A cohort study is considered prospective or concurrent if the investigator starts following up the cohort from the present time into the future, and retrospective or historical if the cohort is established in the past based on existing records (e.g., an occupational cohort based on employment records) and the follow-up ends before or at the time of the study. Alternatively, a cohort study can be ambidirectional in that data collection goes both directions.9 Whether a cohort study is prospective, retrospective, or ambidirectional, the key feature is that all the subjects were free of the disease at the beginning of the follow-up and the study tracks the subjects from exposure to disease. Follow-up time, ranging from days to decades, is an essential element in cohort studies.
In a cohort study, the incidence of disease in the exposed group and the unexposed group is compared. The incidence measure can be cumulative incidence or incidence density, depending on the availability of data. When comparing the incidence in the two groups, both relative differences and absolute differences can be assessed. In cohort studies, the relative risk of developing the disease is expressed as the ratio of the cumulative incidence in the exposed group to that in the unexposed group, which is also called cumulative incidence ratio or risk ratio. If we have data on the exact person-time of follow-up for every subject, we can also calculate an incidence density ratio (also called rate ratio) in a similar way. The numeric value of the risk or rate ratio reflects the magnitude of the association between an exposure and a disease. For example, a risk ratio of 2 would be interpreted as exposed individuals have a doubled risk of developing a disease than unexposed individuals, whereas a risk ratio of 5 indicates that exposed individuals have 5 times the risk of developing a disease compared with unexposed individuals. To put in another way, a factor with a risk ratio of 5 has a stronger effect than another factor with a risk ratio of 2. In addition to risk ratio and rate ratio, another relative measure called probability odds ratio can be calculated in cohort studies. The probability odds of disease is the number of subjects who developed a disease divided by the number of subjects who did not develop the disease, and the probability odds ratio is the probability odds in the exposed group divided by the probability odds in the unexposed group. Many investigators prefer risk ratio or rate ratio to probability odds ratio in cohort studies, because the ability to directly measure the risk of developing a disease is one of the most significant advantages in cohort studies. In practice, however, a probability odds ratio is often used as an approximation for risk or rate ratio, especially when multivariate logistic regression models are employed to adjust for the effect of other factors that may influence the relationship between an exposure and a disease.
As for absolute differences, a commonly used measure is called attributable risk in the exposed, which is the incidence in the exposed group minus the incidence in the unexposed group. Attributable risk reflects the disease incidence that could be attributed to the exposure in exposed individuals and the reduction in incidence that we would expect if the exposure can be removed from the exposed individuals, provided that there is a causal relationship between the exposure and the disease. Another absolute measure called population attributable risk extends this concept to the general population; it estimates the disease incidence that could be attributed to an exposure in the general population. Because both relative and absolute differences can be assessed in cohort studies, a natural question to ask is what measures to choose. In general, the relative differences are used more often if the main research objective is etiologic inference, and they can be used for the judgment of causality. Once causality is established, or at least assumed, measures of absolute differences are more important from a public health perspective. This point can be illustrated using the following hypothetical example. Assume the following: toxin X in the environment triples the risk of bladder cancer and toxin Y doubles the risk of bladder cancer, the effects of X and Y are entirely independent of each other, the prevalence of exposure to toxin Y in the general population is 20 times higher than the prevalence of exposure to toxin X, and there are only resources available to reduce the exposure to one toxin. It would be more effective to use the resources to reduce the exposure to toxin Y instead of toxin X. This is because the population attributable risk due to Y is higher than that due to X, although the risk ratio associated with toxin Y is smaller than that associated with toxin X.
Cohort studies have many advantages. A cohort design is the best way to study the natural history of a disease.9 There is usually a clear temporal relationship between an exposure and a disease because all the subjects are free of the disease at the beginning of the follow-up (it can be a problem if a subject has a subclinical disease such as undetected prostate cancer). Furthermore, multiple diseases can be studied with respect to the same exposure. On the other hand, cohort studies, especially prospective cohort studies, are costly in terms of both time and money. A cohort design requires the follow-up of a large number of study participants over a sometimes extremely lengthy period of time and usually extensive data collection through questionnaires, physical measurements, and/or biologic specimens at regular intervals. Participants may be
“lost” during the follow-up because they became tired of the study, moved away from the study area, or died from some causes other than the disease under study. If the subjects who were lost during the follow-up are different from those who remained under observation with respect to exposure, disease, or other factors that may influence the relationship between the exposure and the disease, results from the study may be biased. To date, cohort studies have been used to study the etiology of a wide spectrum of diseases, including different types of cancer. If a cohort study is conducted to evaluate the etiology of cancer, usually the study sample size would need to be very large (such as the National Institutes of Health-AARP Diet and Health Study, which included more than half million subjects10) and the follow-up time would need to be long, unless the cohort selected is a high-risk population.
“lost” during the follow-up because they became tired of the study, moved away from the study area, or died from some causes other than the disease under study. If the subjects who were lost during the follow-up are different from those who remained under observation with respect to exposure, disease, or other factors that may influence the relationship between the exposure and the disease, results from the study may be biased. To date, cohort studies have been used to study the etiology of a wide spectrum of diseases, including different types of cancer. If a cohort study is conducted to evaluate the etiology of cancer, usually the study sample size would need to be very large (such as the National Institutes of Health-AARP Diet and Health Study, which included more than half million subjects10) and the follow-up time would need to be long, unless the cohort selected is a high-risk population.
For simplicity, we have discussed cohort studies in which the outcome of interest is the incidence of a specific disease and there are only two exposure groups. In practice, any health-related event can be the outcome of interest, and multiple exposure groups can be compared.
Case-Control Studies
Case-control design is an alternative to cohort design for the evaluation of the relationship between an exposure and a disease (or any other health condition). A case-control approach compares the odds of past exposure between cases and noncases (controls) and uses the exposure odds ratio as an estimate for relative risk. A primary goal in a case-control study is to reach the same conclusions as what would have been obtained from a cohort study, if one had been done.11 If appropriately designed and conducted, a case-control study can optimize speed and efficiency as the need for follow-up is avoided.8 The starting point of a case-control study is a source population from which the cases arise. Instead of obtaining the denominators for the calculation of risks or rates in a cohort study, a control group is sampled from the entire source population. After selecting control subjects, who ideally would have become cases had they developed the disease, an investigator collects data on past exposures from both the cases and the controls and then calculates an odds ratio, which is the odds of exposure in the cases divided by the odds of exposure in the controls.
There are two main types of case-control studies: case-based case-control studies and case-control studies within defined cohorts.8 Some variations of the case-control design also exist. For instance, if the effect of an exposure is transient, sometimes a case can be used as his/her own control (case cross-over design). In case-based case-control studies, cases and controls are selected at a given point in time from a hypothetical cohort (e.g., at the end of follow-up). A cross-sectional ascertainment of cases will result in a case group that mostly contains prevalent cases who may have survived for different lengths of time after disease incidence. Cases who died before an investigator began subject ascertainment would not be eligible to be included in the study. As a result, the cases finally included in the study may not be representative of all the cases from the entire hypothetical cohort. Another disadvantage of enrolling prevalent cases is that cases that were diagnosed a long time ago will likely have difficulties recalling exposures that occurred before the disease incidence. In case-control studies, it is preferable to ascertain incident cases as soon as they are diagnosed and to select controls as soon as cases are identified. Case-control studies that enroll only incident cases are sometimes called prospective case-control studies because the investigators need to wait for the incident cases to develop and get diagnosed. For cancer studies, the cases can be ascertained from population-based cancer registries or hospitals. A major advantage of using a cancer registry is the completeness of case ascertainment; however, the reporting of cancer cases to registries is usually not instantaneous. There could be a lag time of several months or even over a year, and some cases could have died during the lag time. If the cancer under study has a poor survival rate and/or clinical specimens need to be obtained in a timely manner, it may be preferable to identify cases directly from hospitals using a rapid ascertainment protocol. As for the selection of controls, the key issue is that controls should be representative of the source population from which the cases arise and, theoretically, the controls would have been ascertained as cases had they developed the disease. The most common types of controls include population-based controls (often selected through random digit dialing in case-control studies of cancer etiology), hospital controls, and friend controls. The advantages and disadvantages of different types of controls have been nicely summarized by Wacholder et al.12 Because no follow-up is involved in case-based case-control studies, the incidence risk or rate cannot be calculated directly for case and control groups. The odds ratio will be a good estimate of relative risk if the disease is uncommon.
In addition to case-based case-control studies, there are also case-control studies within defined cohorts (also known as hybrid or ambidirectional designs), including case-cohort studies and nested case-control studies. In case-cohort studies, cases are identified from a well-defined cohort after some follow-up time, and controls are selected from the baseline cohort. In nested case-control studies, cases are also identified from a cohort, but controls are selected from the individuals at risk at the time each case occurs (i.e., incidence density sampling).8 In these types of designs, controls are a sample of the cohort and the controls selected can theoretically become cases at some point. The possibility of selection bias in case-control studies within defined cohorts is lower than that in case-based case-control studies because the cases and the controls are selected from the same source population. Because of an increased awareness of the methodological issues inherent in the design of case-based case-control studies and the availability of a growing number of large cohorts, case-control studies within defined cohorts have become more common in recent years. The advantage of case-control studies within cohorts over traditional cohort studies is mainly the efficiency in additional data collection. For instance, a recent nested case-control study evaluated the relationship between endogenous sex hormones and prostate cancer risk.13 Instead of measuring the serum hormones levels of the entire cohort (over 12,000 subjects), investigators chose to measure 300 cases and 300 controls selected from the cohort. Doing so not only significantly reduced the cost of measurements and the time it took to address the research question, but also helped preserve valuable serum samples for possible analyses in the future. In a case-cohort design, an odds ratio estimates risk ratio; in a nested case-control design, an odds ratio estimates rate ratio. In both designs, the disease under study does not have to be rare for the odds ratio to be a good estimate of the risk ratio or rate ratio.8,14
The biggest advantage of a case-control design is the speed and efficiency of obtaining data. It is claimed that investigators implement case-control studies more frequently than any other analytical epidemiologic study.15 Because most types of cancer are uncommon and take a long time to develop, to date, most epidemiologic studies of cancer have been case-control instead of cohort in design. A case-control study can be conducted to evaluate the relationship between many different exposures and a specific disease, but the study will have limited statistical power if the exposure is rare. In general, a case-control design tends to be more susceptible to biases than a cohort design. Such biases include, but are not limited to, selection bias when choosing and enrolling subjects (especially controls) and recall bias when obtaining data from the subjects. The status of the subjects—that is, case or control—may affect how they recall and report previous exposures, some of which occurred years or even decades ago. It is important for investigators to explicitly define the diagnostic and eligibility criteria for cases, to select controls from the same population as the cases independent of the exposures of interest, to blind data collection staff to the case or control status of subjects and/or the main hypotheses of the study, to ascertain exposure in a similar manner from cases and controls, and to take into account other
factors that may influence the relationship between an exposure and a disease.15
factors that may influence the relationship between an exposure and a disease.15
INTERPRETATION OF EPIDEMIOLOGIC FINDINGS
We have discussed measures of effects in various study designs. However, a risk ratio of 3 from a cohort study or an odds ratio of 2.5 from a case-control study does not necessarily mean that there is an association between an exposure and a disease. Several alternative explanations need to be assessed, including chance (random error), bias (systematic error), and confounding. Potential interaction also needs be evaluated.
Statistical methods are required to evaluate the role of chance. A usual way is to calculate the upper and lower limits of a 95% confidence interval around a point estimate for relative risk (risk ratio, rate ratio, or odds ratio). If the confidence interval does not include one, one would say that the observed association is statistically significant; if the confidence interval includes one, one would say that the observed relationship is not statistically significant. The width of a confidence interval is directly related to the number of participants in a study, which is called sample size. A larger sample size leads to less variability in the data, a tighter confidence interval, and a higher possibility in finding a statistically significant association if one truly exists. A 95% confidence interval means that if the data collection and analysis could be replicated many times, the confidence interval should include the correct value of the measure 95% of the time.16 It is better to consider a confidence interval to be a general guide to the amount of random error in the data but not necessarily a literal measure of statistical variability.16
Bias can be defined as any systematic error in an epidemiologic study that results in an incorrect estimate of the association between exposure and disease, and it can occur in every type of epidemiologic study design. There are two main types of bias: selection bias and information bias. Selection bias is present when individuals included in a study are systematically different from the target population. For example, a selection bias would occur if a study aimed to generate a sample representing all women in the United States, but of the women contacted, more with a family history of breast cancer agreed to participate. This sample would be at a higher risk for breast cancer than the target population. Refusal to participate poses a constant challenge in epidemiologic studies. As individuals have become more concerned about privacy issues and as studies have become more demanding of time, biologic specimens, and other impositions, participation rates have dropped substantially in recent years. If nonparticipants are different from the participants with respect to study-related characteristics, the validity of the study is threatened. Information bias occurs when the data collected from the study subjects are erroneous. Information bias is also known as misclassification if the variable is measured on a categorical scale and the error causes a subject to be placed in a wrong category. Misclassification can happen to both exposure and disease. For example, in a case-control study of previous reproductive history and ovarian cancer, a woman who had an extremely early pregnancy loss might not even realize that she was ever pregnant and would mistakenly report no pregnancy, and another woman who has only subclinical presentations of ovarian cancer might be mistakenly selected as a control. Misclassification can be differential or nondifferential. An exposure misclassification is considered differential if it is related to disease status and nondifferential if not related to disease status. Similarly, a disease misclassification is considered differential if it is related to exposure status and nondifferential if not related to exposure status. If a binary exposure variable and a binary disease variable are analyzed, a nondifferential misclassification will result in an underestimate of the true association. Differential misclassification can either exaggerate or underestimate a true effect. Usually not much can be done to control or correct bias at the data analysis stage; therefore, it is important to establish research protocols that are not prone to bias. The evaluation of potential bias is critical to the interpretation of study results. An invalid estimate is worse than no estimate.
Stay updated, free articles. Join our Telegram channel

Full access? Get Clinical Tree


