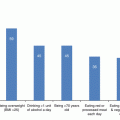
Fig. 4.1
Hb levels started within the normal range for all patients. Starting 10 years before the index date, the CRC cases and controls had similar and quite steady levels till 4 years before the index date, when visible and significant differences began to emerge between the CRC and control patients in both men and women, such that the slopes of Hb change over time in the last 3.5 years before the index date, expressed as logarithmic curves, were highly different in both sexes. As seen in Fig. 4.1, while still in the therapeutic range, Hb levels among CRC cases trended down quite dramatically with little overlap when comparing it to the controls who show very little age-dependent decrease in Hb over the 10-year period
4.4 Construction of the Model and Measures of Performance
Proving the notion that changes in Hb levels over time, long before anemia becomes apparent, can serve as an indicator for the flagging of CRC, has led to developing an algorithm, based on machine learning methodology, to generate a data-driven prediction model.
4.4.1 Machine Learning
Most traditional computer-based algorithms in medicine are sets of rules based on existing knowledge in a specific topic, which are applied to draw conclusions about specific clinical scenarios. These rules take general medical principles and apply them to new sets of patients. In contrast, machine learning algorithms [9] are a relatively new area of research in computer sciences and statistics, which aims to identify novel and valid patterns in data. Machine learning encompasses different modeling tools, which utilize computers to uncover “hidden insights” through learning from historical relationships and trends in the data. Similar to traditional regression models, there are generally outcomes, covariates, and a statistical function linking the two. Different from traditional statistics, machine learning considers large numbers of predictors by combining them in nonlinear and highly interactive computational methods.
As an example for the immense potential of machine learning one can consider radiology (e.g., mamographs) and anatomical pathology [10]. The interpretation of digitized images can be directly analyzed through algorithms, which will improve performance, and its accuracy is expected to exceed diagnosis by physicians [9].
In the model-construction phase of machine learning, the model automatically generates decision trees which aim at identifying the CRC cases. In the next phase, the decision trees are combined into a single unified model. These parameters are then optimized in a process of internal cross validation, which aims to reduce overfitting, whereby the researchers use 90% of the derivation data as a learning subset to construct a model, and examine its performance on the remaining 10%. This process is repeated ten times by dividing the derivation set into new and different learning and testing subsets. The model created through these steps could then be applied on a new and previously unused data of an individual, to quantify his/her risk stratification score of having CRC.
4.4.2 Performance of the Model
The performance of the model was measured by three different parameters:
- 1.
The classical area under the receiver-operator curve (AUC), where the x axis demarks the false positive rate (1 minus specificity) and the y axis shows true positive rates (sensitivity). The closer the AUC is to 1.0, the better is the overall performance of the model.
- 2.
Assessing the ability to identify individuals with the highest probability of having CRC, the model considered a threshold score corresponding to a very low false positive rate of 0.5% (a low proportion of CRC free individuals who are incorrectly identified), and evaluated the odds ratio of having CRC at that false positive level.
- 3.
Examining the ability to identify a significant fraction of the CRC cases, the researchers evaluated the specificity of the model (the proportion of correctly identified CRC-free individuals) at a score threshold that corresponds to 50% sensitivity CRC detection rate.
4.5 Dataset for the Retrospective Derivation and Validation Study
Anonymized and de-identified patient records from Israeli and the UK cohorts as described below, were randomly divided into a derivation set that included 80% of cases, and a validation set containing the remaining 20% of the data. Included were all patients 40 year of age or older diagnosed with cancer in the years 2007–2012, and a random group of cancer-free patients of the same age range.
The Israeli derivation dataset consisted of 606,403 individuals, of whom 466,107 had CBCs. The Israeli validation dataset cohort consisted of 173,251 individuals, of whom 139,205 had CBCs. Overall, there were 2437 CRC cases with CBCs obtained before diagnosis in the derivation set, and 698 such cases in the Israeli validation set. Unlike the Israeli cohort, the UK external validation dataset was a case-control set that consisted of all available 5061 CRC cases and a randomly selected 20,552 cancer free individuals. Sex, birth year and all available CBC records were extracted for the period from January 2003 to June 2011 in Israel and from 1990 until May 2012 in the UK.
Colorectal and all other cancers were identified in Israel from the National Cancer Registry. In the UK, an ad hoc registry was created from all scanning records of malignancies and cancer treatments from January 2007. For every individual with CBC data, the input data consisted of age, gender and all available sets of CBC data parameters. In the data preparation phase, the CBC data of each individual were collected and changes in the values of the parameters over the last 18–36 months were recorded.
4.6 Accuracy of Prediction of CRC
The proposed model was applied to the Israeli validation dataset and included all CBC tests performed 3–6 months before CRC diagnosis. Measuring the overall performance of the model, the AUC was 0.826; the odds ratio at a false positive rate of 0.5% (measuring the model’s ability to identify individuals with the highest probability of having CRC) was 26 ± 6 and the specificity at 50% sensitivity (i.e. a significant fraction of CRC cases detected) was high at 88.6%.
Subsequently, as an external independent validation, the model was applied to a new dataset extracted from the THIN database in the UK [11]. The population in this dataset was different in ethnicity, environmental backgrounds and health care practices from the original Israeli-based dataset used to develop the model. In the British population, fewer blood counts were performed, and some CBC parameters were not (e.g. Red blood cell Distribution Width (RDW)). Despite these different characteristics, the model achieved a similar performance in the British set as it did in the Israeli set (AUC 0.81, odds ratio 40, specificity 94%).
The potential clinical utility of this new model depends on its ability to detect CRC cases earlier than current practice. To evaluate this potential, the medical records available in the UK database were evaluated while focusing only on scores assigned to asymptomatic individuals. Considering CBCs in the 3–6 month time window prior to diagnosis, and the score threshold corresponding to 90% specificity, 67% of the CRC cases were asymptomatic. In addition, low hemoglobin levels (below 12 g/dl for men and 11 g/dl for women) were considered, even when there was no recorded clinical diagnosis of anemia by the physician caring for these individuals. Please note that these threshold values were set at a slightly lower levels than in the preliminary study described above which were 12.6 for men and 11.7 for women (under “Variations in hemoglobin levels within the normal range”). The specificity for detecting 50% of those cases was somewhat reduced (to 82%) but was still significantly better than age alone (74%) thus showing its potential clinical value.
One challenge in diagnosing CRC is the differential ability to identify tumors in different parts of the colon. During the validation of the ColonScore, there was an opportunity to examine the new method’s performance on malignant tumors in different sites of the colon. In all cases, specificity at a sensitivity of 50% was high: rectum (85.9% specificity), left colon (87.4%), transverse colon (93.4%) and right colon (96.1%) [12].
Stay updated, free articles. Join our Telegram channel

Full access? Get Clinical Tree


