7.1 Introduction
Dietary advice is both ancient and anecdotal, from Hippocrates’ advice on the value of vinegar for “feminine disorders” to the anecdotal expectation that “an apple a day keeps the doctor away”. Quantitative advice on population targets for nutrient intake emerged only during the twentieth century, when the essential nature of most nutrients had been established. This quantitative advice came in the form of recommended dietary allowances (RDAs) and covered micronutrients, energy and protein. RDA were intended to direct population nutrient intake to a level where the probability of nutrient deficiency would be low. They were not directed at the noncommunicable chronic diseases. Macronutrient balance was not deemed important until the 1950s and 1960s, when evidence emerged that coronary heart disease was linked to plasma cholesterol and that plasma cholesterol was linked to the balance of dietary fats. The first all-embracing set of dietary guidelines was issued in the USA in the early 1970s.
Since then, hundreds of committees have met across the globe to review and rereview the evidence linking nutrient intake patterns and the risk of noncommunicable chronic disease. The purpose of this chapter is to introduce students to the broad principles of dietary guidelines without engaging in detailed discussions as to the pros and cons of the deliberations of the many committees that have developed dietary guidelines.
7.2 Overview of dietary recommendations
Three main types of dietary recommendations may be produced by public health agencies.
Dietary allowances
Recommended nutrient intakes (RNI) are also called RDA, recommended dietary intakes (RDI), dietary reference values (DRV) or population reference intakes in different countries. Quantitative guidelines for different population subgroups for the essential micronutrients, energy and protein primarily to prevent nutritional deficiencies are generally known as RDA. These dietary guidelines are the subject of Chapter 7 in the Introduction to Human Nutrition in this series, to which the reader is referred. In brief, the approach generally used is to identify the average requirement (AR) and its variance in the form of the standard deviation (SD). Some 95% of values will lie between the AR − 2SD and the AR + 2SD, leaving 2.5% beneath the first of these values and a further 2.5% above the second of these values. The RDA is defined as the AR + 2SD and covers the requirements of all the population except those 2.5% of the population above this value. RDA arose out of a need to assess whether populations or subpopulation groups were receiving enough nutrients in the food supply to meet nutritional needs. They have been compiled for whole populations and for different subgroups within the population based on gender, age, physiological status and activity level. The concept of RDA is often mistakenly misused, being interpreted as a minimum or an average amount of a nutrient required by an individual to maintain health.
Dietary goals
Dietary goals are quantified national targets for selected macronutrients and certain micronutrients aimed at preventing long-term chronic diseases such as coronary heart disease, stroke and cancer. They are generally used for planning at the national level rather than as advice for individuals and are usually expressed in terms of national average intakes in grams/day or as a percentage of energy contribution.
Dietary guidelines
Dietary guidelines are targeted at individuals. These sets of advisory statements give dietary advice for the population to promote overall nutritional well-being and relate to all diet-related conditions. Dietary guidelines are broad targets for which people can aim, whereas RDAs or RNIs indicate what should be consumed on average every day. Adopting RNI and dietary goals for a population may form part of the process for the development of dietary guidelines, which are the recommended strategies for the population to achieve nutritional well-being.
Quantitative guidelines for the macronutrients in particular, but increasingly also for the micronutrients, aimed at reducing the incidence of noncommunicable chronic disease, are generally referred to as dietary guidelines and these will form a major part of this chapter. These guidelines can also be issued in qualitative form. Food-based dietary guidelines (FBDG) translate quantitative dietary guidelines into target foods, meals or eating habits. These will also be a major focus of this chapter.
In addition to FBDG in any country, a set of dietary guidelines expressed in scientific terms may exist, with quantitative recommendations on nutrients and food components, available for use and reference by policy makers and health-care professionals.
7.3 Quantitative dietary guidelines
Since the 1950s, when the links between diet and chronic disease began to emerge, public health nutritionists have begun to compare some ideal pattern of nutrient intakes with those prevailing in the target population. Today, students become rapidly familiar with the national dietary guidelines for their country and these play a significant part in shaping their interpretation of public health nutrition issues. To use these guidelines properly, it is necessary first to understand the principles that underlie their derivation and then to understand clearly the difference between population-based dietary guidelines and individual dietary guidelines.
Deriving quantitative dietary guidelines
The derivation of dietary guidelines is not a precise science. Rather, it is based on expert judgment following extensive review of the relevant literature. Ideally, two separate sets of quantitative data need to be linked.
Disease-risk factor associations
Nutrition epidemiology has provided quantitative data on the relationship between specific chronic diseases and risk factors for these diseases. An example of this is shown in Figure 7.1(a), which plots the age-adjusted incidence of colon cancer (cases/105 persons per year) against fecal output as measured in 23 populations in 12 countries. Clearly, the lower the fecal output, the higher the risk of colon cancer. This is the first set of data needed to determine a dietary guideline for fiber.
Risk factor-nutrient associations
Increasing dietary fiber intake is associated with increasing fecal output. Figure 7.1(b) summarizes this relationship from 11 different studies with 206 subjects involving 28 dietary periods. In this instance, dietary fiber is defined as nonstarch polysaccharides (NSP). The relationship between fecal output (F) and NSP is F = 5.3NSP + 38.
Figure 7.1 (a) Age-adjusted incidence of colon cancer (cases/105 persons per year) against fecal output as measured in 23 populations in 12 countries. (b) Relationship between dietary fiber (nonstarch polysaccharide) intake and fecal output as measured in 206 subjects involving 28 dietary studies. Reprinted from Cummings et al. (1992) with permission from the American Gastroenterological Association.
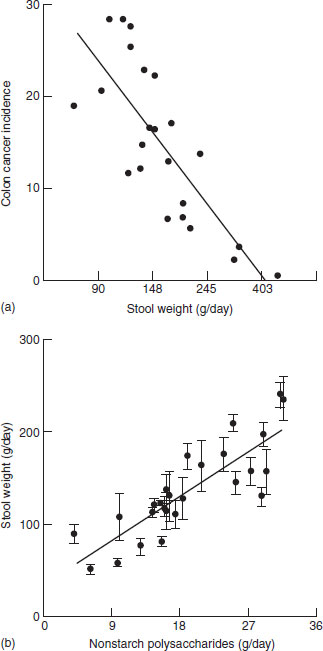
Taking these two sets of data together, it is now possible to address the question: “What level of fiber (NSP) intake is needed to attain a level of fecal output to reduce colon cancer by 50%?” Thus, the linking of quantitative data on the link between the incidence of a disease and risk factors for the disease, on the one hand, and between risk factors for the disease and nutrient intake, on the other hand, allows a reasonably good estimate to underlie dietary guidelines.
Table 7.1 Dietary guidelines to reduce the incidence of chronic disease where there is or is not an intermediate risk factor
| Dietary guideline | Risk factors | Disease |
| Physical activity | Blood pressure | HT |
| Insulin resistance | Diabetes | |
| SFA | Plasma cholesterol | CHD |
| MUFA | Plasma cholesterol | CHD |
| n-6 PUFA | Plasma cholesterol | CHD |
| trans-PUFA | Plasma cholesterol | CHD |
| n-3 PUFA | Platelet aggregation | CHD |
| Cholesterol | Plasma cholesterol | CHD |
| Sodium | Blood pressure | CHD/CVD |
| Fiber | Fecal output | Colon cancer |
| Fruit and vegetables | Nil | Cancer |
| Fermentable carbohydrates | Nil | Caries |
| Total fat | Nil | Obesity |
SFA: saturated fatty acids; MUFA: monounsaturated fatty acids; PUFA: polyunsaturated fatty acids; HT: hypertension; CHD: coronary heart disease; CVD: cardiovascular disease.
Such elegant extrapolations are not always possible, however. For example, in the case of fruit and vegetables and their protective effect against certain cancers, there are no biological risk factors that can link epidemiological data on disease–risk factor relationships with experimental diet–risk factor relationships. This is also true for the link between fermentable carbohydrate intake and dental caries and the link between dietary fat and obesity. Table 7.1 lists nutrients for which dietary guidelines can be quantitatively established on the basis of disease–risk factor data combined with risk factor–nutrient data and those which cannot be so based. In the case of the latter, the quantitative dietary guideline is made by expert judgment of the direct link between the food or nutrient and the disease in question. In other instances, a quantitative dietary guideline can be derived by default, that is, the logical amount that arises when all other issues are considered. For example, if a guideline of 30% energy from fat is combined with an expectation of 15% energy from protein, then all carbohydrate must provide 55% of energy. If a figure of 25% is assigned for all monosaccharides and disaccharides (as in the case, for example, in the Netherlands), then by default 30% of energy should be derived from starch, assuming that dietary guidelines exclude alcohol from the calculations.
The target audience
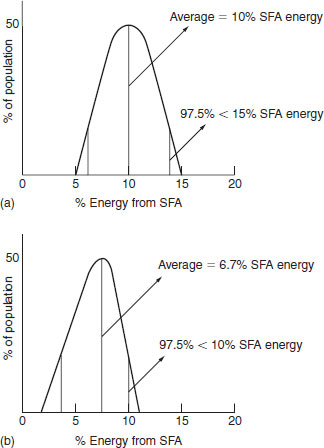
Dietary recommendations can be issued at the level of the population (goals) or of the individual (guidelines). The difference is profound and thus must always be clear before applying dietary guidelines. Consider a population target of 10% energy from saturated fatty acids (SFA). If the SD is 2.5%, then 95% of the population will be between 5 and 15%, that is, between + 2SD and −2SD above and below the mean (10% of energy) (Figure 7.2a). If 10% energy from SFA were to be a target for individuals and the goal was for, 97.5% of the population to meet this target, then 10% would have to be equal to the mean +2SD (Figure 7.2b). Thus, there is a fundamental difference between “population” and “individual” dietary recommendations, and users should always be clear in their mind as to the target audience. For example, the guideline of 400 μg/ day of folic acid for the prevention of neural tube defects in pregnancy is an individual-based dietary guideline, applying to all women of reproductive age.
Figure 7.2 Pattern of distribution of saturated fatty acid (SFA) intake for (a) a population goal of 10% energy, and (b) an individual goal of 10% energy.
Monitoring the attainment of quantitative dietary guidelines
Dietary guidelines can be expressed either in quantitative terms (five servings of fruit and vegetables/day) or in qualitative terms (eat more fruit and vegetables). The two are not necessarily exclusive and can exist side by side, with the qualitative guideline primarily aimed at the public and the quantitative guidelines used by public health nutrition professionals to monitor progress in attaining dietary guidelines. In terms of this monitory process, two approaches are possible. One is to search a nutrient intake database to determine the percentage of the sample that meet the guidelines. Although this is a widely used approach, it is probably only appropriate when the guideline in question is aimed at individuals and not populations. If the guideline is a population target, then the best approach to monitoring success or otherwise is to rank the data for the intake from the lowest value to the highest value. If the target is 11% food energy from saturates, then individuals are selected from the lowest upwards, until such time as the target of 11% food energy from saturates becomes the mean of the sample. The data in Box 7.1 illustrate how the two approaches provide quite different interpretations, using data from Ireland to explore targets of 35% food energy from fat and 11% food energy from SFA.
- Of the 662 males in the sample, 32% of individuals (n = 211) have intakes below the dietary guideline.
- For this group of individuals, the mean intake is 31% of food energy.
- The largest group, the mean value of which meets the targets exactly, is 516, which is 78% of the population.
- Of the 662 males in the sample 11% of individuals (n
Related posts:

Stay updated, free articles. Join our Telegram channel

Full access? Get Clinical Tree