Country
Number of cases (20–79 years)
Prevalence
Annual death rate due to diabetes (20–79 years)
Annual treatment cost per subject (US dollars)
Estimated number of undiagnosed cases
Annual increment of the number of cases
Argentina
1,570,200
5.57
15,416
966.44
722,290
29,000
Bolivia
325,220
6.89
4,732
124.63
149,600
–
Brazil
14,300,000
10.52
129,226
1,031.44
6,164,590
377,000
Chile
1,442,610
12.78
10,459
992.13
755,600
28,000
Colombia
2,067,870
7.26
14,602
482.72
951,220
95,000
Costa Rica
259,350
8.81
1,659
937.20
119,300
–
Cuba
872,950
8.58
7,560
823.71
401,560
19,000
Ecuador
563,840
6.89
5,492
335.41
259,360
19,000
El Salvador
312,430
9.88
3,233
333.58
143.72
–
French Guiana
12,610
9.60
–
–
5,800
–
Guatemala
589,140
9.93
7,202
311.52
271,010
27,000
Honduras
239,590
7.16
2,338
209.40
110,210
–
Mexico
11,500,000
14.4a
80,000a
815.53
3,452,410
323,000
Nicaragua
309,320
11.58
3,001
172.21
142,290
–
Panama
184,580
8.59
1,399
732.45
84,910
–
Paraguay
222,220
6.81
2,174
283.14
102,220
–
Peru
1,108,610
6.81
8,150
307.31
509,960
–
Puerto Rico
391,870
12.98
–
–
108,590
–
Dominican Republic
405,580
7.36
5,183
419.28
186,570
–
Uruguay
157,330
6.02
1,122
922.68
72,370
–
Venezuela
1,764,900
10.39
13,380
914.01
811,850
61,000
According to the Global Burden of Disease group, the mean fasting plasma glucose of the adults living in LA has increased 3.06 mg/dl every decade since 1980 [2]. The end result has been a rapidly increasing prevalence of diabetes. The epidemic growth is expected to continue since the prevalence of several preceding conditions of T2D (i.e., obesity and glucose intolerance) is higher in LA than in other regions. According to the latest report by the Food and Agriculture Organization of the United Nations (FAO) [3] and the World Health Organization (WHO), the worldwide prevalence of obesity in 2013 was 11.7, whereas the prevalence of obesity for the Latin American was reported to be 23.4 %, distributed in 30.4 % for Central America and 21.6 % for South America (Table 7.2). The countries with the highest obesity prevalence in the LA region are Mexico, followed by Venezuela, Argentina, and Chile. The reported prevalence for obesity in Mexican women proves to be higher than the same figure reported for the USA in 2008 (31.8 %). A high percentage of patients with excess body weight have central fat accumulation, arterial hypertension as well as abnormal concentrations of total cholesterol, HDL and triglycerides, and abnormal fasting glucose. When three or more of these abnormalities are present, individuals are diagnosed as having the metabolic syndrome. This condition is associated with a fivefold increase for having T2D. Several metabolic syndrome definitions have been proposed. Using the ATP-III criteria, the age-adjusted prevalence for the region is 28.3 %. Population-based data are available for Brazil (29 %), Peru (18.1 %), Colombia (34.8 %), Venezuela (35.3 %), and Mexico (36.8 %). Higher percentages are found if the IDF definition is applied (for Mexican adults, the prevalence changes from 36.8 to 49.8 %). The prevalence of the metabolic syndrome traits is different in LA compared to that reported in Caucasian populations; low HDL cholesterol, abdominal obesity, and hypertriglyceridemia are significantly more common in LA subjects.
Table 7.2
Average body mass index (BMI) standardized for age by age and country for the years 1980 and 2008
Men (kg/m2) | Women (kg/m2) | Prevalence of obesity in adults (%) | |||
|---|---|---|---|---|---|
1980 | 2008 | 1980 | 2008 | 2008 | |
Argentina | 25.4 | 27.5 | 23.8 | 27.5 | 29.4 |
Bolivia | 23.0 | 24.4 | 23.6 | 26.9 | 18.9 |
Brazil | 22.6 | 25.8 | 24.1 | 26.0 | 19.5 |
Chile | 24.5 | 27.0 | 24.0 | 27.9 | 29.1 |
Colombia | 22.1 | 24.9 | 23.4 | 26.2 | 18.1 |
Costa Rica | 23.7 | 26.5 | 23.4 | 27.0 | 24.6 |
Cuba | 22.7 | 25.1 | 23.8 | 26.6 | 20.5 |
Ecuador | 23.8 | 25.6 | 24.7 | 27.1 | 22.0 |
El Salvador | 23.8 | 26.4 | 23.7 | 27.8 | 26.9 |
Guatemala | 23.2 | 25.3 | 22.9 | 26.8 | 20.7 |
Honduras | 23.1 | 25.1 | 23.0 | 26.7 | 19.8 |
Mexico | 24.5 | 27.4 | 24.6 | 28.7 | 32.8 |
Nicaragua | 24.0 | 25.8 | 24.4 | 27.6 | 24.2 |
Panama | 23.5 | 26.3 | 23.9 | 27.7 | 25.8 |
Paraguay | 23.4 | 25.5 | 23.5 | 25.9 | 19.2 |
Peru | 23.0 | 24.8 | 25.1 | 26.0 | 16.5 |
Dominican Republic | 22.9 | 25.2 | 22.6 | 26.9 | 21.9 |
Uruguay | 24.2 | 26.4 | 23.3 | 26.6 | 23.6 |
Venezuela | 24.6 | 27.4 | 24.7 | 28.1 | 30.8 |
The clinical expression of T2D has several peculiarities that have been consistently reported in LA populations. Especially among mestizo individuals, the disease is expressed at an earlier age and with a lower body mass index (BMI) compared to that reported in Caucasians. The premature age of onset increases the social and economic burden because of the higher prevalence of chronic complications and premature disability during productive years. In Mexico, 22.7 % of people with T2D are under the age 40. Individuals with early-onset T2D comprise a heterogeneous population [4]. Two thirds of them have BMI >25 kg/m2; these cases had an increased prevalence of several metabolic syndrome traits (e.g., hypertension and hypoalphalipoproteinemia) and can be controlled using oral glucose-lowering agents. In contrast, a large proportion of the lean cases require insulin as part of their treatment. Compared to the overall population with T2D, the young T2D population had a higher prevalence of underdiagnosis, more school years but a lower socioeconomic level, and higher alcohol and tobacco consumption. Few young patients undertake preventive measures, with very few receiving statins, acetylsalicylic acid, or follow-up with an ophthalmologist. This group has specific barriers to adhere treatment programs (e.g., depression, work-related stress, and alcoholism) that should be intentionally sought.
On the other hand, the mean BMI of recently diagnosed populations is lower in LA patients (e.g., for Mexico, 27.9 kg/m2 in males and 28.9 kg/m2 in females) compared to that reported in the USA (usually above 30 kg/m2). Mestizo populations are less tolerant to excess body weight because fat is accumulated in ectopic organs and in the intra-abdominal cavity instead of the subcutaneous adipose tissue [5].
T2D coexists frequently with other comorbidities. Taking as an example the Mexican population, a high percentage of patients with T2D had at least one cardiovascular risk factor (86.7 %) (e.g., hypercholesterolemia, family history of cardiovascular mortality, arterial hypertension, and smoking). Nearly half the patients had hypertension, but almost half of them are unaware of the presence of arterial hypertension. Smoking persists as a common risk factor in the patients with diabetes. Dyslipidemia is one of the most common comorbidities in T2D, with higher levels of triglycerides and non-HDL cholesterol compared with values of the general population. LDL cholesterol (LDL-C) levels >100 mg/dL are observed in 74.8 % (95 % CI 72.5–76.9 %) of previously diagnosed patients [6]. Similar percentages have been reported by the Qualidiab network using data from several South American countries [7].
A high percentage of women with T2D had at least one pregnancy during their lifetimes (94.7 %); this proportion was similar to the one found in patients without T2D. However, the number of women who had suffered at least one abortion was significantly higher in the group with diabetes (OR 1.62, 95 % CI 1.53–1.83) with a similar trend found in the risk of stillbirth (OR 1.99, 95 % CI 1.75–2.3); these differences were held significant when adjusted by age. A high percentage of women with T2D during their reproductive years did not use contraceptive methods (42.5 %); this rate was not significantly different in women without T2D (38.8 %). A quarter of patients with T2D had a current or previous history of a urinary tract infection during the previous year. Additionally, the risk of suffering an accident is higher for T2D patients (OR 1.42, 95 % CI 1.25–1.60) with half of the accidents occurring within the patient’s house. The risk of accidental falls in patients with T2D is not held significant when stratified by age group [8].
The elder patient with T2D is a growing group in the region. Two major profiles are found among them. The first is composed of T2D patients with a long exposure to the disease and chronic complications, third-party dependence, and requiring a more complex management. The second group is composed of T2D patients diagnosed after the age 70; these patients have a low prevalence of microvascular complications and their glucose levels can be kept stable with one or two oral hypoglycemic agents. Both groups are represented in similar proportions. Cardiovascular risk factors were common in this age group; 60 % had hypertension, 88.7 % was taking one or more antihypertensive agents, and microalbuminuria was detected in 48.4 % of cases. These patients have a higher prevalence of geriatric syndromes (falls, motor limitations, cognitive dysfunction, and polypharmacy) [9].
T2DM patients in Latin America are exposed to endemic and highly prevalent infectious diseases (such as tuberculosis, influenza, HIV, and hepatitis C), which represent a serious comorbidity within this group. T2D increases the risk for having tuberculosis, and it is associated with a decreased rate of eradication. The epidemiologic transition from infectious to noncommunicable chronic diseases has created a unique environment in Latin American countries where the interaction of both disease trends increases morbidity and mortality associated with noncommunicable diseases [10].
Gestational Diabetes
Gestational diabetes is a common obstetric complication in the LA region. Prevalence depends on the sampling approach and the diagnostic criteria applied. It varies between 4.3 and 30.1 %; the majority of reports inform percentages close to 10 %. The use of the recently introduced IADPSG criteria results in remarkably higher percentages [11]. According to the 2015 IDF Atlas, the age-adjusted prevalence of hyperglycemia during pregnancy is 11.5 % (crude 13.2 %) in the LA region; it means that close to 0.9 million live births are affected by this condition.
Macrosomia is frequently associated with gestational diabetes. In a multinational survey, the prevalence of macrosomia was between 2.8 and 9.3 % in the LA region. This percentage was greater than that reported in Asia and Africa. Macrosomia is a strong risk factor for having cesarean section and various adverse perinatal outcomes (e.g., fetal distress and cephalopelvic disproportion).
Type 1 Diabetes Mellitus (T1D)
The IDF reported that 542,000 children (<15 years) worldwide are affected by this disease; 86,000 new cases are diagnosed every year. Prevalence of T1DM has been increasing in recent years worldwide. An annual increase in incidence of 3 % has been recorded.
The estimated number of cases in LA is 45,100; 7,300 new cases are diagnosed every year. Two of the top ten countries with the highest number of cases are located in the region (Brazil (30,900) and Mexico (13,500)). However, none of the countries with the highest number of new cases per year are located in LA. Readers should be aware that it is likely that these numbers are underestimated due to the lack of national registries in the majority of the countries of the region. The information about the epidemiology of T1DM in this region is scant [12].
In most high-income countries, the majority of diabetes in children and adolescents is caused by T1DM. This statement does not apply for the LA region. The growth in the number of children with diabetes is mainly caused by T2D. In Mexico, half of the children with diabetes are obese, do not have positive titers of GAD antibodies, and are controlled with oral glucose-lowering agents.
The WHO coordinated a Multinational Project for Childhood Diabetes (DIAMOND) from 1990 to 1999 in order to monitor the patterns of worldwide incidence of T1DM in children up to the year 2000 [13]. The Diabetes and Genetic Epidemiology Unit of the National Public Health Institute in Helsinki, Finland served as the coordinator unit, and 100 centers from 50 countries around the world headed by a principal investigator were recruited. To be eligible, the center must have an accurate, well-defined, population-based registry. The inclusion criteria considered children 0–14 years with residency in the study area. Fifty countries participated in this program. Seventy-five million children fitted the inclusion criteria and 19,164 were diagnosed with T1DM from 1990 to 1994, according to WHO classification and diagnostic criteria. Ten Latin American countries (Argentina, Brazil, Chile, Colombia, Paraguay, Peru, Uruguay, Venezuela, Cuba, and Mexico) participated with 13 centers. The overall age-adjusted incidence of T1D varied from 0.1/100,000 per year in Zunyi, China, and Venezuela to 36.8/100,000 in Sardinia and 36.5/100,000 in Finland (350-fold variation among 100 populations around the world). The incidence among populations in South America ranged from intermediate to very low. The highest incidence rates were among European and North American populations [14, 15]. The incidence rates for T1DM in Latin American countries are lower than those described in Spain (12.4/100,000 (11.7–13.1)) or Portugal (14.6/100,000 (10.6–19.6)), suggesting that the Amerindian genetic background might be protective against T1DM development. Native unmixed minority groups remain in rural areas of Mexico, Bolivia, Peru, and Guatemala; very low incidence of T1DM has been reported in these groups. Furthermore, T1DM prevalence seems to be related to the proportion of Caucasoid populations in a certain country (Table 7.3).
Table 7.3
Incidence of type 1 diabetes in Latin America per 100,000 persons aged 14 years or younger
Country | Study period | Incidence (%) (95 % CI) | Annual change of incidence | Estimate of ascertainment (%) |
|---|---|---|---|---|
Puerto Rico | 1990–1999 | 16.8 (16.0–17.6) | −1.0 (−2.7; 0.7) | 90–97 |
Uruguay (Montevideo) | 1992 | 8.3 (5.4–11.7) | a | 97 |
Brazil (Sao Paulo) | 1990–1992 | 8.0 (5.53–11.14) | −16 (−48.6; 37.2) | 70–95 |
Argentina (Avellaneda) | 1990–1996 | 6.3 (5.7–11.1) | 0.4 (−8.8; 10.5) | 88–100 |
Argentina (Tierra del Fuego) | 1993–1996 | 10.3 (5.5–18.5) | a | 100 |
Colombia (Bogota) | 1990 | 3.8 (2.9–4.9) | a | 97 |
Colombia (Cali) | 1995–1999 | 0.5 (0.3–0.7) | a | – |
Chile (Santiago) | 1990–1999 | 3.7 (3.4–4.0) | 7.5 (4.3; 10.9) | 100 |
Cuba | 1990–1999 | 2.3 (2.2–2.5) | −10.8 (−13.4; −8.2) | 25–100 |
Mexico (Veracruz) | 1990–1993 | 1.5 (0.7–2.9) | – | 100 |
Paraguay | 1990–1999 | 0.9 (0.8–1.0) | −0.5 (−5.7; 4.9) | a |
Peru (Lima) | 1990–1994 | 0.5 (0.4–0.64) | 12.1 (−7.5; 35.8) | a |
Dominican Republic | 1995–1999 | 0.5 (0.4–0.7) | 12.6 (−11.4; 43.0) | a |
Venezuela (Caracas) | 1990–1994 | 0.1 (0.1–0.2) | −6.8 (−24.6; 15.3) | a |
Hispanics in the USA | 1990–1999 | 11.4 (10.1–12.9) | – | 51–100 |
Genomic Landscape of Diabetes in the Region
Type 2 Diabetes
Amerindian populations have an increased risk for having T2D. Populations with Amerindian ancestry comprise 27.6–63 % of the genetic background of the LA countries. The Slim Initiative in Genomic Medicine for the Americas (SIGMA) Type 2 Diabetes Consortium was set out to characterize the genetic factors that explain the higher T2DM prevalence registered within this population. The SIGMA consortium genotyped 8,214 Mexicans and Latin Americans, which included 3,848 T2DM patients (cases) and 4,366 controls and have Native American and European ancestry [16]. The higher susceptibility of the admixed Latin American population can be explained both by the high prevalence of Caucasian- and ethnic-specific risk alleles. Fifty-six of the 68 known genetic associations identified in Caucasians were replicated. The TCF7L2 and KCNQ1 risk alleles are highly prevalent in mestizos. In addition, two ethnic-specific associations were found. The strongest novel association was found at chromosome 17p13.1, specifically an SLC16A11 haplotype (OR 1.29 (95 % CI 1.20–1.38)). Individuals with the risk haplotype develop T2DM 2.1 years earlier (p = 3.1 × 10⁻⁴) and had 0.9 kg/m2 lower BMI than noncarriers. This frequency of this variant is very small in Europeans and Africans, moderate in Asians (~10 %), and high in the Americas’ native population (50 %). This newly discovered risk allele is thought to be derived from Neanderthal introgression. Approximately 20 % of the difference in prevalence of T2DM among people with Amerindian and European ancestry can be explained by the presence of the risk allele. The second risk allele associated with T2DM in the Latin American population is the p.E508K variant of the hepatocyte nuclear factor 1-α (HNF-1α). It is present in 2.1 % of T2DM patients [17]. The p.E508K variant partially reduces transactivation activity. Although the affected gene is the cause of MODY (maturity-onset diabetes of the young)-3, the clinical profile of the patient with the p.E508K variant is undistinguishable from T2D.
Several polymorphisms have been studied among other populations; in Brazilians the TCF7L2 rs7903166 (C/T) was associated with T2DM risk among the southern-Brazilian population. The frequency of the minor allele was 38 % in the type 2 diabetes group and 31 % in nondiabetic subjects, and this allele was significantly associated with type 2 diabetes risk (OR = 1.42, 95 % CI 1.15–1.76 for the dominant model of inheritance).
Gestational Diabetes
Few genetic studies have been focused in women with gestational diabetes in LA. Recently, Chagoya and coworkers found an association between gestational diabetes and two of the most frequently replicated T2D loci: a TCF7L2 haplotype (rs7901695, rs4506565, rs7903146, rs12243326; P = 2.16 × 10-06; OR = 2.95) and a KCNQ1 haplotype (rs2237892, rs163184, rs2237897; P = 1.98 × 10-05; OR = 0.55). This finding is in accordance with the strong relation that exists between T2D and gestational diabetes.
Type 1 Diabetes
As recognized by the Diabetes Epidemiology Research International Group, the ethnic diversity of the Latin American populations yields an opportunity to identify the existence of protective genotypes or the absence of susceptibility variants in the Amerindians. T1DM is a multifactorial and polygenic disease that exerts a high genetic susceptibility trait with a concordance rate in twins of about 30–50 %. Genetic variants of the human leukocyte antigen (HLA) on chromosome 6p21.3, particularly combinations of DR3/DR4, produce the highest risk, which explains nearly 50 % of the genetic contribution. Other non-HLA T1DM susceptibility genes have been identified also.
Cruz-Tapias et al. published a meta-analysis designed to estimate the risk associated with variations in HLA class II in some autoimmune diseases, including T1DM in Latin American countries. Major risk alleles related to T1DM incidence showed to be DQA1*301/*501, DQB1*201/*302/*301, and DQB1*401/*402/*405, while the protective ones were DQB1*501, DQB1*602/*603, and DQB1*11/*13/*14/*15. Meanwhile, Gorodezky et al. identified HLA haplotypes with a strong association with T1DM in Mexicans which included DRB1*0301-DQA1*0501-DQB1*0201 (OR = 21.4), DRB1*0405-DQA1*0301-DQB1*0302 (OR = 44.5), and the same DQA1/DQB1 with the HLA haplotype DRB1*0404/*0401 conferring lower risk, increasing the risk of an earlier age at onset (OR = 61.3). Finally, a meta-analysis limited to LA patients with T1D (21 studies, 1,138 cases, and 1,920 controls) found that DRB1*0301 (OR: 9.65; 95 % CI: 5.69–16.36; p < 0.0001), DRB1*1201 (OR: 4.84; 95 % CI: 1.97–11.91; p = 0.001), DQB1*0302 (OR: 4.58; 95 % CI: 3.36–6.26; p < 0.0001), DQA1*0301(OR: 3.02; 95 % CI: 1.37–6.65; p = 0.0059) and DQB1*0602 (OR: 0.19; 95 % CI: 0.11–0.33; p < 0.0001), DRB1*14 (OR: 0.18; 95 % CI: 0.06–0.55; p = 0.0024), and DQB1*0501 (OR: 0.47; 95 % CI: 0.26–0.83; p = 0.0097) were the most significant alleles associated with T1D. Despite of the above, Latin American populations and the Amerindian individuals have been underrepresented in the T1DM genetic studies. Future GWAS study may consider the inclusion of ethnic diverse populations composed by both high (i.e., Caucasian) and low (i.e., Amerindians) incidence groups [18–20].
Diagnosis of Diabetes and Prediabetes in the Region
T2D
Prevalence data are available for the majority of the countries of the region [21–25]. However, the design of the surveys is heterogeneous leading to contrasting conclusions even in the same country [26]. Table 7.1 shows the prevalence reported by IDF which is derived mainly from population-based surveys. Twelve Latin American countries have prevalence higher than the world average (8.3 %). More than 10 % of the adult population is affected in Chile, Puerto Rico, Nicaragua, Venezuela, Mexico, and Brazil. Prevalence is higher in urban settings, native Amerindian communities (>25 % in Canada and the USA), low-income/low-education groups, and populations that have undergone migratory movements (e.g., 25.7 % in the US/Mexico border). In Mexico, the mean age of onset is 48 years, being lower in women. The highest prevalence is found in the 55–60-year-old group. The time since diagnosis is 9.3 years in males and 8.4 years in females [27].
There is a lack of data about the prevalence of prediabetes in LA [28]. This term encloses three conditions (i.e., impaired fasting glucose (100–125.9 mg/dl), impaired glucose tolerance (2 h post-challenge plasma glucose between 140 and 199 mg/dl), and abnormal HbA1c (5.7 to 6.4 %) associated with an increased risk for having T2D in the next 10 years. The prevalence of prediabetes in Hispanics living in the USA was 36.8 % (95 % CI 32.1–41.7 %) in 2011–2012 NHANES. Regrettably, no comparable information is available in the region because only fasting glycemia has been registered in the majority of the LA population-based surveys. In the Mexican 2006 National Health and Nutrition Survey (ENSANUT, in Spanish), the prevalence of impaired fasting glucose was 19.1 % in adults aged 20–69 years old. The corresponding rate in Peru is 22.4 % [29]. This information is in clear contrast with the remarkably lower prevalence of impaired glucose tolerance (7.9 %, 42.2 million) reported for the region by the IDF.
A high percentage of T2DM patients remain undiagnosed. For example, in Mexico, half of the patients with diabetes were unaware of their condition. The undiagnosed proportion of cases in the region is not different from the rest of the developing countries but remarkably higher compared to some European countries (nearly 6 %). This percentage is even higher in young adults (70 %) or low-income groups. Several countries have implemented screening programs. The strategies are diverse. For example, Brazil had a massive screening program in 2001, based in capillary glucose tests (n = 22,069,905). It covered 73 % of the target population [30]. In Mexico, the adult population who attended for T2D screening in the previous year increased from 10.5 % in 2000 to 22.7 % in 2006. However, a major limitation of the screening programs is the lack of a systematic inclusion of the detected cases into treatment programs.
Incidence data are scant in the region. In the Mexico City study, Gonzalez Villalpando and coworkers found an incidence rate of 1.4 cases per 100,000 persons per year in low-income subjects [31]. Meza and coworkers using a Markov model estimated that incidence rates may vary between five and 25 cases per 100,000 persons per year among adults aged 30–90 years living in Mexico during 2010 [32]. Clearly, an unmet need in the LA area is the existence of representative cohorts of patients with and without diabetes with a long-term follow-up. Incidence data are critical to design and validate public policies.
T2DM in Mexico
Mexico has four population-based, nationwide surveys in which the prevalence of T2D has been measured (National Chronic Disease Survey [ENEC] in 1993, National Health Survey [ENSA] in 2000, and the National Health and Nutrition Surveys (ENSANUT) performed in 2006 and 2012) [33–35]. The surveys (Fig. 7.1) have proved an increase in prevalence from 6.7 % in 1993 (previously diagnosed (PD) 4.6 % and undiagnosed (UD) 2.1 %) to 7.5 % in 2000 (PD 5.8 % and UD 1.7 %) to 14.4 % in 2006 (PMD 7.3 % and 7.1 % FP). The increases were similar for both sexes and for rural and urban areas. The growing trend in T2DM prevalence is multifactorial; aging of the population, the large proportion of Amerindian ethnic background, and an increase in the prevalence of obesity attributable to changes in the lifestyle are the most obvious explanations. Results from ENSANUT 2012 show that the prevalence of T2DM by PD is 9.2 % in adults over 20 years of age; this implies that 6.4 million Mexican adults have the diagnosis of T2DM which shows an overall doubling up from the prevalence recorded in the year 2000. A recent IDF report estimates that 11.5 million (95 % CI 6.2–13.7 million) Mexican adults are affected.
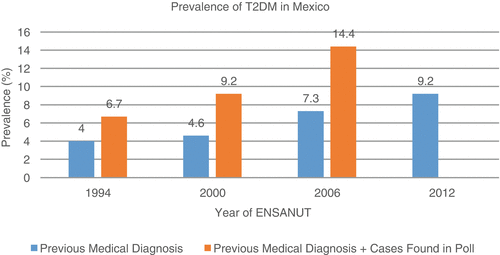

Fig. 7.1
Comparison of T2DM prevalence reported for the National Health and Nutrition Polls in Mexico for the years 1994, 2000, 2006, and 2012, comparing the cases with previous medical diagnosis and the cases with both previous medical diagnosis and the cases found by the polls (Adapted from: Hernández-Ávila et al.)
Several complimentary sources of information should be highlighted. The diabetes study of Mexico City is a population-based cohort study of subjects from six low-income colonies located within the periphery of the ABC hospital in Mexico City [36]. The recruitment of adults without T2DM diagnosis started in 1990 reaching 1,754 subjects with an average follow-up period of 11 years; after the follow-up period, an incidence of 1.42 per 100 person-years for men and 1.21 per 100 person-years for women was obtained. The resulting incidence was inferior to those obtained by a similar study undertaken in San Antonio, TX, in which an incidence of 2.7 and 2.86 per 100 person-years was obtained for men and women, respectively, despite taking into consideration different diabetes-associated risk factors. In addition, Mexico City was among the cities included in the CARMELA study, a multinational survey designed to assess the prevalence of diabetes, dyslipidemias, and other cardiovascular risk factors. Mexico City had the highest prevalence of T2D in the region.
T2DM in Brazil
According to data from the IDF, Brazil ranks fourth among countries with the largest number of people with T2DM, comprising nearly 14.3 million cases; the T2DM prevalence in Brazil has been estimated by the IDF to be 10.52 % in 2012. There is significant variability between regions ranging from 5.2 % (Brasilia) to 13.5 % (São Carlos). The Surveillance of Risk and Protective Factors for Chronic Diseases Telephone Survey (VIGITEL, in Portuguese) is a telephone surveillance system to identify risk and protective factors for noncommunicable chronic diseases in subjects aged 18 years or older; through this system, a trend of increasing prevalence rates for all NCCDs has been identified. In 2013, VIGITEL reported a prevalence of self-reported T2DM of 6.9 %. The trend of increasing prevalence has also been demonstrated for different age groups as shown in Fig. 7.2, where the prevalence ranges from 8.5 % in the 45–54-year group to 17.1 % in the 55–64-year group and 22.1 % in the groups with 65 years or older. The rates of self-reported diabetes through VIGITEL have also shown a difference in its distribution: northern Brazil, characterized by lower incomes, reports T2DM rates of 3.6–5.5 %, whereas southern Brazil, with higher incomes, reports rates ranging from 6.7 to 8.2 %. The rates of T2DM have been reported to be higher specifically in Japanese Brazilians and in Native American groups (28 % of Xavantes has T2D).
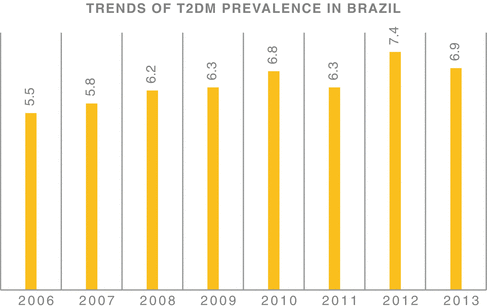

Fig. 7.2
Comparison of self-reported T2DM prevalence trends from 2006 to 2013 in the Brazilian population as reported by the VIGITEL strategy (Adapted from Almeida-Pititto et al.)
Obesity rates in Brazil have similarly been escalating across all age groups; serial data from the Household Budget Survey showed that BMI >25 kg/m2 have increased from 16 to 50 % in men and from 28 to 48 % in women. Likewise, the prevalence of BMI >30 kg/m2 has increased from 8.9 to 12.5 % in men and from 13.1 to 16.9 % in women. Other risk factors include physical inactivity and sedentary lifestyle; in Brazil nearly 41 % of the adult population is not sufficiently active to achieve health benefits. VIGITEL has reported the prevalence of T2DM risk factors as follows: high frequency of soft drink consumption (23.3 %), alcohol abuse (16.4 %), cigarette smoking (11.3 %), and physical inactivity (33.8 %). The health system provides the full range of services for diabetes care and prevention but not universally. The federal government covers 50–80 % of costs, including basic medicines under prescription and testing strips for people with T1DM. Similar to what has been happening in other Latin American countries, the epidemiologic transition motivated by populations concentrating in urban areas, along with nutritional changes and population aging, has contributed to an accumulation of cardiovascular risk factors that have led to a general increase in the prevalence of T2DM [37–39].
T2DM in Central America
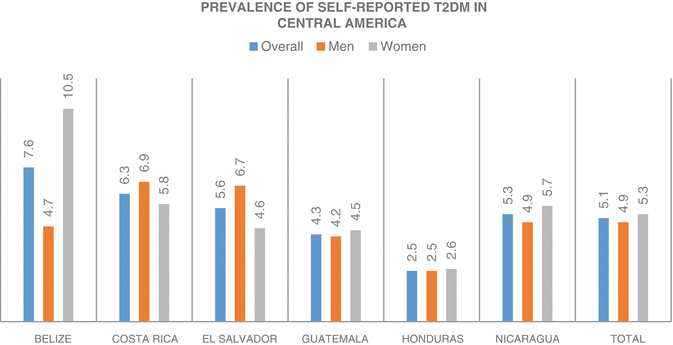
The epidemiologic transition from infectious diseases to noncommunicable chronic diseases has also changed the epidemiologic landscape within Central America. The top three countries with the highest prevalence are Nicaragua, Guatemala, and El Salvador [40]. The Central American Diabetes Initiative (CAMDI) 2010 is a study by the Pan American Health Organization with the objective to determine the prevalence of T2DM and hypertension in people 20 years or older (n = 10,822) in a sample taken from six Central American populations (urban areas of San José, Costa Rica; Santa Tecla, San Salvador, El Salvador; Villanueva, Guatemala City, Guatemala; Tegucigalpa, Honduras; Managua, Nicaragua; and the national population of Belize) [41]. Prevalence of previously diagnosed T2DM was similar among males and females (4.9 vs 5.3 %); the overall prevalence of diagnosed hypertension was higher among women (19.0 %. 95 %-CI = 16.9–21.4) than among men (10.9 %, 95 %-CI = 9.6–12.5). Overall 5.1 % of participants reported diagnosed diabetes while 3.4 % were found to have newly diagnosed diabetes for a total prevalence of 8.5 %. An additional 18.6 % was reported to have prediabetes (IFG and/or IGT). The prevalence of previously or newly diagnosed diabetes and prediabetes was comparable in men and women. As shown for all participant sites in Fig. 7.3, the prevalence of known and newly diagnosed T2DM was the lowest in Tegucigalpa (2.5 % and 2.9 %, respectively); the lowest prevalence of prediabetes was found in Managua (12.4 %).

