Chapter Outline
CYTOGENETIC AND MOLECULAR METHODOLOGIES
Polymerase Chain Reaction–Based Molecular Assays
Array Comparative Genomic Hybridization and Single Nucleotide Polymorphism Profiling Assays
GENOMIC MECHANISMS IN PEDIATRIC TUMORS
BIOLOGIC CONSEQUENCES OF CHROMOSOMAL TRANSLOCATION
Chromosomal Rearrangements Involving Transcription Factor Genes
Chromosomal Rearrangements Involving Protein Tyrosine Kinase Genes
Chromosomal Rearrangements Associated with Transcriptional Upregulation of Nonfusion Oncogenes
BIOLOGIC BASIS FOR SPECIFICITY OF BALANCED CHROMOSOMAL REARRANGEMENTS: DIAGNOSTIC RELEVANCE
CYTOGENETIC AND MOLECULAR PATHOLOGY: MAJOR TUMOR TYPES
Cytogenetic and molecular analyses have provided pivotal biologic and clinical insights into pediatric neoplasia. It is increasingly evident that genetic assays of various types can provide essential diagnostic or prognostic information about pediatric solid tumors and hematologic malignancies ( Tables 45-1 to 45-3 ). In this chapter we offer an overview of the methods in use for the analysis of cytogenetic and molecular aberrations ( Table 45-4 ) in pediatric cancers together with their relative attributes, discuss the causes of these genetic aberrations, and summarize their diagnostic and predictive relevance in clinical practice.
| Histologic Findings | Cytogenetic Events | Molecular Events | Frequency (%) | Clinical Relevance |
|---|---|---|---|---|
| Alveolar soft part sarcoma | t(X;17)(p11;q25) | ASPSCR1 (ASPL)-TFE3 fusion | >90 | |
| Aneurysmal bone cyst (extraosseous) | 16q22 and 17p13 rearrangements | USP6 fusion genes | >50 | |
| Angiomatoid fibrous histiocytoma | t(12;16)(q13;p11) | FUS-ATF1 fusion | 10 | |
| EWSR1 (EWS)-GREB1 fusion | 80 | |||
| Chondromyxoid fibroma | Deletion of 6q | >75 | ||
| Chondrosarcoma | ||||
| Skeletal | Complex * | >75 | ||
| Extraskeletal myxoid | t(9;22)(q22;q12) | EWS-NR4A3 fusion | >75 | |
| t(9;17)(q22;q11) | TAF15-NR4A3 fusion | <10 | ||
| t(9;15)(q22;q21) | TCF12-NR4A3 fusion | <10 | ||
| Clear cell sarcoma—melanoma of soft parts | t(12;22)(q13;q12) | EWS-ATF1 fusion | > | |
| Dermatofibrosarcoma protuberans | Ring form of chromosomes 17 and 22 | COL1A1-PDGFB fusion | >75 | PDGFRB therapeutic inhibition |
| t(17;22)(q21;q13) | COL1A1-PDGFB fusion | 10 | PDGFRB therapeutic inhibition | |
| Desmoplastic small round cell tumor | t(11;22)(p13;q12) | EWS-WT1 fusion | >75 | |
| Endometrial stromal tumor | t(7;17)(p15;q21) | JAZF1-SUZ12 | 30 | |
| Ewing sarcoma | t(11;22)(q24;q12) | EWS-FLI1 fusion | >80 | |
| t(21;22)(q12;q12) | EWS-ERG fusion | 5-10 | ||
| t(2;22)(q33;q12) | EWS-FEV fusion | <5 | ||
| t(7;22)(p22;q12) | EWS-ETV1 fusion | <5 | ||
| t(17;22)(q12;q12) | EWS-ETV4 fusion | <5 | ||
| t(16;21)(p11;q12) | FUS-ERG fusion | <5 | ||
| t(2;16)(q33;p11) | FUS-FEV fusion | <5 | ||
| inv(22)(q12q12) | EWS-PATZ1 (ZSG) fusion | <5 | ||
| Fibromatosis (desmoid) | Trisomies 8 and 20 | 30 | ||
| Deletion of 5q | APC inactivation | 10 | Association with germline APC mutation and familial adenomatous polyposis | |
| CTNNB1 mutation | 70 | |||
| Fibromyxoid sarcoma, low-grade | t(7;16)(q33;p11) | FUS-CREB3L2 (BBF2H7) fusion | 50 | |
| Fibrosarcoma, infantile | t(12;15)(p13;q26) | ETV6 (TEL)-NTRK3 fusion | >75 | NTRK3 therapeutic inhibition |
| Trisomies 8, 11, 17, and 20 | >75 | |||
| Gastrointestinal stromal tumor | Monosomies 14 and 22 | >75 | ||
| Deletion of 1p | >25 | |||
| KIT or PDGFRA mutation | >90 | KIT-PDGFRA therapeutic inhibition | ||
| Giant cell tumor | ||||
| Bone | Telomeric associations | >50 | ||
| Tenosynovial | Trisomies 5 and 7 | >25 | ||
| t(1;2)(p13;q35) | CSF1-COL6A3 fusion | 25 | CSF1R therapeutic inhibition | |
| Hibernoma | 11q13 rearrangement | >50 | ||
| Inflammatory myofibroblastic tumor | 2p23 rearrangement | ALK fusion genes | 50 | ALK therapeutic inhibition |
| Leiomyoma | ||||
| Uterine | t(12;14)(q15;q24) or deletion of 7q | LHFP (HMGIC) rearrangement | 40 | |
| Extrauterine | Deletion of 1p | ? | ||
| Leiomyosarcoma | Deletion of 1p | >50 | ||
| Lipoblastoma | 8q12 rearrangement or polysomy 8 | PLAG1 oncogenes | >80 | |
| Lipoma | ||||
| Typical | 12q15 rearrangement | HMGIC rearrangement | 60 | |
| Spindle cell or pleomorphic | Deletion of 13q or 16q | >75 | ||
| Chondroid | t(11;16)(q13;p12-13) | ? | ||
| Liposarcoma | ||||
| Well-differentiated | Ring form of chromosome 12 | >75 | ||
| Myxoid, round cell | t(12;16)(q13;p11) | FUS-DDIT3 (CHOP) fusion | >75 | Trabectedin therapeutic response |
| t(12;22)(q13;q12) | EWS-CHOP fusion | <5 | ||
| Pleomorphic | Complex * | 90 | ||
| Malignant fibrous histiocytoma | ||||
| Myxoid | Ring form of chromosome 12 | ? | ||
| High-grade | Complex * | >90 | ||
| Myxofibrosarcoma | (see “Malignant fibrous histiocytoma”) | |||
| Malignant peripheral nerve sheath tumor | (see “Schwannoma”) | |||
| Mesothelioma | Deletion of 1p | ?BCL10 inactivation | >50 | |
| Deletion of 9p | p15 , p16 , and p19 inactivation | >75 | ||
| Deletion of 22q | NF2 inactivation | >50 | ||
| Deletions of 3p and 6q | >50 | |||
| Neuroblastoma | ||||
| Good prognosis | Hyperdiploid, no 1p deletion | 40 | ||
| Poor prognosis | 1p deletion | 40 | ||
| Double-minute chromosomes | MYCN amplification | >25 | ||
| Oligodendroglioma | Deletion of 1p and 19q | Therapeutic response to CDDP | ||
| Osteochondroma | Deletion of 8q | EXT1 inactivation | >25 | |
| Osteosarcoma | ||||
| Low-grade | Ring chromosomes | >50 | ||
| High-grade | Complex * | RB1 and TP53 inactivation | >80 | |
| Pericytoma | t(7;12)(p22;q13-15) | GLI-ACTB fusion | ? | |
| Pigmented villonodular synovitis | (see “Giant cell tumor: Tenosynovial”) | |||
| Primitive neuroectodermal tumor | (see “Ewing sarcoma”) | |||
| Rhabdoid tumor | Deletion of 22q | SMARCB1 (INI1) inactivation | >90 | |
| Rhabdomyosarcoma | ||||
| Alveolar | t(2;13)(q35;q14) | PAX3-FOXO1 fusion | 60 | Prognosis |
| t(1;13)(p36;q14), double minutes | PAX7-FOXO1 fusion | 10-20 | Prognosis | |
| Embryonal | Trisomies 2q, 8 and 20 | >75 | ||
| Loss of heterozygosity at 11p15 | >75 | |||
| Schwannoma | ||||
| Benign | Deletion of 22q | NF2 inactivation | >80 | |
| Malignant, low-grade | None | |||
| Malignant, high-grade | Complex * | >90 | ||
| Synovial sarcoma | ||||
| Monophasic | t(X;18)(p11;q11) | SS18 (SYT)-SSX1 or SYT-SSX2 fusion | >90 | Prognosis |
| Biphasic | t(X;18)(p11;q11) | SYT-SSX1 fusion | >90 | |
| Wilms tumor | Deletion 11p13 | WT1 inactivation | Association with syndromic Wilms tumor | |
| 1p deletion | Adverse prognosis in low-stage FH | |||
| 16q deletion | Adverse prognosis in low-stage FH | |||
| 1q gain | Increased relapse risk |
* Indicates presence of complicated numeric and structural chromosomal aberrations.
| Histologic Findings | Cytogenetic Events | Molecular Events | Frequency (%) |
|---|---|---|---|
| Hodgkin, classic | Complex * | Clonal Ig rearrangements | 95 |
| Clonal IGH translocations | 17 | ||
| Clonal IGK translocations | 1 | ||
| Clonal IGL translocations | 3 | ||
| Clonal TCR rearrangements | 1-2 | ||
| Hodgkin, nodular lymphocyte predominance | t(3;14)(q27;q32) | BCL6 rearrangement | 50 |
| Burkitt | t(8;14)(q24;q32) | IGH-MYC rearrangement | 80 |
| t(2;8)(p11;q24) | IGK-MYC rearrangement | 5 | |
| t(8;22)(q24;q11) | IGL-MYC rearrangement | 15 | |
| Lymphoblastic (see Table 45-4 ) ALL | |||
| Anaplastic large cell | t(2;5)(p23;q35) | NpM1 (NPM)-ALK fusion | 80 |
| Various inversions and translocations | ALK fusions with TPM3, ATIC, CLTC and others | 10-20 | |
| Diffuse large B-cell | Complex * | ||
| Subcutaneous panniculitic T-cell | Clonal T-cell receptor rearrangements | ||
| Hepatosplenic T-cell | Isochromosome 7q; trisomy 8 | Clonal T-cell receptor rearrangements | >75 |
* Indicates presence of complicated numeric and structural chromosomal aberrations.
| Histologic Findings | Cytogenetic Events | Molecular Events | Frequency | Clinical Relevance |
|---|---|---|---|---|
| Early T-cell precursor ALL | MEF2C rearrangements (e.g., MEF2C-PITX2 ) or related rearrangements (NKX2-5/BCL11B, SPI1(PU.1)/BCL11B, ETV6/NCOA2) RUNX1-AFF3 rearrangement | AML-like aberrations: Cytokine receptor and RAS signaling mutations ( NRAS, KRAS, NF1, FLT3, IL7R, JAK3, JAK1, SH2B, BRAF; 67%) Inactivating hematopoietic transcription factor mutations ( GATA3, ETV6, RUNX1, IKZF1; 58%) Inactivating histone modifier mutations ( EZH2, EED, SUZ12, SETD2; EP300; 48%) Novel and other mutations (WT-1, DNM2, ECT2L, RELN) | Accounts for 5-16% pediatric T-ALL | Associated with poor prognosis, early T-cell differentiation arrest (CD1a–, CD8–, CD5weak, stem-cell or myeloid marker+, biallelic TRG deletions absent) |
| T-cell ALL | t(1;14)(p34;q11) | SCL(TAL1) -TCR alpha-delta locus fusions or SIL-SCL rearrangements | 30% T-cell ALL | |
| t(1;3)(p34;p21) | SCL-TCTA fusion | Rare | ||
| Chromosome band 11p13 translocations | LMO2- TCR loci fusions | 10%-20% T-cell ALL | ||
| Chromosome band 11p15, 19p13.2, or 10q24 translocations | LMO1, LYL1, TLX1 (HOX11)-TCR loci fusions | ? | ||
| t(7;9)(q34;q34) | TRB (TCRB)-NOTCH1 fusion, activating NOTCH1 mutations | <1% T-cell ALL | Gamma secretase inhibitor sensitivity | |
| t(6;7)(q23;q34) | TCRB-MYB (CMYB) fusion | Associated with young age | ||
| Activating NOTCH1 mutations | 50% T-cell ALL | |||
| PTEN gene mutation | 8% T-cell ALL | Associated with disease progression | ||
| t(10;14)(q24;q11) | HOX11(TLX1) overexpression, HOX11(TLX1)-TCRD fusion | Favorable prognosis | ||
| Chromosome band 9p21 deletion | CDKN2A (p16 INK4A -p14 ARF ) deletion; variable CDKN2B (p15 INK4B ) deletion | Associated with relapse, poor prognosis | ||
| Cortical T-cell ALL | NKX2-1 or NKX2-2 rearrangement TLX1 rearrangement MYB rearrangement | CD1+ immunophenotype, associated with favorable prognosis | ||
| T-cell ALL, precursor B-cell ALL | Translocations, inversions involving chromosome bands 14q32, 14q11, 7q34, 7p14 | Hybrid antigen receptor gene rearrangements | ? | |
| Chromosome band 9p21 deletion | CDKN2A (p16 INK4A )/p14 ARF ) deletion/variable CDKN2B (p15 INK4B ) deletion | 60% T-cell ALL, 20% childhood precursor B-cell ALL | ||
| Precursor B-cell ALL | Chromosome band 11q23 translocations | MLL (KMT2A) gene rearrangements | 80% of infant ALL | Poor prognosis especially in ALL and therapy-related cases, associated with FAB M4, FAB M5, other AML morphologies, leukemia cutis, extramedullary involvement, and topoisomerase II (TOP2) poison exposure |
| Hyperdiploidy | 30% precursor B-cell ALL | Favorable prognosis if >50 chromosomes and specific trisomies | ||
| Hypodiploidy | 6%-8% precursor B-cell ALL | Unfavorable prognosis if <44 chromosomes, −7, dicentric chromosome | ||
| t(12;21)(p13;q21) (cryptic; detectable by FISH only) | TEL-AML1 fusion | 25% of “common” ALL | Favorable prognosis | |
| t(9;22)(q34;q11) | BCR-ABL1 fusion | 5% precursor B-cell ALL | Poor prognosis, associated with older age, imatinib mesylate sensitivity | |
| t(1;19)(q23;p13.3) | E2A-PBX1 fusion | ~4% Precursor B-cell ALL; 25% cIg+ cases; <1% cIg− cases | Poor prognosis in cIg+ cases | |
| t(17;19)(q22;p13.3) | E2A-HLF fusion | 1% precursor B-cell ALL | Coagulopathy, poor prognosis | |
| t(5;14)(q31;q32) | IGH-IL3 fusion | <1% precursor B-cell ALL | Peripheral eosinophilia | |
| t(6;14)(p22.3;q32) | IGH-ID4 fusion | ? | Favorable prognosis | |
| t(1;19)(q23;p13.3) | MEF2D-DAZAP1 fusion | ? | ||
| FLT3 point mutation | 5% childhood precursor B-cell ALL, 16% infant ALL, ~21%-28% high hyperdiploid ALL, 18% MLL -rearranged ALL | Poor prognosis, increased FLT3-ITD allelic ratio associated with AML relapse, sensitivity to FLT3 tyrosine kinase inhibition | ||
| FLT3 ITD | 2% precursor B-cell ALL | Poor prognosis, increased FLT3-ITD allelic ratio associated with AML relapse, sensitivity to FLT3 tyrosine kinase inhibition | ||
| IKZF1 mutations | 10%-15% of precursor B-cell ALL | Poor prognosis | ||
| iAMP21 | Accompanying IKZF1, CDKN2A/B, PAX5, ETV6, and RB1 alterations | ~2% of B-cell precursor ALL in older children | Poor outcome with standard regimens | |
| Precursor B-cell ALL, | Chromosome band 9p21 deletion | CDKN2A (p16 INK4A -p14 ARF deletion; variable CDKN2B (p15 INK4B ) deletion | Associated with relapse, poor prognosis | |
| Precursor B-cell ALL “Ph-like ALL” | Cryptic rearrangements EBF1-PDGFRB, BCR-JAK2, STRN3-JAK2, PAX5-JAK2, NUP214-ABL1, ETV6-ABL1, RANBP2-ABL1 , RCSD1-ABL1, IGH-EPOR SH2B3 deletion | May also have IL7R mutation. Accompanying IKZF1 deletions (40%) Accompanying JAK mutations | 10% of precursor B-cell ALL, ~15% of cases of high-risk precursor B-cell ALL | Poor prognosis, preclinically responsive to TKI and JAK inhibition |
| Precursor B-cell ALL and precursor B-cell ALL in DS | CRLF2 rearrangements (Xp22.3/Yp11.3) with IGH (14q32) CRLF2 interstitial deletion ( P2RY8-CRLF2 rearrangement) | CFLF2 lesion may be F232C point mutation Accompanying JAK1 or JAK2 mutations in 50% Accompanying IKZF1 mutation/deletion Accompanying IL7R | Ph-like ALL, 15% of high-risk precursor B-cell ALL, 60% Down syndrome ALL, in non-DS high-risk ALL | Associated with poor prognosis high relapse rate, high MRD, associated with Hispanic ethnicity; preclinically responsive to signal transduction inhibitors (JAK, PI3K/mTOR) |
| B-cell ALL | t(8;14)(q24;q32) | IGH-MYC fusion | Rare | |
| t(2;8)(p12;q24) | IGK-MYC fusion | Rare | Poor prognosis | |
| t(8;22)(q24;q11) | IGL-MYC fusion | Rare | ||
| AML | t(8;21)(q22;q22) | AML1-ETO fusion | ~12% pediatric AML | Associated with FAB M2 morphology, granulocytic sarcoma presentation, favorable prognosis |
| Chromosome band 11q23 translocations | MLL gene rearrangements | 80% myelomonocytic-monoblastic AML in infants and young children; ~7%-18% pediatric AML | Poor prognosis especially in ALL and therapy-related cases, associated with FAB M4, FAB M5, other AML morphologies, leukemia cutis, extramedullary involvement, TOP2 poison exposure | |
| inv(16)(p13q22) or t(16;16)(p13;q22) | CBF-MYH11 fusion | ~7% pediatric AML | Associated with abnormal eosinophils (adults), FAB M2 or M4 AML without eosinophilia (pediatrics), favorable prognosis | |
| t(8;16)(p11;p13) | MOZ-CBP fusion | Rare | Unfavorable prognosis, erythrophagocytosis, coagulopathy, associated with leukemia cutis and spontaneous remission in neonates | |
| t(6;9)(p23;q34) | DEK-NUP214 (CAN) fusion | Rare | Unfavorable prognosis | |
| May be associated with t(8;21) or inv(16) | KIT mutation | 37% CBF AML | Sensitivity to imatinib, sensitivity to FLT3 tyrosine kinase inhibition | |
| NPM mutation | ~7%-8% pediatric AML | Favorable prognosis in absence of FLT3 ITD | ||
| FLT3 point mutation | 7%-9% pediatric AML | Poor prognosis, increased FLT3-ITD allelic ratio associated with AML relapse, sensitivity to FLT3 tyrosine kinase inhibition | ||
| FLT3 -ITD | ~12%-15% pediatric AML | Poor prognosis, increased FLT3-ITD allelic ratio associated with AML relapse, sensitivity to FLT3 tyrosine kinase inhibition | ||
| APL | t(11;17)(q23;q21) | PLZF-RARA fusion | Rare | Insensitive to ATRA |
| FLT3- ITD | ~30% pediatric APL | |||
| Therapy-related APL | t(15;17)(q22;q21) | PML-RARA fusion | Favorable prognosis, ATRA sensitivity, arsenic trioxide sensitivity | |
| Therapy-related MDS/AML, de novo MDS/AML | Monosomy 7/del(7q) | ~40% pediatric MDS, 49% RC, 4%-5% pediatric AML | Alkylating agent exposure, associated with disease progression, poor prognosis, can be familial | |
| De novo or therapy-related AML, ALL, MDS | Chromosome band 11p15 translocations | NUP98 gene rearrangements | ? | |
| Therapy-related MDS/AML | Monosomy 5, del(5q) | Alkylating agent exposure | ||
| May be associated with segmental jumping translocations | TP53 mutation | ? (more common in therapy-related than de novo MDS, AML) | Alkylating agent exposure, associated with AML in Li-Fraumeni syndrome | |
| Therapy related ALL and AML after exposure to TOP2 poisons | Chromosome band 11q23 translocations | MLL gene rearrangements | Poor prognosis especially in ALL and therapy-related cases, associated with FAB M4, FAB M5, other AML morphologies, leukemia cutis, extramedullary involvement, TOP2 poison exposure | |
| 5q− syndrome, refractory anemia | del(5q) | RPS14 deletion | ?—not described in children | Lenalidomide sensitivity |
| JMML, AML, MDS, precursor B-cell ALL | PTPN11 mutation | 30%-35% of JMML, 4% of AML, 18% of FAB M5 AML | Associated with Noonan syndrome | |
| JMML | May be associated with monosomy 7 | NF1 mutation | ~30% of JMML, ~50% of JMML in constitutional NF1 syndrome | Associated with constitutional NF1 syndrome |
| JMML, AML, MDS | May be associated with monosomy 7 in JMML/MDS or with t(8;21) or inv(16) in AML | KRAS or NRAS mutation | 20%-30% JMML, ~20%-30% pediatric AML, 30% monosomy 7 MDS | |
| CMML | t(5;12)(q33;p13) | TEL-PDGFRB fusion | Rare | Associated with eosinophilia, progression to AML |
| TAM, AMKL | May be associated with +8 if progression to AMKL | GATA1 mutations | Associated with Down syndrome | |
| Non–Down syndrome AMKL | t(1;22)(p13;q13) | OTT-MAL fusion | Rare | Found in neonates |
| Refractory cytopenia (RC) | Trisomy 8 | 9% of RC | ||
| Assay Consideration | METHOD | ||||
|---|---|---|---|---|---|
| Karyotyping | FISH | CGH | SNP | PCR Sequencing | |
| Cost of assay | High | Low | High | High | Low |
| What types of tumor material can be used? | Fresh | Any | Fresh, frozen * | Fresh, frozen * | Any |
| Does assay detect translocations? | Yes | Yes | No | No | Yes |
| Does assay detect point mutations? | No | No | No | No | Yes |
| Does assay detect deletions? | Yes | Yes | Yes | Yes | Yes, if qPCR |
| Does assay detect amplifications? | Yes | Yes | Yes | Yes | Yes, if qPCR |
| Does assay detect low-frequency mutations? | No | Yes; 1 in 100 | No | No | Yes; 1 in 10,000 |
| Does assay permit genome-wide evaluation? | Yes | No | Yes | Yes | No |
* Can be performed using DNA extracted from paraffin materials, but with some loss of resolution.
Cytogenetic and Molecular Methodologies
The pathognomonic genetic aberrations in pediatric cancer can be evaluated by various methods. Because each of these methods has a different profile of substrate requirements, sensitivity, and specificity (see Table 45-4 ), the optimal approach must be tailored individually in regard to both the nature and quantity of material available and to the precise information being sought.
Karyotyping
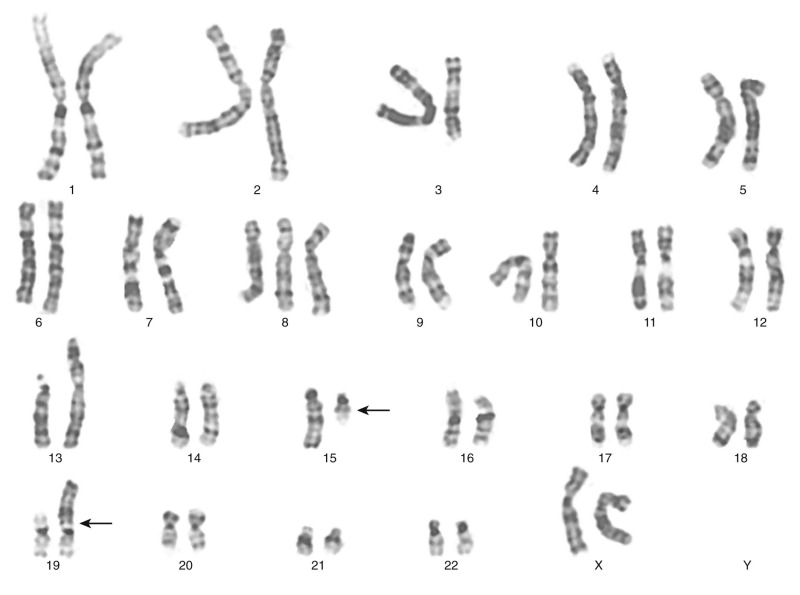
The traditional karyotype provides a low-resolution snapshot of the entire genome. Cells are cultured, arrested in metaphase, and then subjected to staining of the chromosomes to produce characteristic banding patterns, which are described using standardized nomenclature ( Box 45-1 ). Probably the major advantage of karyotypic analysis is the provision of a global overview of the chromosomal composition of a cultured cellular population without any requirement for preknowledge, especially enabling the identification of completely novel aberrations ( Fig. 45-1 ). However, karyotyping has distinct limitations, including the requirement for fresh material in sufficient amounts and slow turnaround because of time required for tumor cell growth.
cDNA: complementary DNA
cen: centromere
CGH: comparative genomic hybridization
CISH: chromogenic in situ hybridization
del: deletion
dmin; double minute chromosome (extrachromosomal amplicon)
FISH: fluorescence in situ hybridization
hsr: homogeneously staining region (intrachromosomal amplicon)
ins: insertion within chromosome
inv: inversion of chromosome segment
ISH: in situ hybridization
mar: marker chromosome (aberrant chromosome whose origin cannot be ascertained)
p: chromosome short arm
q: chromosome long arm
r: ring chromosome
SKY: spectral karyotyping
t: translocation
tel: telomere
Need for Sufficient Viable Tumor Cells
Solid tumors may comprise substantial nonviable or hypocellular regions containing few neoplastic cells. Such regions may be extensively necrotic because the tumor cells have died, having outstripped their blood supply. Other regions of a tumor mass may be composed largely of blood (hemorrhage) or scar tissue (fibrosis). Therefore in the case of solid tumor karyotyping, it is crucial that the pathologist select a maximally viable region for analysis.
Unpredictable Tumor Cell Growth in Culture
Even when tumor tissue has been selected from an optimal region, the unpredictable growth of neoplastic cells in culture remains a major consideration. Benign tumors often contain only few mitotic cells and so one generally has to wait several days before such specimens proliferate actively in culture. In the meantime, the culture may become overgrown by nonneoplastic cells, such as fibroblasts. Perhaps surprisingly, even highly malignant solid tumors may grow poorly in tissue culture, despite the fact that they grew well in the patient. Such tumor cultures may occasionally be stimulated by the use of specialized culture media or growth factors, but it is impractical in most clinical cytogenetic laboratories to troubleshoot tissue cultures to optimize the growth of each tumor type. Therefore in practice it may be challenging to culture and karyotype certain types of pediatric tumors in the clinical laboratory. In the case of bone marrow cytogenetics, it is well known that posttherapeutic specimens can be difficult to analyze, being hypocellular and containing cells—reactive and/or neoplastic—that have been temporarily growth-arrested by therapy and therefore fail to give rise to metaphases in culture.
Nonrepresentative Cell Culture
It is also important to recognize that only a subpopulation of cells within a given sample might be capable of growing under a particular set of culture conditions. Therefore one cannot necessarily assume that a clonally abnormal karyotype is representative of the overall neoplastic process. For example, in a given tumor, the final karyotype might be representative of the components of the tumor that were more or less clinically aggressive, depending on which component was best suited for growth under the particular culture conditions used at that time.
Culture Overgrowth by Nonneoplastic Cells
All tumor samples contain mixtures of neoplastic and nonneoplastic cells. The nonneoplastic elements may include hematopoietic cells, fibroblasts, normal epithelial cells, endothelial cells, or glial cells, depending on the type and location of the tumor. Any of these reactive or support cell types might proliferate more successfully than the neoplastic cells in culture. Invariably, when a pediatric cancer submitted for cytogenetic analysis is reported to have a normal karyotype, the normal karyotype is a false-negative result, only signifying that the culture was overgrown by normal cells. Therefore the cytogenetic analysis must always be timed carefully, so that metaphases are analyzed at a point at which the neoplastic population is actively dividing. This technical challenge can, in the case of solid tumors, be met if the cytogeneticist develops familiarity with the distinctive morphologies of the various neoplastic and reactive cell types and then inspects the tissue cultures daily to determine when the neoplastic cells have the proliferative advantage.
Complex Karyotype
Beyond the initial challenges incurred at the culture stage, various additional considerations influence the success of cytogenetic evaluation in different types of pediatric cancer. For example, conventional karyotyping can be challenging in many high-grade solid tumors, in which the karyotypes are often complex compared with those seen in leukemias and lymphomas. A single metaphase cell from such cancers can contain dozens of clonal and nonclonal chromosomal aberrations, making it impractical to characterize the exact mechanisms of rearrangement responsible for each chromosomal aberration or to estimate the relative significance of any of these abnormalities.
Technical Limitations in Detecting Aberrations
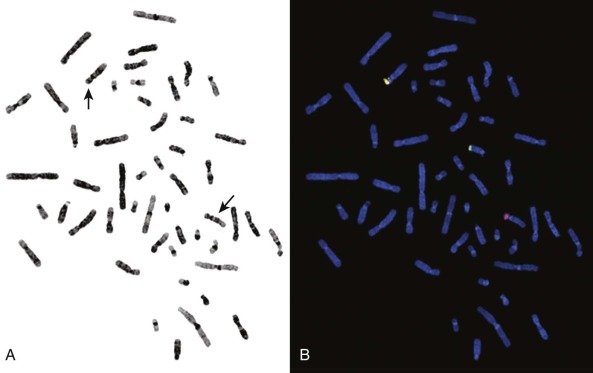
There are certain aberrations that cannot be detected by karyotyping, because the resolution is too low. These include smaller deletions or amplifications and point mutations, but also cryptic or masked aberrations, which include, for example, the chromosomal translocation t(12;15) characteristic of congenital or infantile fibrosarcoma, congenital cellular mesoblastic nephroma, secretory breast carcinomas, and a subset of acute myelogenous leukemias ( Fig. 45-2 ). Another translocation that cannot be resolved by conventional karyotype analysis is the t(12;21), which is the most common translocation in pediatric leukemia. It is found in a large fraction of common acute lymphoblastic leukemia (ALL) in children and fuses the ETV6 (TEL) and RUNX1 (AML1) genes.
In essence, then, the major advantage of karyotypic evaluation of solid tumors is the breadth of the data provided. Notable challenges include the successful culture of representative tumor cells, particularly because this is essentially a one-shot approach, with no opportunity to return to the specimen, because the window of opportunity for culture is confined to the short period of viability of fresh cells after biopsy. Even when culture is successful, meaningful interpretation of the findings on karyotype may represent a further challenge, depending on the number and nature of the aberrations.
Although solid tumors are less readily accessible for biopsy compared with hematologic neoplasms, minimally invasive sampling by a percutaneous approach is becoming more common. Needle biopsy is often performed under ultrasound or computed tomographic (CT) guidance and can involve fine-needle aspiration or needle core biopsy of the tumor. Solid tumor samples obtained by these methods can be karyotyped successfully, but the small amount of starting material is a constraint in that fewer cultures can be established. Because the successful cytogenetic evaluation of tumors in standard practice is limited by these factors, alternative, more robust methods are needed for the successful routine demonstration of genetic aberrations. Traditionally, these have included fluorescence in situ hybridization (FISH) and polymerase chain reaction (PCR) techniques, which have the distinct advantage of applicability to fixed material and therefore also to large cohorts of archival cases. Both FISH and molecular analyses can be straightforward also in fine-needle specimens.
Molecular Cytogenetics
Recombinant DNA Technologies
Southern Blot Analysis.
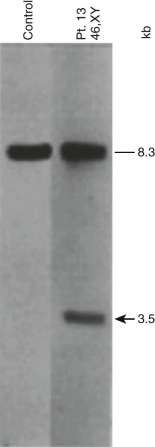
In pediatric solid tumors, leukemias, and lymphomas, recombinant DNA technologies, including Southern blot analyses of candidate genes relevant to particular disease states, can overcome limitations of conventional karyotype analysis for the detection of chromosomal aberrations ( Fig. 45-3 ). Although no longer used extensively in most clinical diagnostic laboratories, Southern blotting has served an important role in gene discovery. That is, genomic Southern blot analyses, coupled with PCR-based molecular cloning and gene sequencing strategies, have identified unknown partner genes fused to various known genes in chromosomal translocations. For example, the demonstration of immunoglobulin (IG) and T-cell receptor (TCR) loci rearrangements in leukemias and lymphomas, as evidenced by altered size of restriction enzyme fragments on genomic Southern blot analyses, has been essential in highlighting crucial regions that could be studied by molecular cloning strategies and that characterize the genomic translocation breakpoint junction sequences that define these tumors ( Fig. 45-4 ). The molecular principles that provide the basis for current clinical molecular cytogenetic diagnostic strategies (e.g., FISH) in pediatric leukemias and solid tumors are not substantially different from the recombinant DNA concepts used in Southern blotting. Some seminal examples of gene rearrangements characterized originally by Southern blotting and now detected routinely by FISH include MYC gene rearrangements, involving the IGH or IGL chain loci in Burkitt lymphoma, and MLL (KMT2A) rearrangements, of which the first characterized type was associated with t(4;11), resulting in MLL-AFF1 (AF4) fusion.
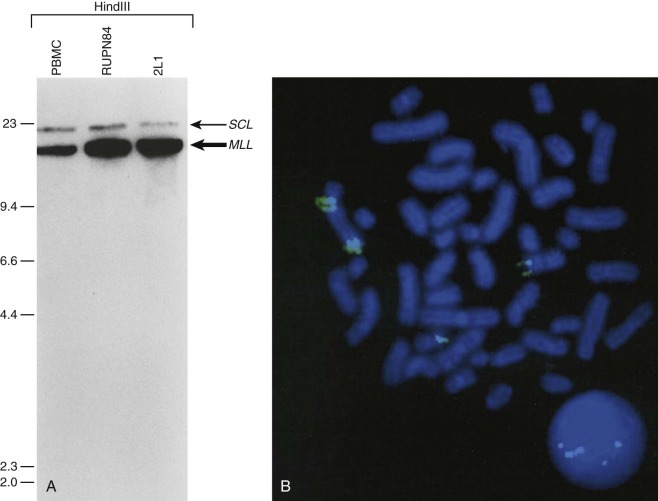
Another application of Southern blot analysis has been in discerning gene copy number variation. One example is MLL gene amplification (see Fig. 45-4 ), involving an interlocus DNA rearrangement known as segmental jumping translocation in which the unrearranged MLL DNA segment is amplified and translocated to various regions of the genome.
Fluorescence and Chromogenic in Situ Hybridization.
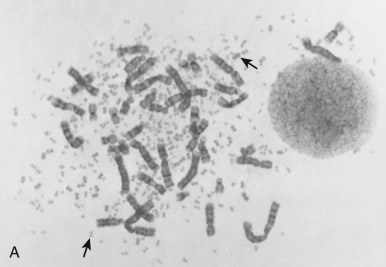
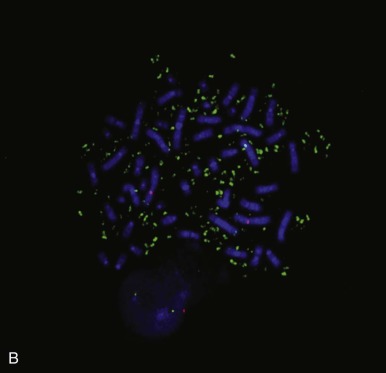
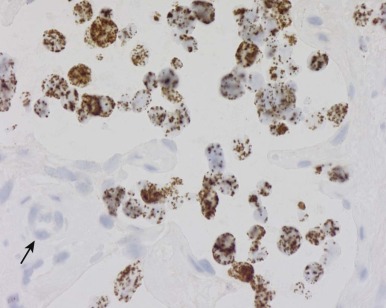
Whereas conventional cytogenetic analyses are performed using staining techniques that highlight chromosomal banding patterns (1;2), the various molecular cytogenetic methods interrogate chromosomal regions of interest by using nucleic acid probes. Most molecular cytogenetic methods use some variant of in situ hybridization (ISH), in which DNA probes are hybridized and evaluated in the cellular context. These probes are usually cosmids, containing an approximately 40-kb sequence of interest or bacterial artificial chromosomes, containing hundreds to a few thousand kilobases of sequence. ISH assays can be performed with fluorescence or enzymatic detection, referred to as FISH and CISH (chromogenic in situ hybridization), respectively ( Figs. 45-5 and 45-6 ).
Flexibility of in Situ Hybridization: Substrate Options.
FISH and CISH analyses are performed routinely in cytogenetic preparations (metaphase spreads) and in paraffin sections and other archival pathologic preparations. Substantial advantages of using paraffin sections include the following: (1) the abundance of source material for each case permits retrospective and repeat analyses; and (2) the well-preserved cell morphology can guide evaluation of the chromosomal events in the relevant cell populations. However, a drawback in the use of paraffin sections is that the nuclei are generally incomplete, having been sliced through during preparation of the sections by microtomy. This limitation can be addressed by performing the ISH assays with nuclei disaggregated from thick (50- to 60-µµ) paraffin sections or from thin cores of the paraffin block.
Resolution.
Most ISH studies have a resolution of one to several megabases on metaphase spreads. Notwithstanding the aforementioned problems of interphase FISH on fixed material, the technique offers the advantage of higher resolution, given the less compact arrangement of DNA in interphase nuclei. Higher-resolution FISH techniques have been developed in which the DNA is essentially stretched out over a slide, as in direct visual hybridization (DIRVISH), resulting in a resolution of between 700 and 5 kb, or fiber FISH, in which the resolution is between 500 kb and just a few kilobases.
Highly Combinatorial Modifications of FISH.
Various molecular cytogenetic methods have expanded the capabilities of FISH, enabling evaluation of the entire genome or karyotype. Examples include comparative genomic hybridization (CGH) and spectral karyotyping (SKY). CGH is performed by extracting total genomic DNA from a tumor of interest and from a nonneoplastic control cell population. These DNAs are differentially labeled (e.g., tumor DNA with fluorescein and control DNA with rhodamine) and in the earliest applications were cohybridized against normal metaphase cells (metaphase CGH), although these methods have been rapidly supplanted by higher-resolution assays in which the sample DNAs are hybridized against arrayed clones (array CGH) or interrogated for presence of informative single nucleotide polymorphisms (SNPs) as an indicator of copy number and heterozygosity across the genome (discussed later).
An advantage of CGH, compared with conventional karyotyping, is that the tumor DNA can be isolated from frozen or even paraffin specimens, without any need for cell culture, thereby avoiding the selection pressures imposed by culture and instead capturing an overview of the in vivo situation, although diluted by the admixture of support stromal DNA. In addition, the array CGH methods (discussed later) can detect very small deletions, which would be overlooked by traditional cytogenetic banding assays and might even be missed by FISH. However, CGH does not detect the balanced chromosomal rearrangements, particularly the translocations that are the genetic hallmarks of many pediatric cancers. Furthermore, while detecting chromosomal amplifications and deletions reliably, the technique does not provide a functional assay in terms of expression level changes.
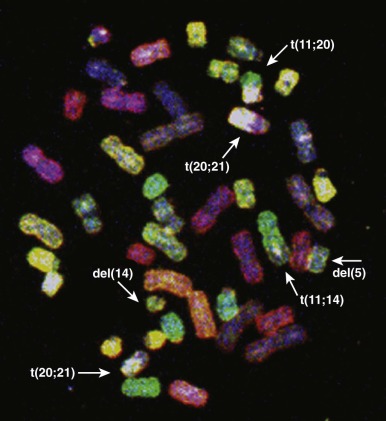
Genome-wide molecular cytogenetics can be performed using spectral karyotyping or M-FISH, in which entire panels of DNA probes are simultaneously hybridized against tumor metaphase cells. Whereas conventional FISH techniques involve hybridization of one or two fluorescence-tagged probes, the spectral karyotyping and M-FISH methods use probes for each chromosome or chromosome arm (24 or more probes). Each probe is then detected combinatorially, using different ratios of fluorescence markers, such as fluorescein and rhodamine. By varying the ratio of fluorescence tags, each chromosome can be visualized with a unique color ( Fig. 45-7 ). Thus spectral karyotyping enables a comprehensive ISH screen of the entire tumor cell karyotype. Spectral karyotyping and M-FISH are powerful research tools in tumor cytogenetics and have been useful in identifying rearrangements that are cryptic by conventional cytogenetic banding methods or that are highly complex. However, these techniques have generally been supplanted by array CGH and SNP profiling methods (see later).
Routine Applications of FISH.
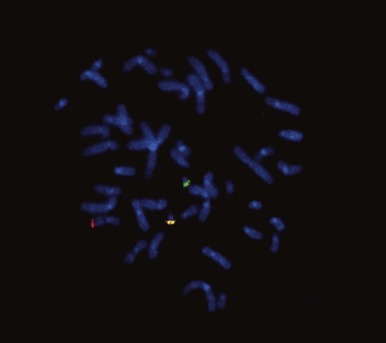
Most ISH studies performed in clinical laboratories are focused on investigating deletions, rearrangements, or amplifications of particular gene loci or chromosomes. The probes used for FISH analysis of chromosomal translocations (and other balanced cytogenetic rearrangements) generally fall into two categories. First, there are those that hybridize to a region spanning a breakpoint on one involved chromosome, producing a split signal in the presence of chromosomal rearrangement (see Fig. 45-2 ), Second, there are probes designed to come together in the presence of a fusion, in which a probe labeled with one fluorochrome hybridizes to one partner gene and the other, differentially labeled, to its fusion partner, with these producing a fused fluorescent signal only in the presence of a gene rearrangement.
Maximizing Data Yield from Individual FISH Probes for Rearrangements.
Judicious selection of break-apart FISH probes can allow applicability to a wide variety of tumors, in which the probe interrogates a frequently rearranged gene such as EWSR1 in various solid tumors or MLL in leukemias. The EWS gene undergoes rearrangement with various ETS family genes in Ewing sarcoma and EWSR1 is rearranged in pediatric desmoplastic round cell tumors and clear cell sarcomas of soft parts, among others. Each of these diagnostically useful EWSR1 rearrangements can be demonstrated using a single EWSR1 break-apart FISH probe ( Fig. 45-8 ), with ultimate diagnosis requiring interpretation of the molecular findings in the context of the histology.
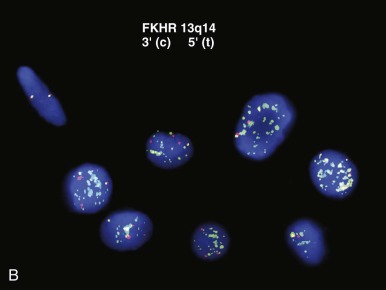
Additional gross genetic aberrations routinely accompanying chromosomal translocation may be exploited to refine interpretation of FISH-based analysis in certain contexts. For example, FOXO1 gene FISH can distinguish the PAX7-FOXO1 and PAX3-FOXO1 oncogenic fusions in alveolar rhabdomyosarcoma, given that the PAX7-FOXO1 (but not the PAX3-FOXO1 ) is invariably highly amplified in these tumors. This distinction is warranted because of its prognostic significance. In the typical scenario, in which routine pathologic evaluation by light microscopy of hematoxylin and eosin (H&E)-stained sections with accompanying immunohistochemistry has generated a reasonably narrow differential diagnosis, genetic testing by this type of assay is highly informative and increasingly being used. Generally, this somewhat looser FISH-based assay may be regarded as having optimal attributes, providing greater sensitivity than karyotypic analysis and being capable of detecting cryptic or masked translocations while not being burdened by the restrictive specificity of PCR-based assays, a feature that is especially advantageous for detection of variant translocations.
FISH in the Analysis of Gains and Losses.
Although quantitative assessment of gene amplifications and deletions can be obtained by quantitative PCR (qPCR) or FISH, in practice such assays are more often conducted in clinical laboratories by FISH-based methods. In the example of MYCN amplification in neuroblastoma, FISH detection is performed routinely (see Figs. 45-5 and 45-6 ). Assessment of MYCN amplification may alternatively be done by semiquantitative PCR, using a standard PCR assay with normal (unamplified) and known amplified controls and multiplexing the reaction to include a housekeeping gene along with the gene of interest. However, such assessments can be confounded by intratumoral heterogeneity. In neuroblastoma, this heterogeneity may encompass substantial variations in cellular composition and maturation, and thus careful selection of tumor tissue for analysis is essential. The analysis of poorly selected tissue for MYCN evaluation (e.g., submission of schwannian stroma) will otherwise yield a false-negative result. Moreover, contributions of different components of the neuroblastic tumor in the final DNA isolate can dilute out regional (neuroblast-specific) MYCN amplification, again yielding false-negative results. In this context, there is a distinct advantage to the FISH assays for MYCN amplification, because such methods permit correlation with cytology or morphology for the detection of regional heterogeneity of MYCN amplification, particularly when performed in tissue sections or multifocal touch imprints.
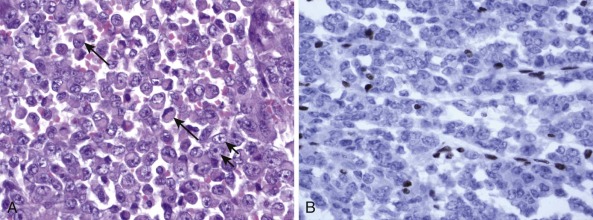
Detection of deletions by FISH is a more complex matter and particularly challenging when using fixed tissue, in which the assay is for an absence of signal and one is dealing with interphase nuclei, by definition incomplete (sliced through by microtomy), with an admixture of normal stromal cells further confounding the picture. Where cytogenetically abnormal metaphase spreads are available, these problems are largely circumvented, but there are other potentially more suitable technical strategies that might be used, including PCR-based assays— again with the caveat of normal cell admixture—to establish loss of heterozygosity (LOH). The immunohistochemical stain may provide a ready assay for such detection, as in the case of the SMARCB1 gene on chromosome 22q, commonly deleted in malignant rhabdoid tumors ( Fig. 45-9 ), and atypical teratoid rhabdoid tumors.
Polymerase Chain Reaction–Based Molecular Assays
General Applications of PCR-Based Methods
Since the initial description of the basic PCR assay, critical modifications of the technique have led to massive expansion of the applicability of this technology. The initial methodology involved the use of a DNA template from which a sequence of interest could selectively be amplified. This methodology provides the basis for testing for LOH, which relies on the natural allelic heterogeneity of repeat sequences in the vicinity of a gene of interest. Where a genomic region is deleted, the concomitant loss of an adjacent allelic repeat sequence results in PCR amplification of only one version of the repeat sequence, thus producing hemizygosity (seeming homozygosity) at that locus.
Reverse-Transcriptase PCR Assay.
When a particular question revolves around the presence of a specific transcript, the starting material is RNA, which is subjected to reverse-transcriptase PCR (RT-PCR), a highly sensitive technique. The principle is that total RNA extracted from fresh, flash-frozen, or fixed material is reverse-transcribed into first-strand complementary DNA (cDNA). This provides the template for testing for the presence of fusion oncogene transcripts using primers complementary to the involved partner genes flanking the fusion point in the chimeric transcript and which cannot therefore generate a product from unrearranged normal transcript. The technique is extraordinarily sensitive, able to detect as few as 1 in 10,000 cells bearing a fusion transcript. The presence of just a small neoplastic component within a tissue sample for genetic testing is therefore sufficient for detection. Thus this PCR-based technology is useful for the detection of minimal residual disease and well suited for the surveillance of hematologic malignancy, in which serial peripheral blood or bone marrow specimens are obtained for routine follow-up of patients. However, this same sensitivity of PCR-based methods carries with it the risk for false-positive results, from cross-contamination of minute amounts of fusion gene templates within assays or detection of very-low-level biologically insignificant fusion transcripts within specimens. Although moot in the context of demonstrating uniquely tumor-associated aberrations (e.g., fusion products), ideally DNAse I treatment of the RNA substrate should be performed to eliminate the possibility of inadvertent genomic amplification during RT-PCR.
Specificity of RT-PCR Reaction.
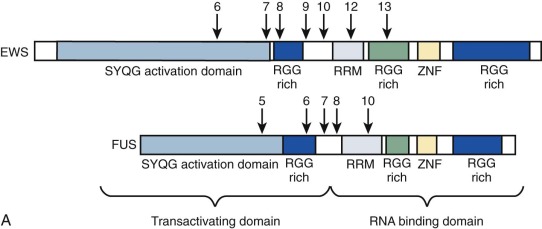
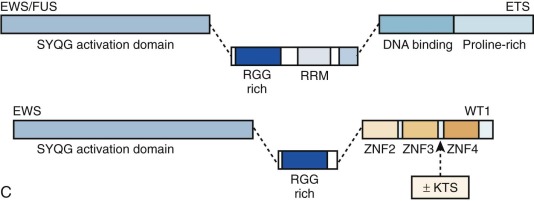
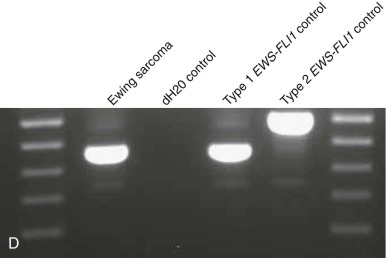
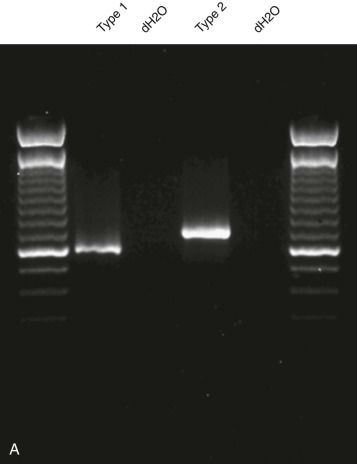
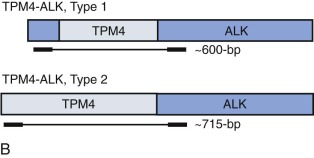
Breakpoint variability within the genes involved in translocation-generated fusion oncogenes has prognostic implications in some cases. This is reported for Ewing sarcoma and synovial sarcoma, in which a favorable prognosis is associated with a type I fusion of EWS exon 7 to FLI1 exon 6 compared with all other combinatorial variations in Ewing sarcoma ( Fig. 45-10 ). SYT-SSX2 fusion in synovial sarcoma is similarly reportedly associated with better patient outcome. Assays may be designed to address breakpoint variability through choice of primers, selectively amplifying only one variant product, or by choosing consensus primers that will amplify several transcripts and then sequencing the product to establish the precise nature of the transcript. An indication of transcript type might already have been obtained from gel electrophoresis demonstrating the product size ( Fig. 45-11 ; see Fig. 45-10 ). PCR-based assays are best suited to the detection of such fine genetic detail, which cannot be detected by karyotypic analysis and only by specifically designed FISH assays. Currently, distinction among variant transcripts generally remains of academic interest because it provides no basis for therapeutic stratification.

In the case of MLL translocations, not only can one of more than 50 different partner genes be fused to MLL but it has also been suggested that the various partner genes of MLL affect the prognosis. In this case, PCR with gene-specific primers has been one approach to identify fusion transcripts involving some of the more common partner genes of MLL, and primer combinations for different MLL transcripts can be combined in a multiplex PCR reaction. This is most feasible in ALL, where the MLL partner genes are less heterogeneous than in acute myeloid leukemia (AML). Alternatively, approaches such as cDNA panhandle PCR can detect the fusion transcript produced by the 5′- MLL partner gene 3′ rearrangement using primer sequences derived from MLL. This is accomplished by the generation of a stem loop template in which a known MLL sequence has been attached to the unknown partner sequence by reverse transcribing the first-strand cDNA from total RNA using a 5′- MLL -random hexamer adapter-3′ primer for the primer extension.
Additionally, genomic panhandle PCR approaches and long distance inverse PCR approaches are alternatives for characterizing translocations in which the sequence of only one of the involved genes is known. And increasingly, intron-capture methods, coupled with sequencing, are used in high-throughput sequencing screens to identify oncogene fusion partners.
One clinical scenario that requires the ability to detect a broad range of chromosomal translocations, including unknown or rare fusion variants, is in surveillance screening for evidence of a preleukemic state in chemotherapy-exposed patients, before these patients manifest frank secondary leukemia. Advances in sensitive molecular PCR-based screening methods and molecular cytogenetic screening methods such as FISH will better enable the prospective detection of chromosomal translocations, which is crucial in such applications.
Quantitative PCR Assay.
Simultaneous PCR of a constitutively expressed housekeeping gene provides an internal control. A standard positive control may be used as a comparator across a series of cases to rank these in a semiquantitative approach. Use of qPCR methods can provide precise information about the actual copy number of oncogene transcripts (gene expression level) by qRT-PCR or gene copy number when genomic DNA is used as template material. qPCR has advantages of increased reliability and reproducibility over conventional PCR. Because it provides data accrued during the entire cycle, rather than just end-point analysis, as in standard PCR, it will discriminate between different assays quantitatively rather than based on product size differences. Additionally, the graphic readout of accumulating fluorescence generated within each tube or well during the reaction is instantaneous (real time) and therefore no delaying additional step for product analysis is required. In conventional PCR, the amplification products must typically be evaluated by gel electrophoresis. Therefore the assay turnaround time is minimized in qPCR, so that a complete analysis can be performed in only a few hours. qPCR is more sensitive, with an ability to detect twofold changes in expression level as opposed to a tenfold cutoff for standard PCR assays. If desired, the products can still be subjected to gel electrophoresis (e.g., to evaluate product size). Various forms of qPCR are available, including (1) an SYBR green-based method, detecting double-stranded DNA product accumulation by binding to the minor groove of double-stranded DNA nonspecifically and thus being more readily subject to false positivity because of contamination or detection of primer-dimer; and (2) TaqMan methodology, based on highly specific primer-probe combinations. In TaqMan qPCR, a probe labeled with a fluorescent dye at one end (5′) and a quencher at the other (3′) is designed to bind within the sequence amplified by qPCR. In the unbound state, the proximity of quencher to the fluorescent dye inhibits detection of the fluorescence through Foerster resonance energy transfer (FRET). Once the probe has bound within the amplified sequence, 5′ exonuclease activity of the polymerase enzyme leads to probe cleavage and dissociation of fluorescent dye and quencher, with ensuing accumulation of fluorescence proportional to product amplification (strictly probe cleavage). Multiplexing of reactions is possible with TaqMan but not SYBR green technology.
Array Comparative Genomic Hybridization and Single Nucleotide Polymorphism Profiling Assays
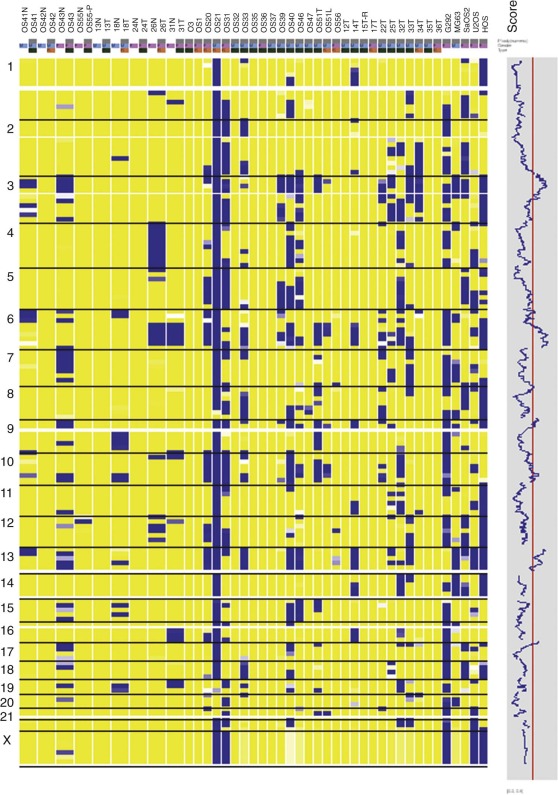
Conventional metaphase CGH, which was summarized previously, was made obsolete by the advent of array CGH, in which the tumor DNA is hybridized instead to high-density arrays of probes covering the entire genome. Array CGH provides a much higher-resolution genome-wide definition of genetic gains and losses. However, conventional and array-based CGH do not detect balanced chromosome translocations, a hallmark of many pediatric cancers. Genome-wide SNP assays ( Fig. 45-12 ), like array CGH, are used increasingly as a higher-resolution alternative to conventional karyotyping for genome-wide assessments of gene copy number alterations, and, unlike array CGH, the SNP methods have the advantage of demonstrating LOH, even in situations in which gene copy number is normal (copy number neutral LOH). However, SNP profiling generally provides less quantitative assessment of copy number gains compared with array CGH.
Next-Generation Sequencing and Other Techniques
In light of the ever-increasing number of gene fusions identified in pediatric sarcomas and hematologic neoplasms, the need for more efficient, multiplexed methods for their detection is becoming more pressing. Increasingly, molecular diagnostic laboratories are implementing variations of next-generation sequencing toward these ends. Whereas few laboratories now employ comprehensive genome sequencing (exome, whole genome, or whole transcriptome) in routine diagnostics, more targeted high-throughput sequencing panels have become commonplace. Typically, these panels focus on gene perturbations with known prognostic, predictive, or diagnostic relevance in cancer, detecting hundreds of clinically relevant mutations in a single panel. Although the translation of these new approaches based on next-generation sequencing into routine diagnostic assays is moving quickly, there remain challenges to routine implementation for diagnosis, including the need for relatively large amounts of high-quality nucleic acids. In addition to next-generation sequencing, there are various other novel and promising methods for detecting the ever-expanding variety of diagnostically relevant gene rearrangements in cancer. These include the NanoString nCounter system, which detects individual messenger RNA (mRNA) molecules without PCR amplification in a quantitative and highly multiplexed fashion and antibody detection of translocations assays.
It might be surmised that the optimal setup of a tumor genetics laboratory in the pediatric context would strive to culture cells from all newly diagnosed tumors. It would largely rely on FISH-based assays to screen for rearrangements or amplifications of commonly involved genes such as EWSR1, FOXO1, MYCN, MLL, and ALK but retain expertise in PCR for detection of gene rearrangements and minimal residual disease and array-based or sequencing screens for more comprehensive evaluations of actionable mutations across the broad spectrum of pediatric hematologic neoplasms and solid tumors.
Genomic Mechanisms in Pediatric Tumors
The cytogenetic aberrations in pediatric tumors can be extremely simple, involving loss or rearrangement of only a single chromosome, or can be highly complex, as manifested by a karyotype showing dozens of abnormal chromosomes. Complexly abnormal pediatric cancer karyotypes, containing 10 or more clonal rearrangements, are most often found in highly malignant solid tumors, such as osteosarcoma. On the other hand, a subset of highly malignant solid tumors, such as Ewing sarcoma and synovial sarcoma, has noncomplex karyotypes. Therefore the absence of cytogenetic complexity is not, in itself, a reassuring finding.
Clinically relevant chromosomal aberrations in pediatric tumors result in amplification, translocation, or deletion of various target genes. Amplifications, manifest as intrachromosomal homogeneously staining regions or extrachromosomal double minutes (see Fig. 45-5 ), are of greatest clinical relevance in neuroblastoma. They are also seen frequently in subsets of rhabdomyosarcoma, osteosarcoma, and central nervous system (CNS) tumors and in leukemia, in which DNA segments encompassing various amplified oncogenes can be translocated to different regions of the genome. This phenomenon is termed segmental jumping translocation. Deletions are generally believed to target tumor suppressor gene loci. Although of limited ancillary diagnostic value, detection of deletions may have prognostic implications (see Tables 45-1 and 45-3 ). Chromosomal translocations are particularly frequent in leukemias, lymphomas, and sarcomas, where they typically create fusions of regulatory or coding sequences in genes located at the breakpoints of the participant chromosomes. Translocations result from double-strand DNA breaks, which are believed to occur more frequently in cancer cells than in normal cells, presumably as a manifestation of the genetic instability that is characteristic of many cancers. Most random translocations arising in cancer cells do not create functionally significant oncogenes and are therefore not selected for and retained by most of the cells in that cancer. The cytogenetic evidence suggests that at most a limited variety of translocations serve an oncogenic role in any given type of pediatric cancer. Many such recurring translocations have clinical use as diagnostic biomarkers (see Tables 45-1, 45-2, and 45-3 ) or for identifying tumor-specific therapeutic targets (see Tables 45-1 and 45-3 ).
Some translocation breakpoints directly interrupt the coding sequences of the target genes, leading to the creation of a fusion oncogene. Other breakpoints are outside of the gene coding sequences but nonetheless alter transcriptional regulation of the target gene. In the case of coding sequence fusions, important functional domains from the two component genes are generally brought together by the chromosomal rearrangement. For example, fusion kinase oncogenes often result from apposition of the kinase gene catalytic domain with a translocation partner’s protein-protein association domain (oligomerization domain). Such fusions lead to constitutive activation of the kinase. In other translocations, the intact coding sequence of a particular gene, usually one expressed at weak to undetectable levels in the nonneoplastic progenitor cell, is overexpressed by translocational juxtaposition to highly active promoter and enhancer sequences. One well-known example occurs in Burkitt lymphomas, in which MYC oncogene expression is increased by translocation into various transcriptionally active IG gene regions. The following sections review considerations of causative factors for translocation-associated oncogenes and provide key examples of their structural and functional roles in pediatric cancers.
Causes and Predisposing Factors for Chromosomal Translocations
The underlying mechanisms responsible for the genesis of chromosomal translocations are still poorly understood, but DNA double-strand breakage is a key step in this process. This may be induced by intracellular (endogenous) or extracellular (exogenous) agents. Some endogenous processes associated with double-strand breakage include V(D)J recombinase-mediated intrachromosomal rearrangements at IG or TCR loci, meiotic recombination between homologous chromatids, topoisomerase II (TOP2)–mediated changes in DNA topology that are required for DNA strand passage during mitosis and for the relaxation of supercoiled DNA for RNA transcription, and production of DNA-damaging agents (e.g., oxygen free radicals) from spontaneous hydrolysis, which themselves can alter DNA topology. Among the many exogenous insults causing double-stranded DNA breakage, ionizing radiation is the most extensively studied and has been shown to disrupt hydrogen bonds and sugar-phosphate backbones, damage purine and pyrimidine bases, and induce cross-links between DNA strands. Such damage can lead to single- or double-strand DNA breakage. Notably, the locations of chromosomal breakage induced by ionizing radiation are not entirely random. Rather, smaller chromosomes appear to be disproportionately affected, as are regions rich in GC repeats. Other inducers of chromosomal breakage include ultraviolet A–activated psoralens, chemotherapeutic agents, and DNA endonucleases.
One class of chemotherapeutic agents that can induce chromosomal breakage is the alkylating agents, such as nitrogen mustards, mitomycin C, nitrosoureas, and platinum compounds, which form DNA adducts and cause intrastrand and interstrand DNA cross-linkage. DNA damage caused by treatment with these agents is associated with secondary myelodysplastic syndrome (MDS) and secondary leukemias, whose salient molecular cytogenetic features include complex numerical and structural abnormalities that often involve loss of chromosome 5, 5q, 7, or 7q. Noteworthy also is that germline and somatic mutations in the TP53 tumor suppressor protein, which is critical for DNA damage recognition, are frequent in secondary leukemias with chromosome 5q abnormalities and a complex karyotype, suggesting that genomic instability caused by loss of TP53 predisposes to this treatment complication. The second class of chemotherapeutic agents that can induce chromosomal breakage are the TOP2 poisons, which target the nuclear enzyme topoisomerase II (e.g., the epipodophyllotoxins etoposide and teniposide; the anthracyclines doxorubicin, daunorubicin, and idarubicin; the anthracenedione mitoxantrone; and the combined topoisomerase I/topoisomerase II poison dactinomycin).
Studies on genomic instability mechanisms in the yeast Saccharomyces cerevisiae have implicated defects in double-strand DNA breakage repair as causative factors in chromosomal translocations. These repair defects can involve homologous recombination repair or nonhomologous end joining. Homologous recombination repair necessitates guidance of the DNA repair mechanism by two homologous sister chromatids and is therefore more active in the G2 and S phases of the cell cycle. Nonhomologous end joining is intrinsically mutagenic and does not require extensive homology (usually <10 base pairs [bp]) between the two sequences that are joined. Nonhomologous end joining does not require the presence of guiding sister chromatids and is therefore most active during the G1 phase of the cell cycle. Malfunction of these DNA repair systems is responsible for the chromosomal instability in some cancer and premature aging syndromes such as Bloom syndrome, an autosomal recessive disorder caused by inactivating mutations of the BLM gene. BLM encodes a nuclear protein related to the RecQ family of helicases, which are DNA-unwinding proteins involved in homologous recombination. Bloom syndrome patients show increased rates of chromosomal breakage and exhibit sister chromatid exchanges in the form of quadriradials, which are four-armed structures composed of two chromosomes intersecting at regions of chromatin homology. Bloom syndrome patients develop various benign and malignant tumors, generally occurring at an earlier age than in the normal population.
Other chromosomal instability syndromes result from defects in RecQ helicase proteins. For example, both Werner and Rothmund-Thompson syndromes are autosomal recessive disorders with germline mutations of RECQL2 (WRN2) and RECQL4 (WRN4), respectively. Affected individuals develop various tumors, with osteosarcomas being particularly characteristic of patients with the Rothmund-Thompson syndrome. Ataxia-telangiectasia is an autosomal recessive disorder conferring exquisite sensitivity to ionizing radiation. Ataxia-telangiectasia generally results from mutations in the ATM gene, which encodes a protein kinase that participates in surveillance for double-strand DNA breakage. Lymphocytes from ataxia-telangiectasia patients show increased levels of chromosomal rearrangement.
Nijmegen breakage syndrome shares several features with ataxia-telangiectasia but is caused by mutations of the NBN (NBS1) gene. The NBN (NBS1) protein participates in a complex with apparent roles in homologous recombination repair and nonhomologous end joining. Patients with ataxia-telangiectasia and Nijmegen breakage syndromes are particularly susceptible to the development of leukemias and lymphomas.
Fanconi anemia is a heterogeneous group of autosomal recessive disorders with predisposition to cancer, particularly leukemias and squamous cell carcinomas. At least eight distinct genes involved in DNA double-strand breakage repair have been implicated in the genesis of Fanconi anemia. The chromosomes of patients with Fanconi anemia exhibit increased sensitivity to DNA cross-linking agents, such as diepoxybutane, and this feature can be useful in diagnosis of the disease. Fanconi anemia DNA repair defects can also result from germline mutations of the BRCA2 gene.
The Li-Fraumeni syndrome is a familial cancer predisposition syndrome that manifests as early onset of a constellation of tumors (rhabdomyosarcoma, breast carcinoma, osteogenic sarcoma, astrocytic brain tumors, adrenal cortical carcinoma, acute myelogenous leukemia) caused by germline mutation in the TP53 tumor suppressor protein.
Certain DNA sequences may be targeted for chromosomal rearrangements. For example, certain sequences within the MLL transcription factor gene might comprise TOP2 DNA-binding sites that promote leukemia-associated rearrangements, and this has been studied in detail. Notably, MLL is typically rearranged in secondary leukemias after exposure to topoisomerase II poisons, including epipodophyllotoxins, and in leukemia in infants in whom maternal-fetal exposures to dietary or environmental topoisomerase II poisons have been implicated. Even though there is not a clear consensus TOP2 DNA-binding sequence in MLL and the preferred sites of enzyme recognition are modified by specific chemotherapeutic agents, it has been shown that MLL translocation breakpoints occur near functional sites of chemotherapy-enhanced TOP2 cleavage in in vitro assays. TOP2 is an essential cellular enzyme that relaxes supercoiled DNA by transiently cleaving and religating both strands of the double helix. TOP2 catalyzes the sequential reactions of double-strand DNA cleavage, DNA strand passage, and DNA strand rejoining (religation). The DNA cleavage reaction occurs when each subunit of the TOP2 enzyme homodimer covalently attaches to and introduces staggered nicks in the DNA, with the nicked DNA remaining tethered to the enzyme subunits, forming a fleeting TOP2/DNA intermediate called the cleavage complex. Particular anticancer drugs such as etoposide alter the cleavage-religation equilibrium by decreasing the rate of religation, which damages the DNA by increasing cleavage complexes. Chemotherapeutic agents that interact with TOP2 in this manner are termed topoisomerase II poisons because the enzyme is converted to a cellular toxin that promotes strand breakage. Although sometimes called TOP2 inhibitors when used clinically, these agents are distinct in their activity from catalytic inhibitors of this enzyme. The association of various chemotherapeutic TOP2 poisons used for anticancer treatment with secondary leukemias characterized by balanced chromosomal translocations has suggested that TOP2 has a role in other balanced translocations, such as t(8;21), t(15;17), and inv(16) in addition to those involving MLL.
Other examples of recombination-promoting sequences are the heptamer-nonamer sequences adjacent to translocation breakpoints in many B-cell lymphomas. These sequences serve as sites of V(D)J recombination and are, therefore, recombination signals in the B-cell context. Similarly, the sites of V(D)J recombination also promote translocations of TCR genes with heterologous gene loci in T-cell ALL and T-cell lymphomas.
Physical proximity of genes in interphase nuclei has also been implicated in their incorporation into fusion genes. For example, radiation-induced thyroid carcinomas frequently exhibit rearrangements of the protein tyrosine kinase gene RET on chromosome 10q11, which is most often fused with the H4 locus, telomeric (band 10q21) to RET on the same chromosome arm. RET and H4 are physically juxtaposed in 35% of normal human thyroid cells, providing a hypothesis as to why these two particular genes are disproportionately likely to be fused after radiation-induced double-strand DNA breakage. Indeed, the three-dimensional topography of the genome explains why certain rearrangements, particularly between neighboring regions on a given chromosome, are commonplace both in cancer and nonneoplastic cells. Accordingly, whole transcriptome evaluations in various cancers have revealed hundreds of apparent intrachromosomal rearrangements in a given tumor, many of which involve closely neighboring genome regions and most of which are unlikely to create functionally important oncogenes. The constraints of genome organization and nuclear proximity likely determine that certain genes are the favored partners in cancer-associated rearrangements, even in situations in which other members of the same gene family would appear to be equally suitable, biologically, in the oncogenic roles. As one example, MYC, rather than its biologically similar family member, MYCN, is rearranged with an IG locus in Burkitt lymphoma; however, MYCN if moved to the MYC genomic locus effectively undergoes oncogenic rearrangement with IGH.
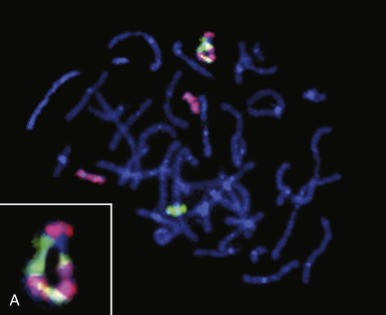
One intriguing aspect of cancer chromosomal translocations is that they are sometimes amplified, providing additional copies of the associated fusion oncogenes. After their formation, the translocation breakpoint regions can be amplified as tandem repeats within the original chromosome or can be amplified as extrachromosomal structures, such as double-minute chromosomes. One example of intrachromosomal amplification occurs with the typically low-level amplification of PDGFB fusion genes in the spindle cell sarcoma dermatofibrosarcoma protuberans ( Fig. 45-13, A ). An example of extrachromosomal amplification is found in a subset of alveolar rhabdomyosarcomas, in which double-minute chromosomes contain numerous copies of the PAX7-FOXO1 fusion oncogene (see Fig. 45-13, B ). In either of these situations, the amplification event suggests that multiple copies of the fusion oncogenes are required to accomplish cellular transformation.
The EWSR1 gene is rearranged in a striking number of pediatric sarcomas including Ewing sarcoma and desmoplastic small round cell tumor. There are, however, striking racial discrepancies with respect to Ewing sarcoma incidence, such that children of European ancestry are affected with a higher frequency than African-American, Asian, or Native American children. A recent study has shown, however, that the incidence of EWSR1-rearranged sarcoma is not uniformly higher in European descendants, because desmoplastic small round cell tumor (DSRCT), for example, occurs with higher frequency in African-American children.
Biologic Consequences of Chromosomal Translocation
Chromosomal Rearrangements Involving Transcription Factor Genes
Transcription factors are a heterogeneous group of DNA-binding proteins, most of which have domains involved in DNA binding, protein dimerization (for interaction with homologous proteins), and gene transactivation (for activation of gene transcription) or transcriptional repression. There are several classes of transcription factors, primarily relating to the structure of their DNA-binding domains. Some of the major categories include homeodomain proteins, zinc finger proteins, leucine zipper proteins, forkhead proteins, and helix-loop-helix proteins. Transcription factor genes are disrupted by many chromosomal translocations, resulting in their aberrant expression and function. Often, these transcription factor genes control lineage-specific developmental pathways and their abnormal activation can induce ectopic or asynchronous expression of corresponding lineage-specific antigenic markers, which then become a defining aspect of the transformed phenotype.
Many chromosomal translocations involving transcription factors have been described in leukemias and lymphomas. Chromosomal translocations in leukemias often interfere with the normal differentiation program of myeloid and lymphoid lineages, although the presence of a chromosomal translocation per se does not prevent subclone evolution via further lineage-associated differentiation (e.g., progression from IGH gene rearrangement only to IGH plus IGL- chain rearrangement in precursor B-cell ALL). In acute leukemias, the targets for various chromosomal translocations are genes encoding hematopoiesis-related transcription factors, including AML1 (also known as RUNX1) and CBFB (see Fig. 45-12 ).
AML1 is a DNA-binding protein with significant homology to the Drosophila melanogaster developmental protein Runt. AML1 binds to the DNA enhancer sequence TGTGGT; the DNA-binding capabilities of AML1 are enhanced through interactions with the non–DNA-binding protein subunit of CBF (core-binding factor) called CBFB, thereby regulating expression of several genes involved in hematopoiesis. One of the most common chromosomal translocations observed in AMLs (approximately 12% of cases) is the t(8;21)(q22;q22), which fuses AML1 on chromosome 21q to RUNX1T1 (ETO) on chromosome 8. ETO encodes a nuclear phosphoprotein expressed in the nervous system and in CD34+ hematopoietic progenitor cells. ETO is a transforming protein that normally participates in a multiprotein complex involved in chromatin remodeling and transcriptional repression. The fusion protein AML1-ETO retains the Runt domain of AML1 and almost the entire sequence of ETO. It appears that the ETO domains incorporated into the fusion oncoprotein can dominantly repress transcription of certain genes, the expression of which is normally activated by AML1. As an example, the tumor suppressor protein p14 ARF normally is transcriptionally activated by AML1, but p14 ARF is transcriptionally repressed by AML1-ETO. AML1 is also involved in several other chromosomal translocations in leukemias and myeloproliferative disorders, including AML1-MDS1 in myelodysplastic (preleukemic) syndromes, AML1-EVI1 in chronic myelogenous leukemia in blast crisis, and TEL (ETV6)-AML1 in pre-B ALL. All these fusion genes retain the AML1 Runt domain.
Another example of a fusion gene affecting the normal function of the AML1-CBFB DNA-binding transcription factor protein complex is CBFB-SMMHC, which results from rearrangement of chromosome 16 in the French-American-British (FAB) M4Eo subtype of AML. CBFB-SMMHC can result from translocation or pericentric inversion of chromosome 16, thereby fusing sequences from the 5′ end of CBFB to the 3′ end of SMMHC. The resultant fusion oncoprotein contains the AML1-binding heterodimerization domain of CBFB juxtaposed to the coiled-coil domains of the MYH11 (SMMHC) protein. The fusion protein CBFB-SMMHC binds to the AML1 Runt domain more effectively than the normal CBFB and has a dominant negative effect on the AML1-CBFB complex.
MLL is a transcription factor protein in which the amino and carboxyl aspects contribute transcriptional repression and activation activities, respectively. MLL undergoes posttranslational processing so that the transcriptional repression and activation regions are separated by cleavage, but they then reassociate with one another in a large multiprotein chromatin remodeling complex. MLL maintains but does not initiate expression of its target genes via histone methyltransferase activity, which is provided by a SET domain within the MLL carboxyl terminus. A wide range of MLL fusion oncoproteins resulting from translocations of the MLL gene at chromosome band 11q23 contain the amino terminus of the MLL transcription factor and the carboxyl terminus of partner proteins that are themselves involved in transcriptional regulation. However, there is substantial diversity in MLL partner protein function and not all MLL partner proteins are transcription factors.
Chimeric (fusion) transcription factor oncogenes are also featured in many soft tissue tumors. A much-studied example is the EWS-FLI1 fusion oncogene resulting from the t(11;22)(q24;q12) translocation in Ewing sarcoma. This translocation fuses EWS 5′ sequences to FLI1 3′ sequences. EWS encodes a ubiquitously expressed protein involved in DNA transcription, and FLI1 is a member of a large family of DNA transcription factors that contain the highly conserved ETS domain. The EWS-FLI1 fusion oncogene structure varies, depending on which EWS and FLI1 exons are retained in the chimeric gene (see Fig. 45-10 ). EWS can be fused with other ETS family members to provide the oncogenic impulse in Ewing sarcoma, and, alternatively, FUS (an EWS family member) can instead be fused with ETS family members in Ewing sarcomas. EWSR1-ETS fusion proteins are necessary but insufficient for cellular transformation, a process for which IGF1R is vital. Some progress has been made in recent years in understanding the oncogenic mode of action of the EWSR1-ETS fusion protein, with a rather complex and multifaceted picture emerging whereby gene targets may be direct or indirect and include transcriptional regulators such as EZH2, NROB1, and NKX2.2, as well as genes involved in signal transduction or genes involved in cell cycle control. EWS-FLI1 can directly bind promoters of target genes and modulate gene expression by upregulating (e.g., IGF1, CCND1, hTERT ) or repressing targets (e.g., cyclin-dependent kinase inhibitors and IGFBP3, the latter potentially allowing increased IGF1 signaling). Reduced target expression may result from decreased transcription through EWS-FLI1 reducing Pol II at the target gene promoter or through posttranscriptional reduction of transcript half-life. Any additional posttranscriptional role, for example, of microRNAs putatively targeted by the fusion oncogene remains to be elucidated fully, and there is emerging evidence that posttranslational protein modification is a further important function of EWS-ETS fusions. The direct binding of EWSR1-ETS to the EZH2 promoter specifically with upregulation of EZH2 is interesting in relation to the ongoing debate regarding the cell of origin of Ewing sarcoma. EZH2 is a subunit of the Polycomb repressor complex, PRC2, and its expression holds cells through reversible epigenetic means, in an undifferentiated state of “stemness.”
Similarly, EWS or FUS is fused with other genes (not belonging to the ETS family) in various Ewinglike and frankly non-Ewing mesenchymal small round blue cell neoplasms, always resulting in fusion oncoproteins with EWS or FUS at the amino-terminal end of the fusion protein. DSRCT, a clearly defined tumor that is considered absolutely distinct from Ewing sarcoma, is an exceptionally malignant cancer composed of nests of small round tumor cells sharply delineated by a reactive fibroblastic proliferation. It is cytogenetically characterized by t(11;22)(p13;q12), which fuses EWS to the WT1 gene. The EWS-WT1 fusion oncoprotein retains the EWS transactivation domain and the WT1 DNA-binding domain. WT1, located on chromosome 11p13 encodes a zinc finger transcription factor with crucial roles in genitourinary tract development. Germline WT1 mutations cause Wilms tumor syndromes, including Denys-Drash and WAGR ( W ilms- A niridia- G enitourinary abnormalities and mental R etardation) syndromes. Further examples of fusion genes involving EWSR1 or FUS and non-ETS genes include isolated cases or small cohorts of small round blue cell tumors, which to a variable degree share histologic features with Ewing sarcoma. The partner genes may again be transcription factors, as seen with POU5F1 or NFATc2, or in the case of SMARCA5, a chromatin remodeler, whereas single reports each of a small round blue cell tumor with EWS-SP3 and of EWS-ZSG represent fusions of EWS with zinc finger proteins. The latter case particularly has more similarity with DSRCT, insofar as it failed to react with CD99, a classic marker of Ewing sarcoma, but did express desmin. Indeed with respect to both these cases, fusion with a zinc finger gene resonates with the situation in DSRCT. The rarity of such cases precludes major comment on their likely biologic relationship with Ewing sarcoma versus DSRCT.
A recently described undifferentiated small round cell tumor is characterized by recurrent chromosomal translocations t(4;19)(q35;q13.1) or t(10;19)(q35;q26) fusing the high mobility group box [HMG] transcription factor CIC with one or other of the DUX4 double homeobox transcription factor genes located within macrosatellite repeats on 4q and 10q ; thus these tumors are known as CIC-DUX4 tumors. An isolated report documenting t(18;19)(q23;q13.2) in a soft tissue tumor resembling Ewing sarcoma most likely represents a variant also involving CIC.
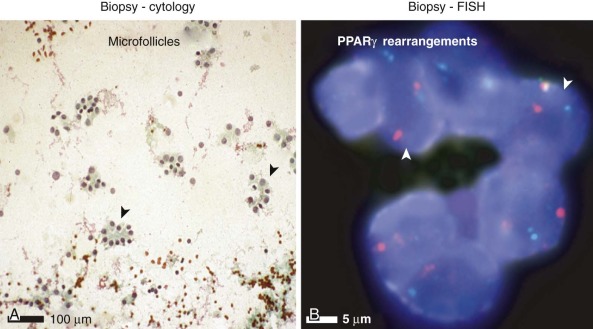
Tumors of epithelial differentiation (carcinomas) often have complex karyotypes, which can obfuscate recurrent translocations. However, translocations involving transcriptional regulatory genes have been identified in several pediatric carcinomas, including follicular thyroid carcinomas, renal cell carcinomas, and NUT midline carcinoma. Follicular thyroid carcinomas can feature PAX8-PPARγ fusion transcription factor genes resulting from t(2;3)(q13;p15) ( Fig. 45-14 ), whereas in the highly lethal NUT midline carcinomas, the translocation t(15;19)(q13;p13) ( Fig. 45-15 ) results in oncogenic fusion of the bromodomain transcriptional regulator BRD4 with a novel testis-restricted gene, NUT. Although exhibiting epithelial immunophenotypic features, NUT midline carcinomas typically have a primitive round cell morphology (see Fig. 45-15 ).

Chromosomal Rearrangements Involving Protein Tyrosine Kinase Genes
Chromosomal translocations in various neoplasms produce protein tyrosine kinase fusion genes, and such oncogenes are of considerable clinical importance. Protein tyrosine kinases comprise a large family of proteins, which are primarily involved in signal transduction. All tyrosine kinase proteins contain a highly conserved kinase (catalytic) domain, which mediates the phosphorylation of tyrosine residues in protein substrates. Phosphorylated tyrosines serve to stabilize various protein-protein interactions and to enhance kinase activity in those substrates with intrinsic kinase function. Tyrosine kinase fusion oncoproteins resulting from chromosomal translocations in cancer have a consistent structure. The carboxyl-terminal end of these fusion oncoproteins typically contains the entire kinase domain from the tyrosine kinase protein, whereas the amino-terminal end contains an oligomerization domain from the other fusion partner. The oligomerization domain facilitates spontaneous interactions between kinase fusion oncoproteins, and the complexed oncoproteins can then phosphorylate each other, resulting in further upregulation of kinase activity.
The Philadelphia (Ph) chromosome is the cytogenetic hallmark of chronic myelogenous leukemia (CML) and was the first diagnostic translocation identified in a human cancer, also providing the best known example of a fusion tyrosine kinase oncogene. The Ph chromosome results from chromosomal translocation between chromosomes 9 and 22, in which the BCR gene on chromosome 22 is fused with the ABL1 (ABL) kinase gene on chromosome 9. This translocation is found in most CMLs, 25% of ALLs in adults, 5% of ALLs in children and, less often, in AML. ABL encodes a 145-kD nonreceptor protein tyrosine kinase that shuttles between the nucleus and cytoplasm and is involved in various cellular processes, such as cell cycle regulation and apoptosis. BCR encodes a 160-kD protein with dimerization, serine-threonine kinase, Rho-GEF (guanine nucleotide exchange factor), and Rac-guanosine triphosphatase (GTPase) domains. The BCR-ABL fusion oncoprotein is expressed as three structural variants, depending on the location of the breakpoint in the BCR gene. The BCR-ABL fusion transcript types segregate with specific neoplasms so that the 190-, 210-, and 230-kD BCR-ABL proteins are typically expressed in ALL, CML, and chronic neutrophilic leukemia, respectively. In AML, BCR-ABL fusion oncoproteins can be the P210 or P190 form. The BCR-ABL fusion oncoproteins feature constitutive activation of the ABL kinase domain, resulting in autophosphorylation and tyrosine phosphorylation of various substrates. The phosphotyrosine residues serve as binding sites for various signaling proteins, resulting in activation of signaling pathways, such as Ras/MAPK (implicated in cell proliferation) and PI3K/AKT (implicated in cell survival).
Translocation-associated fusion kinase oncogenes are also found in various soft tissue tumors, including congenital fibrosarcoma, a pediatric spindle cell neoplasm with an excellent prognosis. Cytogenetically, congenital fibrosarcoma is characterized by the balanced translocation t(12;15)(p13;q25), which fuses the 5′ end of the transcription factor gene TEL to the 3′ end of the NTRK3 protein tyrosine kinase gene (see Fig. 45-2 ). The TEL-NTRK3 fusion oncoprotein retains the TEL helix-loop-helix dimerization domain and the NTRK3 kinase domain. TEL is also rearranged with other genes, including protein tyrosine kinase genes in various leukemias. The TEL-NTRK3 fusion gene is seen in pediatric renal tumors known as congenital cellular mesoblastic nephromas, which are histologically similar to congenital fibrosarcoma ( Fig. 45-16 ). This finding suggests that congenital fibrosarcoma and cellular mesoblastic nephroma belong to the same spectrum of tumors. TEL-NTRK3 is also found occasionally in AML and is one of a few fusion oncogenes known to play transforming roles not only in soft tissue and hematopoietic neoplasms but also in epithelial neoplasia (secretory breast carcinoma).
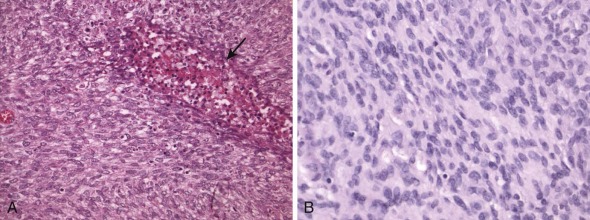
Inflammatory myofibroblastic tumor (IMT) is an unusual entity that arises predominantly in the abdominal cavity/peritoneum of young patients. Similar to congenital fibrosarcoma, IMT is usually associated with an excellent prognosis and metastases are rare. However, a subset of patients with IMT do develop disseminated disease and it is notable that many IMTs have chromosomal translocations that create activated fusion forms of the ALK receptor tyrosine kinase gene detectable by immunohistochemical means ( Fig. 45-17 ). ALK oncogenic fusion genes were initially described as a consequence of the chromosomal translocation t(2;5)(p23;q35), which occurs in a subset of anaplastic large cell lymphomas (ALCLs). At least nine ALK fusion genes have now been described in IMT and ALCL; in all of them, the resultant fusion oncoproteins contain the ALK kinase domain fused to an oligomerization domain of another protein. Two of the ALK fusion genes, TPM3-ALK and CLTC-ALK, have been found in IMT and ALCL, indicating that an identical oncogenic mechanism can contribute to these different tumors. Most recently, ALK kinase domain mutations and gene amplification have been demonstrated in hereditary and sporadic neuroblastoma. Other receptor tyrosine kinase translocations in pediatric cancer include those in papillary thyroid cancers, which can target the RET or NTRK1 genes. In these fusion oncoproteins, the RET or NTRK1 kinase domains are activated by fusion with various oligomerization-inducing domains.
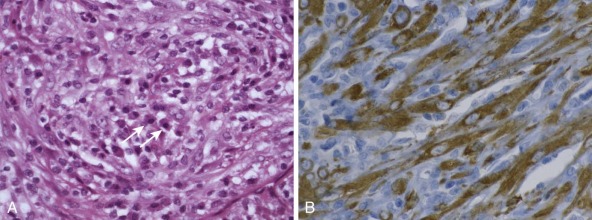
A further mechanism of protein tyrosine kinase activation by chromosomal translocation is seen in dermatofibrosarcoma protuberans (DFSP). DFSP is a subcutaneous plump spindle cell sarcoma that exhibits high local recurrence rates but rarely metastasizes. Cytogenetically, this tumor is characterized by the chromosomal translocation t(17;22)(q21;q13), often amplified within a circular or ring chromosome (see Fig. 45-13A ). The t(17;22) creates a COL1A1-PDGFB fusion gene, in which the entire PDGFB coding sequence is placed under the transcriptional control of the highly active COL1A1 promoter in an event referred to as promoter swapping. This mechanism results in PDGFB overexpression, with resultant autocrine activation of the PDGFB receptor. The same genetic event underlies the development of giant cell fibroblastoma, which is a pediatric tumor believed to be closely related to DFSP.
Chromosomal Rearrangements Associated with Transcriptional Upregulation of Nonfusion Oncogenes
Many pediatric lymphomas feature juxtaposition of intact protooncogenes to transcriptionally active loci (e.g., the IG locus in B-cell lymphomas or the TCR locus in T-cell lymphomas). V(D)J recombination and class switch recombination, which normally occur within the IG or TCR loci in lymphocytes, have been implicated in the genesis of these nonfusion genes. V(D)J recombination and class switch recombination mechanisms are exemplified by the nonfusion genes targeting MYC, a regulator of cell growth and survival, in many Burkitt lymphomas. V(D)J recombination facilitates the chromosomal translocation t(8;14)(q24;q32) in endemic Burkitt lymphomas found in patients from equatorial Africa. This translocation juxtaposes MYC to the intronic IG heavy chain gene enhancer, leading to MYC overexpression. In contrast, most nonendemic Burkitt lymphomas have translocation breakpoints downstream elsewhere in the IG heavy chain gene locus, juxtaposing MYC to other enhancers. Alternatively, MYC overexpression can result from juxtaposition to the IG κ or λ light chain genes resulting from t(2;8) or t(8;22).
Like Burkitt lymphomas, follicular cell lymphomas of B-cell origin also feature rearrangements of IG loci, but with BCL2 or BCL6, rather than MYC, typically overexpressed by translocation into the region of an IG gene promoter. BCL2 alterations, conferring well-described antiapoptotic effects, often result from IG heavy chain V(D)J recombination, with a breakpoint in exon 3 of BCL2 becoming fused to the 5′ end of J H or D-J H heavy chain segments. These mechanisms result in BCL2 transcriptional upregulation, mediated by the IG heavy chain gene enhancer. Although deregulated BCL2 expression provides a survival advantage in such lymphomas, additional gene mutations are needed for full neoplastic transformation. However, in the pediatric population, follicular lymphomas are uncommon and the vast majority of cases feature elevated BCL6 expression. Cases with t(14;18) fusing the IGH chain locus with the BCL2 gene comprise only a small subset of the cases, which is in contrast to adults, but increased BCL2 expression is associated with advanced disease and a poor prognosis in pediatric lymphoma.
TCR locus rearrangements are demonstrable in many T-cell leukemias and lymphomas, resulting in transcriptional upregulation of various translocated genes, similar to the mechanisms involving IG gene regions in various B-cell malignancies. The T-cell leukemia and lymphoma cytogenetic rearrangements dysregulate expression of transcription factor genes, such as MYC, HOX11, TLX3 (HOX11L2), TAL-SCL, LYL1, LMO1, and LMO2, by placing these genes under the control of highly active cis -acting transcriptional regulatory TCR elements, although dysregulation of these T-cell oncogenes can also occur in the absence of cytogenetic TCR rearrangements.
Translocations resulting in nonfusion oncogenes can be found in pediatric solid tumors; one example is the PDGFB fusion gene in DFSP (see earlier). Other examples include translocations of chromosome 8, targeting the PLAG1 gene, a zinc finger transcription factor, in salivary gland pleomorphic adenoma and the primitive adipose tumor lipoblastoma. In both tumor types, the chromosomal breakpoints occur in the 5′ noncoding regions of the involved genes, resulting in promoter swapping, in which the transcriptionally inactive PLAG1 promoter is replaced by the highly active promoter of the translocation partner gene, leading to PLAG1 overexpression.
Biologic Basis for Specificity of Balanced Chromosomal Rearrangements: Diagnostic Relevance
Recurrent chromosomal rearrangements involving specific breakpoint regions are increasingly being used as diagnostic markers in various pediatric cancers. Translocations are the most extensively studied of these rearrangements, but other mechanisms include chromosomal insertions, inversions, and interstitial deletions. Although diagnostic rearrangements, such as those involving chromosome 22 in Ewing sarcoma, have become useful biomarkers, it is unclear whether most such characteristic rearrangements are initiating tumorigenic events or later events responsible for tumor progression. However, their oncogenic nature is generally convincing in that they can transform cells, as can be demonstrated by expressing the oncogenes in nonneoplastic cells in vitro or in mice. Although EWS and its family member TLS-FUS are frequently rearranged in chromosomal translocation in sarcomas, the partner gene varies and appears occasionally to dictate the tumor phenotype (see Table 45-1 ). For example, EWS-WT1 transcripts are found in DSRCT but not Ewing sarcoma, whereas EWS-ATF1 fusion occurs in soft tissue clear cell sarcoma but not other sarcomas. It has not yet been clearly established whether it is the partner gene that determines lineage in these tumors or whether only certain cells, already lineage committed, might tolerate the presence of these oncogenic transcripts.
Translocations of the MLL gene at chromosome band 11q23 are examples of leukemia-associated chromosomal translocations that create potent fusion oncoproteins. MLL translocations are believed to be the events that initiate these leukemias. Analogous to EWS variant rearrangements in pediatric solid tumors, particular MLL partner genes are more likely to occur in ALL than in AML, even though there is some overlap, and leukemias with MLL translocations can also exhibit dual lineage or actually switch lineage.
There is substantial evidence that single genetic aberrations are insufficient to produce cancer. Rather, tumor development requires many gene mutations, perturbing different aspects of the cell biology (including apoptosis, proliferation, differentiation, and adhesion), which collectively results in the neoplastic phenotype. Even with MLL translocations in which there is a short latency from the in utero occurrence of the translocation to manifestation of disease, which is often in the young infant (<3 months old) or even in the neonate or the fetus, there are characteristic secondary alterations in addition to the translocations.
Some of the same characteristic genetic alterations, including chromosomal translocations, observed in human cancers have been detected at very low levels (e.g., 1 in 10,000 cells) in nonneoplastic cell populations. The rare cells containing these alterations are individually at low risk for progression to malignancy, presumably because it is unlikely that they will acquire the other mutations required to result in clinically evident cancer. However, this likely is more pertinent to solid tumors, in which a greater number of events generally is believed to be required for full oncogenesis than in leukemias. Similarly, it is likely that various diagnostic genetic alterations can be detected at very low levels in cancer types in which they are not characteristically encountered and where they likely are not serving an important transforming role for the vast majority of cells in that cancer. Therefore when using genetic alterations as diagnostic markers, it is important to have some sense that the alteration is found in most cells in the cancer, rather than being a rare and perhaps trivial event. It is similarly crucial to correlate the genetic findings with the histology, thereby confirming that the molecular diagnosis is credible.
The recurring and relatively specific association of chromosomal translocations with one or a few types of cancer has enabled the development of assays in which the translocations serve as ancillary diagnostic markers. There is a biologic basis to such tumor specificity because the neoplastic phenotype is essentially a symbiotic interaction between cell environment and translocation product, and certain genetic alterations, particularly those resulting from translocations, appear oncogenic in only a limited number of cancer cell environments. Support for this concept is provided by B-cell lymphomas, in which diagnostic translocations often juxtapose oncogenes to the IG loci. The IG gene promoters are extremely active in the B-cell context, and ectopic placement of oncogenes near these promoters results in striking overexpression of the oncogenes, provided that the chromosomal rearrangement occurs in the B-cell context. By contrast, this same chromosomal rearrangement would presumably be irrelevant in other cell types, in which the IG genes are transcriptionally silent. Translocations that occur in B-cell lymphoma have not been found in other varieties of human cancer. Another factor accounting for tumor specificity is the restriction of transforming properties of translocation-associated oncoproteins to certain cell lineages. Fusion oncoproteins always require interactions with other cellular proteins that facilitate and support the effect of that oncoprotein. Therefore cell lineages lacking the relevant interacting proteins will not be transformed by a given fusion oncoprotein. These concepts are underscored by the observation that the BCR-ABL fusion oncoprotein, which is highly transforming in hematopoietic progenitor cells, fails to transform fibroblast cell lines.
In pediatric tumors, genetic aberrations useful for testing as ancillary diagnostic findings are especially frequent in sarcomas, leukemias, and lymphomas. Interestingly, in contrast to adult tumors, diagnostic alterations are also found in many pediatric carcinomas, including papillary and follicular thyroid carcinomas, renal cell carcinomas, and lethal midline carcinoma. Although cytogenetic and molecular profiles are diagnostic in some pediatric cancers, there are many others that lack specific genetic or cytogenetic aberrations or have extremely complex karyotypes in which the specific aberrations, if present at all, are difficult to identify.
Cytogenetic and Molecular Pathology: Major Tumor Types
Cytogenetic and molecular analyses have provided extraordinary insights into the biology and pathogenesis of pediatric cancer and, in some cases, these insights have then formed the basis for more accurate assessment of diagnosis and prognosis. However, neither cytogenetic nor molecular methods are required routinely in the clinical setting. In some pediatric solid tumors, there is not yet a basis for genetic testing because recurrent genetic aberrations are unknown. In others, particularly those that are benign clinically, the histopathology diagnosis and prognosis are generally straightforward and genetic adjuncts are therefore irrelevant. Some pediatric solid tumors, such as high-grade osteosarcoma, have extremely complex karyotypes, so that to date, there is little clinical advantage in genetic analysis, given the formidable task of describing the many genetic aberrations in a given tumor and the questionable prognostic relevance of the individual genetic perturbations. Widespread application of genetic assays in such tumors awaits the identification of key genetic predictors, which might then be determined in tumor interphase cells by molecular cytogenetic assays.
The following sections will highlight applications of cytogenetic and molecular assays in subsets of pediatric tumors, in which the technical challenges of genetic assays are manageable, and in which genetic findings are acknowledged to provide important diagnostic or prognostic information.
Mesenchymal Neoplasms: Soft Tissue and Bone Tumors
Ewing Sarcoma
Ewing sarcomas are highly aggressive tumors, characteristically occurring in bone and soft tissue, but also, less commonly, in viscera, and in which the neoplastic cells are generally of the small, round, blue cell type. Ewing sarcoma and peripheral primitive neuroectodermal tumor (pPNET), although historically considered distinct entities, share molecular and morphologic features and are now regarded as essentially the same entity (herein referred to simply as Ewing sarcoma). Ewing sarcomas typically contain chromosomal translocations involving the Ewing sarcoma gene ( EWS or EWSR1 ), which is located on the long arm of chromosome 22. These translocations involve a number of partner genes (see Table 45-1 ), with the most common translocation being t(11;22)(q24;q12), resulting in oncogenic fusion of 3′ sequences of the FLI1 gene on chromosome 11 with 5′ sequences of EWS. FLI1 belongs to the winged helix-loop-helix transcription factor family that share a conserved 85-amino acid ETS domain that is present in all EWS-ETS fusions. The oncogenic EWSR1-FLI1 fusion gene encodes an activated version of transcription factor in which the DNA binding domain of FLI1 is fused to the more potent trans -activating domain (TAD) of EWSR1, replacing the TAD of FLI1. In variant translocations, EWS is fused with alternative ETS transcription factor family members (see Fig. 45-10 and Table 45-1 ) and, rarely, the EWS -related gene, FUS, can also be fused with an alternative ETS family member in Ewing sarcomas ( Fig. 45-18 ; see Table 45-1 ). The EWS family and ETS family gene translocations are apparently essential for oncogenesis, being found in almost all Ewing sarcomas.
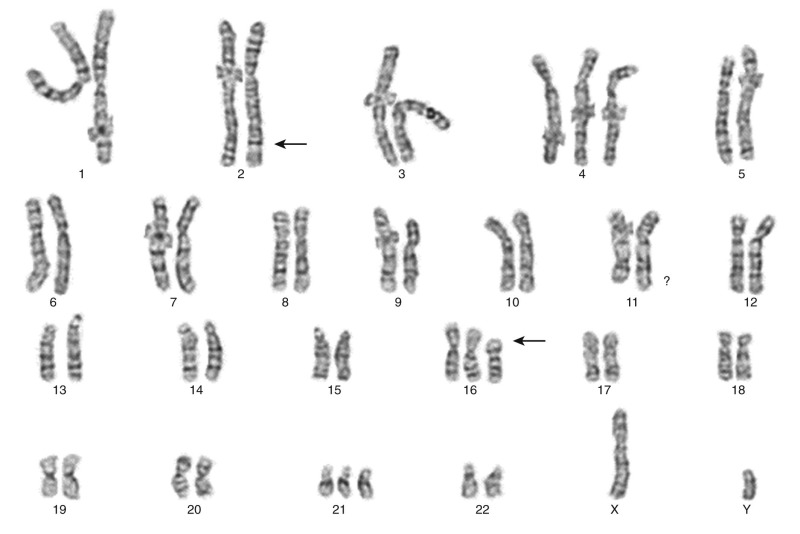
These translocations are readily detected by conventional cytogenetic methods, even using needle biopsy material, because Ewing sarcoma cells grow well in tissue culture. The translocations can also be detected by FISH, typically using dual-color probes flanking the EWSR1 locus (see Fig. 45-8 ). Although this does not identify the partner gene fused to EWSR1, that information is generally unnecessary for diagnostic purposes. Another method for detecting these translocations is RT-PCR. Advantages of PCR include superior sensitivity, identification of the EWS fusion partner gene, and identification of the breakpoint locations within the genes. The most common fusion is between EWS exon 7 and FLI1 exon 6, known as type I fusion, whereas type II fusion involves fusion of EWSR1 exon 7 with FLI1 exon 5, and many further variants have been described (see Fig. 45-10 ). Although several studies have indicated that EWSR1-FLI1 breakpoint locations might be prognostic in Ewing sarcoma, with tumors bearing the type I transcript doing better than all others, more recent studies do not confirm this, and such information is not used routinely to guide therapeutic decisions.
Although histomorphologic and immunohistochemical features are often sufficient to establish the diagnosis of Ewing sarcoma, genetic corroboration of the diagnosis is highly reassuring in distinguishing Ewing sarcoma from other small round blue cell tumors, particularly in situations in which tumor arises at an unusual site, or outside the typical age range, in the context of smaller biopsies, or if tumor cell preservation is compromised and/or immunohistochemistry is suboptimal. Although the cells are essentially undifferentiated, and superficially similar or identical to those in many other small round cell tumors, there are nonetheless characteristic findings, such as subtle cytologic features and crisp cytoplasmic membrane–associated expression of the CD99 (O13-HBA71, pseudoautosomal gene-encoded membrane glycoprotein [ Fig. 45-19 ], or specifically for Erg -rearranged Ewing sarcoma, anti-Erg monoclonal antibody ) that aid the diagnosis.
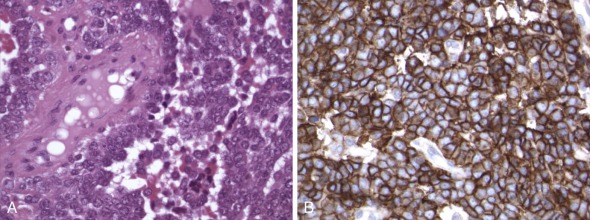
Thus the combined traditional histologic evaluation of H&E-stained sections, together with immunohistochemical profiling, enables distinction of Ewing sarcoma from, for example, a reasonable mimic in alveolar rhabdomyosarcoma by the demonstration of CD99 expression in Ewing sarcoma versus expression of myogenic markers such as myogenin, MyoD1, and desmin in rhabdomyosarcoma ( Fig. 45-20 ). The characteristic oncogene fusions in Ewing sarcoma (EWS-FLI1) and alveolar rhabdomyosarcoma (PAX-FOXO1) might contribute to the distinct cell differentiation profiles that separate these two round cell tumors immunophenotypically and morphologically. Evidence to this effect has been obtained from in vitro studies in which EWS-ETS oncogenes can induce neuroectodermal differentiation, whereas PAX-FOXO1 induces a myogenic program. Secondary genetic aberrations in Ewing sarcoma include TP53 mutation and CDKN2A deletion, which are each found in approximately 25% of cases and are more frequent in cases that are clinically aggressive and poorly chemoresponsive.
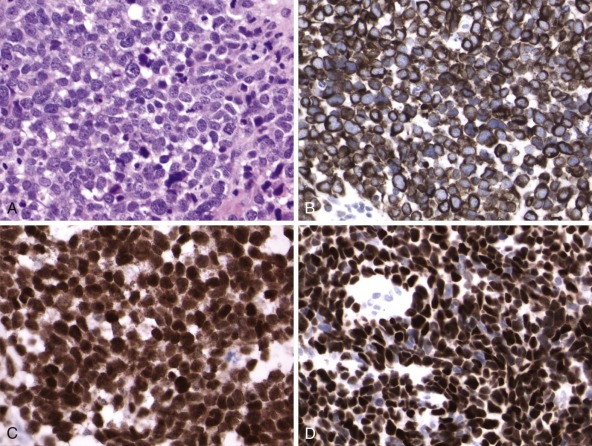
Similarly, gain of 1q was strongly associated with relapse and poor outcome, and this is apparently due to overexpression of DTL (CDT2), a ubiquitin ligase gene located on chromosome 1q. Independent loss of 16q was also predictive of worse overall and event-free survival regardless of stage at presentation. In that study, gain of chromosome 12 was, at least in cases of localized disease at presentation, associated with worse event-free survival whereas deletion of 6p has been associated with worse outcome also. Genomic instability portends poorly insofar as tumors with more than three copy number alterations reportedly did worse than those with three of fewer. However, currently these secondary genomic findings are not used in therapeutic decisions.
Rhabdomyosarcoma
Rhabdomyosarcomas are malignant tumors featuring skeletal muscle differentiation, with several histologic subtypes (see Fig. 45-20 ). The major varieties in childhood are the embryonal and alveolar subtypes and, although there are classic morphologies of alveolar and embryonal rhabdomyosarcoma, the distinction is not always clear-cut, because a solid variant alveolar rhabdomyosarcoma exists and composite cases also occur. Therefore especially with decreasing biopsy size, traditional morphologic distinction between embryonal and alveolar subtypes of rhabdomyosarcoma is not always a reliable means of subclassifying the tumors but is nonetheless essential for appropriate therapeutic stratification of patients with these two biologically different tumors. Alveolar rhabdomyosarcoma exhibits a higher proportional nuclear reactivity for both myogenin and MyoD1 than embryonal rhabdomyosarcoma, but even this feature may be unconvincing in small biopsies and thus be of little value in firmly establishing the diagnosis. The biologically distinct nature of embryonal and alveolar subtypes is confirmed by genetic studies, which show translocations targeting the chromosome 13 FOXO1A (forkhead transcription factor) gene in most alveolar rhabdomyosarcomas, and nontranslocation cytogenetic alterations, including 11p deletion, trisomy 8, and trisomy 20, in embryonal rhabdomyosarcomas. In 70% to 80% of alveolar rhabdomyosarcomas there is fusion of the FOXO1 gene with the PAX3 gene on chromosome 2, and approximately 10% have fusions of FOXO1 with the PAX7 gene on chromosome 1. The PAX7-FOXO1 fusion is often highly amplified in the form of double-minute chromosomes (see Fig. 45-13B ), whereas the PAX3-FOXO1 fusions are not usually amplified. This difference appears to reflect the lower intrinsic expression of PAX7-FOXO1, relative to that of PAX3-FOXO1, with genomic amplification therefore required to provide a comparable and sufficient level of oncogenic transcript. The FOXO1, PAX3, and PAX7 genes encode transcription factors, and the PAX3-FOXO1 and PAX7-FOXO1 fusion oncogenes encode activated forms of those transcription factors that function to induce myogenic differentiation programs. Notably, alveolar rhabdomyosarcomas with PAX7-FOXO1 rearrangements were reported in one study to have better prognoses than those with PAX3-FOXO1 when comparing patients presenting with metastatic disease. Furthermore, an argument has been made for movement toward designation of rhabdomyosarcomas based on translocation status rather than on morphology; and in that vein, cases of morphologic alveolar rhabdomyosarcoma have been termed fusion-positive versus fusion-negative. The observation that gene expression profiles of fusion-negative alveolar rhabdomyosarcomas are indistinguishable from those of embryonal rhabdomyosarcomas might lend considerable support to such subclassification. Whether molecular categorization however translates well to clinical prognosis and treatment stratification remains unresolved, and a combined morphomolecular diagnosis is currently considered best practice.
A proportion of cases of rhabdomyosarcoma lacking the canonical PAX-FOXO1 fusions show t(2;2)(p23;q35) or t(2;8)(q35;q13) in which PAX3 is fused with either NCOA1 or NCOA2, which are nuclear receptor transcriptional coactivators, whereas isolated individual cases of rhabdomyosarcoma were reported to show t(2;6)(p23;p21.1), t(4;22)(q35;q12) fusing EWSR1 with DUX4, and a complex t(8;13;9)(p11.2;q14;q32) apparently resulting in amplification of FGFR1-FOXO1 fusion.
Synovial Sarcoma
Synovial sarcomas may be monophasic ( Fig. 45-21 ), in which the tumor is predominantly composed of spindle cells, or biphasic, in which the tumor contains both spindle cell and epithelioid elements, with the latter exhibiting more convincing epithelial immunophenotypic characteristics or, uncommonly, poorly differentiated, with a primitive round cell morphology reminiscent of Ewing sarcoma. Apart from the epithelial markers epithelial membrane antigen (EMA) and cytokeratins, transducer-like enhancer protein 1 (TLE1) also has been validated from gene expression profiles as a reliable marker for synovial sarcoma. Synovial sarcomas feature translocation of chromosomes X and 18, t(X;18)(p11;q11). t(X;18) is found in more than 90% of synovial sarcomas but not generally in histologic mimics such as hemangiopericytoma, mesothelioma, leiomyosarcoma, or malignant peripheral nerve sheath tumor. The molecular underpinnings of t(X;18) are complex in that the oncogene on chromosome 18 ( SYT or SS18 ) can be fused with one of several almost identical genes (generally SSX1 or SSX2 and, rarely, SSX4 ) on chromosome X. SSX1 and SSX2 are adjacent genes and, given their close proximity, it is impossible to distinguish SS18-SSX1 and SS18-SSX2 translocations using conventional chromosomal banding methods. However, the alternative SSX fusions can be demonstrated by FISH or RT-PCR using specific probes or primers, respectively. One study has suggested that synovial sarcomas with the SS18-SSX1 fusion are typically biphasic, whereas those with SS18-SSX2 can be biphasic or monophasic and have better metastasis-free survival compared with those bearing SS18-SSX1 fusions. This morphologic-genotypic correlate is substantiated by studies of SS18-SSX1 and SS18-SSX2 interactions with SNAIL and SLUG, both transcriptional repressors of E-cadherin, which mediates mesenchymal to epithelial transition.
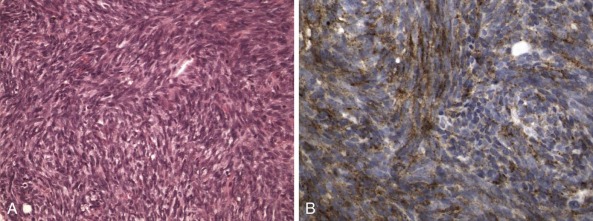
The SS18-SYT fusion protein is both necessary and sufficient for cellular transformation. SS18 and SSX contribute, respectively, transcriptional coactivator and repressor domains to the SS18-SSX fusion proteins, and, despite the lack of any DNA binding domain, exert an effect on gene transcriptional dysregulation apparently through association with chromatin remodeling proteins Trithorax (TRX) and the Polycomb repressor complex (PRC2). Mass spectrometry has revealed that SS18-SSX fusion proteins bind TLE1 and ATF2 to form a complex necessary for tumor cell survival. ATF2 is the DNA binding partner of SS18-SSX, and the epigenetic repression of ATF2 is dependent on TLE1, the recruitment of which can be abrogated by HDAC inhibitors, which have already shown considerable promise in preclinical trials. In addition, SS18-SSX competes physically with wild-type SS18, forming an altered complex lacking SMARCB1. This altered complex transactivates SOX2 , which is a diagnostic marker that is universally overexpressed in synovial sarcoma and essential for synovial sarcoma proliferation.
Adipose Tumors
Most subtypes of adipose tumors, whether benign or malignant, contain distinctive genetic aberrations (see Table 45-1 ). Useful diagnostic markers include 8q rearrangement in lipoblastoma, 12q rearrangement in lipoma, ring chromosomes in well-differentiated and dedifferentiated liposarcoma, and t(12;16) in myxoid or round cell liposarcoma.
Lipoblastomas are pediatric adipose tumors containing variable numbers of primitive cells (lipoblasts) and generally bearing translocations of the chromosome 8 long arm at bands 8q11-12, resulting in rearrangement of the PLAG1 zinc finger oncogene. Reports of individual cases each of lipoblastoma and lipoma bearing translocations involving 8q21.1 region in each case as well as with a t(9;12)(p22;q14) in a pediatric intramuscular lipoma add to the variability in observations in these benign fatty neoplasms. Hibernomas, which contain adipose cells with a brown fat phenotype, generally have rearrangements of the chromosome 11 long arm, although the gene target of that translocation has not been identified.
Another diagnostically useful aberration is the translocation of chromosomes 12 and 16 found in myxoid liposarcomas. This translocation is also found in round cell liposarcomas and is retained in myxoid liposarcomas that acquire round cell features and thereby undergo transition to higher histologic grade. t(12;16) results in fusion of the DDIT3 (CHOP) transcription factor gene on chromosome 12 to the TLS gene on chromosome 16, and the resultant fusion oncoprotein is an activated transcription factor. t(12;16) has not been found in other subtypes of liposarcoma or in other types of myxoid soft tissue tumors. It appears to be relevant therapeutically, in that patients with myxoid or round cell liposarcoma show impressive responses to trabectedin chemotherapy. However, liposarcoma is rare in childhood and virtually unheard of in the first decade of life.
Clear Cell Sarcoma: Malignant Melanoma of Soft Parts
Clear cell sarcomas of the soft tissues resemble cutaneous melanomas histologically, and therefore have been referred to as melanoma of soft parts. Immunohistochemically, the tumors are consistently positive for S-100 protein, usually at least focally for HMB45, microphthalmia transcription factor (MITF), and Melan A. Despite their histologic and immunohistochemical overlaps, clear cell sarcoma and true melanoma are different clinically. Whereas most melanomas are of cutaneous origin, clear cell sarcomas generally present as isolated masses in deep soft tissues, without apparent origin from, or involvement of, skin. Less commonly they arise in the gastrointestinal tract. Most clear cell sarcomas contain a chromosomal translocation, t(12;22)(q13;q12), while those arising in the gastrointestinal tract will more commonly bear the variant t(2;22)(q34;q12). The latter has, however, also been described in a minor subset of soft tissue–based clear cell sarcoma. These translocations have never been reported in cutaneous melanoma and therefore serve as a reliable markers in distinguishing these two tumor types ( Fig. 45-22 ). t(12;22) fuses the ATF1 gene on chromosome 12 with the EWS gene on chromosome 22. ATF1 encodes a transcription factor, and the biologic implications of the translocation are probably similar to those in Ewing sarcoma translocations (see earlier). t(2;22) fuses the CREB1 gene on chromosome 2, a CREB gene family member closely related to ATF1, with the EWSR1 gene.
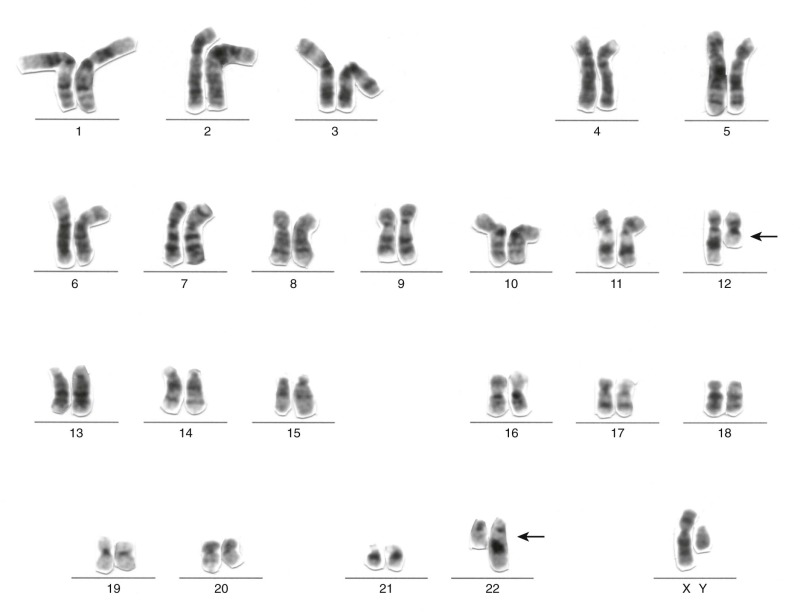
Desmoplastic Small Round Cell Tumor
DRSCTs are aggressive and chemotherapy-resistant neoplasms that arise most commonly from the peritoneum or intraabdominal soft tissues, particularly in adolescent males. They are composed of undifferentiated malignant small round cells in a striking desmoplastic reaction, ensnaring sharply demarcated islands of tumor cells ( Fig. 45-23 ). Almost all cases express an EWSR1-WT1 fusion oncogene resulting from translocation between the chromosome 11 short arm and chromosome 22 long arm. The EWS-WT1 oncoproteins are expressed as several isoforms (see Fig. 45-10 ), each of which is composed of the EWSR1 amino-terminal transactivation region fused to the last three of four zinc fingers at the WT1 carboxyl-terminal end. These oncoproteins result from fusion of EWSR1 exon 7, 8, or 9 to WT1 exon 8. The EWSR1-WT1 fusion typically results in expression of the carboxyl-terminal but not amino-terminal aspect of WT1 in DSRCT, which may be detected by immunohistochemistry using appropriate antibodies (see Fig. 45-23 ). Quantitatively minor secondary transcripts lacking exon 6 of EWSR1 and/or exon 9 of WT1 are also expressed, although the functional relevance of these transcripts is unknown. However, it is worth noting that the usual immunostaining pattern was not observed in an isolated reported case with atypical transcript that lacked WT1 exons 9 and 10. The EWSR1-WT1 oncoprotein retains an alternative splicing site (±KTS) between the third and fourth WT1 zinc fingers (see Fig. 45-10 ). The KTS− isoform regulates genes that are believed to have important biologic roles in DSRCTs, including platelet-derived growth factor-α (PDGFA) and insulin-like growth factor receptor I, whereas the KTS+ isoform regulates a different set of genes. Notably, only the KTS− isoform has shown transforming activity when evaluated in vitro. PDGFA is known to activate potent receptor (platelet-derived growth factor receptor [PDGFR])-mediated mitogenic signaling pathways in fibroblasts, and EWSR1-WT1 might therefore induce desmoplastic proliferation via PDGFA transcriptional upregulation.
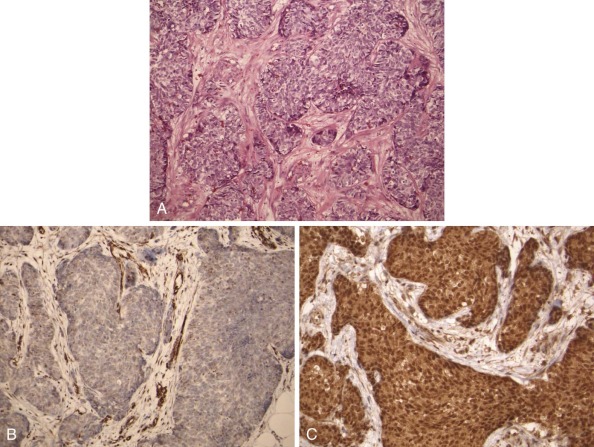
Dermatofibrosarcoma Protuberans
DFSP is a low-grade spindle cell tumor, which can occasionally progress to a more aggressive fibrosarcomatous phase. Most DFSPs contain ring chromosomes composed of sequences from chromosomes 17 and 22 (see Fig. 45-13A ). The ring chromosomes contain multiple copies of a fusion gene, COL1A1-PDGFB, in which COL1A1 (a collagen gene) is contributed from chromosome 17 and PDGFB (platelet-derived growth factor-β gene) from chromosome 22. Alternatively, DFSP, particularly in pediatric patients, occasionally has t(17;22) translocations, resulting in a single copy of the COL1A1-PDGFB fusion gene. The COL1A1-PDGFB oncogene results in overexpression of PDGFB, which is a growth factor that activates platelet-derived growth factor receptor-β (PDGFRB) and PDGFRA. This cytogenetic observation has suggested that patients with inoperable DFSP might benefit from treatment with PDGFR inhibitors such as imatinib, and this hypothesis has been confirmed by impressive clinical responses to PDGFRB therapeutic inhibition with imatinib. COL1A1-PDGFB oncogenic fusion is also seen in giant cell fibroblastoma (GCF), a pediatric neoplasm closely related to DFSP. Studies of GCF and composite GCF/DFSP cases have shown the presence of a single translocation t(17;22) and the resultant COL1A1-PDGFB fusion, in the GCF component, with acquisition of additional copies of the oncogene being associated with progression to DFSP.
Desmoid Tumors
Desmoid tumors, also known as deep fibromatoses, contain various genetic aberrations, including the APC (adenomatous polyposis coli) gene or CTNNB1 mutations, and trisomies for chromosomes 8 or 20. Cytogenetic deletions of the chromosome 5 long arm are seen in occasional desmoids, resulting in loss of the APC tumor suppressor gene. However, the most common mutations, particularly in nonfamilial desmoid tumors, are activating CTNNB1 mutations, which are found in at least 50% of cases. Both APC inactivating and β-catenin activating mutations result in stabilization and resultant overexpression, of the β-catenin protein with roles in cell proliferation, motility, and differentiation. This overexpression of β-catenin can be detected immunohistochemically in a nuclear distribution. In a retrospective analysis of primary desmoid tumor, the precise β-catenin mutation type was strongly predictive of recurrence, with S45F being associated in multivariate analysis with decreased time to recurrence and overall percentage recurrence. The cytogenetic aberrations in most desmoid tumors, particularly the trisomies 8 and 20, are mechanisms of progression and are acquired subsequent to the APC or CTNNB1 mutations. Interestingly, an as yet unexplained association of desmoidal fibromatosis in patients with gastrointestinal stromal tumor (GIST) has been reported.
Infantile Fibrosarcoma
Infantile (also congenital/infantile) fibrosarcomas characteristically present within the first year of life. These are tumors composed of plump fibroblast-like cells (see Fig. 45-16 ), which often show high mitotic activity, and feature trisomies of chromosomes 8, 11, 17, and 20. This same group of trisomies occur in the histologically identical pediatric renal tumor, congenital cellular mesoblastic nephroma (see Fig. 45-18 ). Most infantile fibrosarcomas and congenital cellular mesoblastic nephromas also contain a diagnostic chromosomal translocation, t(12;15)(p13;q26), which is cryptic when studied by traditional cytogenetic banding methods (see Fig. 45-2 ). A complex three-way t(12;15;19) translocation has also been reported in infantile fibrosarcoma. t(12;15)(p13;q26) results in fusion of the TEL gene on chromosome 12 to the NTRK3 receptor tyrosine kinase gene on chromosome 15, producing constitutive tyrosine kinase activation. Although challenging to detect by banding methods, the t(12;15) translocation is demonstrated readily by FISH with a dual-color break-apart TEL probe (see Fig. 45-2 ) or RT-PCR assay.
Inflammatory Myofibroblastic Tumor
Inflammatory myofibroblastic tumors, belonging to the group of inflammatory pseudotumors, are relatively rare tumors occurring primarily in children and young adults. They are composed of myofibroblastic cells admixed with an infiltrate of lymphocytes and plasma cells (see Fig. 45-17 ). The inflammatory component of these tumors is nonneoplastic and therefore lacks cytogenetic aberrations, whereas the myofibroblastic cells often contain clonal chromosomal aberrations involving rearrangement and oncogenic activation of the ALK receptor tyrosine kinase gene at chromosome band 2p23. The ALK oncogenes cause constitutive activation of the ALK kinase by enhanced oligomerization resulting from fusion of the ALK kinase domain to the oligomerization domain of the partner gene. ALK oncogenic activation is associated with strong, immunohistochemically detectable ALK expression in the inflammatory myofibroblastic tumor spindle cells in about 50% of cases (see Fig. 45-17 ). The ALK immunohistochemical staining pattern reflects the fusion type, insofar as fusion of ALK with most of the various partners (TPM3, TPM4, CARS, CLTC, SEC31A (SEC31L1), PPFIBP1, ALO17) produces cytoplasmic staining, whereas ALK-RANBP2 fusion produces nuclear membrane–associated reactivity. These immunohistochemical findings can distinguish inflammatory myofibroblastic tumor from its histologic mimics, but, given the considerable rate of nonimmunoreactivity, demonstration of ALK rearrangement is especially helpful in confirming the diagnosis. An aggressive form of IMT characterized by round cell or epithelioid morphology is described that typically arises intraabdominally in male patients and shows in virtually all cases ALK immunoreactivity in a nuclear, or less commonly, cytoplasmic and perinuclear distribution.
ALK-rearranged inflammatory myofibroblastic tumors are effectively treated with ALK inhibitor crizotinib; however, the emergence of secondary resistance can limit efficacy.
Gastrointestinal Stromal Tumor
Most adult GISTs contain activating mutations of the KIT or PDGFRA oncogenes or rarely BRAF. These mutations have been targeted with considerable success using the KIT and PDGFRA inhibitor imatinib (Gleevec) and second-line tyrosine kinase inhibitors in the context of resistant disease. In addition, germline (inherited) KIT mutations are responsible for rare syndromes of familial, multifocal GISTs. However, because most pediatric GISTs do not contain KIT or PDGFRA mutations they have been termed wild-type GISTs, and these predominate as gastric tumors in prepubescent girls. In keeping with this, children with metastatic GISTs show only very limited benefit from the KIT-PDGFRA kinase inhibitor therapies. Moreover, pediatric GISTs lack the typical sequential cytogenetic deletions that seem to drive genetic and clinical progression in adult GISTs. Largely through an appreciation of the occurrence of GIST as a component of Carney-Stratakis syndrome/dyad, which is the dominantly inherited predisposition to paraganglioma and GIST, underpinned by germline inactivation of subunits B, C or D of succinate dehydrogenase (SDH), it has become evident that deficiency in cellular respiration in fact appears to provide the pathologic basis to all pediatric/wild-type GISTs, despite the low incidence of SDH mutation in such tumors. Germline SDHA mutations have been described in isolated cases of paraganglioma and adult wild-type GIST. Inactivation of any of the four subunits A, B, C, or D of SDH leads to enzyme complex destabilization and inactivation. Immunohistochemical staining for the B subunit of succinate dehydrogenase (SDHB) provides a surrogate marker for SDH function and is characteristically negative in all pediatric/wild-type GISTs. On this basis, a proposal has been made that GISTs no longer be classed as “mutant” and “wild-type” based on receptor tyrosine kinase mutation but rather be designated type 1 and type 2 as SDHB-positive and SDHB-negative, respectively. Although a strong association with neurofibromatosis type 1 (NF1) exists, in this particular context GISTs usually arise only in adulthood.
Malignant Peripheral Nerve Sheath Tumors
Benign peripheral nerve sheath tumors and malignant peripheral nerve sheath tumors (MPNSTs) are frequent complications in patients with hereditary neurofibromatosis syndromes. These syndromes are the most common tumor predisposition syndromes, affecting 1 in 3500 individuals worldwide. Neurofibromas and malignant peripheral nerve sheath tumors are common in those NF1, whereas benign schwannomas are common in neurofibromatosis type 2 (NF2, central neurofibromatosis). Characterization of the neurofibromatosis syndrome genes has shed substantial light on the pathogenesis of peripheral nerve sheath tumors. The NF1 and NF2 genes are located on chromosomes 17 and 22, respectively, and both these genes encode tumor suppressor proteins that normally constrain cellular proliferation. NF1 protein tumor suppressor mechanisms involve regulation of RAS GTPase activity, with NF1 gene deletion therefore resulting in constitutive RAS activation, suggesting that therapeutics targeting RAS (or downstream signaling intermediates such as RAF and MEK-MAPK) might be useful for clinical management of MPNSTs and other NF1-associated cancers. MPNSTs often have NF1 gene deletions, which can be demonstrated by FISH assay. The NF1 gene aberrations are accompanied by a generally complex karyotype, suggesting that genetic instability plays a prominent role in the development of MPNSTs. Notably, NF1 gene deletions can be shown in only the Schwann cell component of neurofibromas. This observation supports the view that neurofibromas are clonal Schwann cell neoplasms, whereas the other admixed cell lineages—including fibroblasts, mast cells, and perineural cells—are reactive.
Recent studies demonstrated that the evolution of benign peripheral nerve sheath tumors to MPNST is accompanied predominantly by loss of expression of a large number of genes, including, in a vast majority of cases, inactivation of TP53 with associated downregulation of the pro-apoptotic miR-34a. MiR-10b, which specifically targets NF1, is upregulated in NF1-associated MPNSTs. Homozygous loss of CDKN2A is also associated with malignant transformation, whereas high-resolution copy number profiling has shown, among others, recurrent gains of PDGFRA, MET, HGF, TP73, EGFR, TERT, MYC, and IGF1R and losses of NF1, p16 INK4A /CDKN2A, RB1, and TP53, providing potential basis for novel therapeutic agents in this therapeutically challenging sarcoma.
Neuroblastoma
Most neuroblastomas have distinctive cytogenetic features that correlate with their clinical behavior. Favorable prognosis neuroblastomas, which respond well to chemotherapy and can even undergo spontaneous regression, generally feature near-triploid karyotypes without 1p deletion or MYCN amplification. Unfavorable prognosis neuroblastomas ( Fig. 45-24 ), by contrast, feature near-diploid or near-tetraploid karyotypes, often accompanied by 1p deletion, 17q amplification, and/or MYCN amplification, whereas deletions of 3p and 11q are reportedly predictive of metastasis. In essence, gains of whole chromosomes are more typical of low- or intermediate-risk neuroblastoma whereas segmental chromosomal aberrations are more commonly seen in high-risk cases. MYCN amplification, typically manifested as double-minute chromosomes (see Figs. 45-5 and 45-6 ), is arguably the most ominous of the adverse genetic markers. MYCN -amplified neuroblastomas are rarely curable, although complete remission can be achieved through intensive myeloablative chemotherapy. Therefore genetic parameters can be useful adjuncts for determining appropriate intensity of therapy, particularly for those children whose prognoses are not clear based on clinical parameters alone. Cytogenetic analysis of neuroblastoma has been difficult, however, because the tumor cells from most favorable prognosis neuroblastomas fail to divide in culture. MYCN amplification and chromosome 1p or 11q deletion and 17q gain can be demonstrated in interphase cells by FISH or CISH (see Fig. 45-6 ), obviating the need for tumor cell culture. It remains unclear whether one or more conventional tumor suppressor genes are targeted by the 1p deletions found in most poor-prognosis neuroblastomas. However, several microRNAs in the critical 1p deletion region function to maintain neuroblastoma survival and activate MYCN transcription. ALK kinase domain mutations and gene amplifications have been demonstrated in hereditary neuroblastoma that may otherwise be underscored by PHOX2B germline mutation. About 15% of sporadic neuroblastomas also show aberrations of ALK, suggesting that ALK inhibitors might be useful therapeutically in neuroblastoma. SNP variations at 6p22.3, 2q35 (the BARD1 gene), and copy number aberration at 1q21 (the NBPF23 gene) are associated with increased risk for development of neuroblastoma but without further elucidation of the likely mechanisms involved biologically.
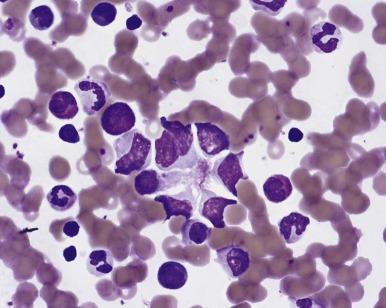
Rhabdoid Tumor
Malignant rhabdoid tumors generally have dismal outcomes, particularly those presenting in infancy, and most cases, whether arising in soft tissues, kidney, or CNS (where they are known as atypical teratoid/rhabdoid tumors), have deletions of the chromosome 22 long arm, targeting the SMARCB1 ( INI1) tumor suppressor gene. Biallelic SMARCB1 mutation is present in the vast majority of rhabdoid tumors, with frequent truncating mutations occurring. In a small number of cases, instead of SMARCB1, the SMARCA4 (BRG1) gene is inactivated. SMARCB1 encodes a member of the SWI/SNF protein complex involved in chromatin remodeling. Chromosome 22 deletion is often the only detectable cytogenetic aberration, suggesting that SMARCB1 inactivation is an early oncogenic event in these remarkably aggressive tumors, which are classically diploid and genomically stable. Indeed, sequencing studies have revealed a remarkably simple tumor genome otherwise with virtually no oncogenic mutations identifed. Additional evidence of an essential tumorigenic role includes the finding of germline INI1 mutations in some individuals with rhabdoid tumors and the development of rhabdoid tumor models in mice with inactivating SMARCB1 mutations. Notably, germline SMARCB1 mutations are not restricted to rhabdoid tumors but have been implicated also in familial schwannomatosis and in nonrhabdoid CNS tumors, including medulloblastoma. and multiple meningiomas SMARCB1 inhibits cyclin D1 expression by recruiting a histone deacetylase 1 complex to the CCND1 (cyclin D1) promoter, resulting in G1 cell cycle arrest. The relevance of cyclin D1 in SMARCB1 -mediated tumorigenesis is underscored by the observation that rhabdoid tumors develop in SMARCB1+/− mice expressing cyclin D1 whereas SMARCB1+/− mice with cyclin D1 deficiency (cyclin D1−/−) do not develop rhabdoid tumors. These observations suggest that drugs targeting cyclin D1 might be relevant for rhabdoid tumors, and clinical trials testing this are planned.
Recent work has unraveled an epigenetic antagonism between SMARCB1 and Polycombs of the PRC2 complex. The Polycomb proteins are transcriptional repressors that modulate chromatin structure to silence gene expression, and they are key regulators of cell fate transitions. Their function frequently becomes deregulated in cancer. The Polycombs have been shown to be required for the repression of differentiation genes in stem cells so that this repression of differentiation might be facilitated by loss of the PRC2 antagonist SMARCB1.
Rhabdoid tumors are characteristically composed of cells with vesicular nuclei and prominent nucleoli, with the nucleus often being pushed to an eccentric location within the cell by a dense intracytoplasmic inclusion (see Fig. 45-9 ), which, as seen by electron microscopy, consists of a tightly arranged whorl of intermediate filaments. These filaments stain nonspecifically for various markers, giving the tumor a polyphenotypic appearance. Absence of SMARCB1 expression in the tumor cells but not the normal stromal support nuclei, as is readily demonstrable by immunohistochemistry, is useful for diagnosing rhabdoid tumor (see Fig. 45-9 ).
Alveolar Soft Part Sarcoma
Alveolar soft part sarcoma is a rare tumor, occurring mostly in adolescents and young adults, with a predilection for involvement of soft tissues in the head and neck region. However, other soft tissue and even hollow viscera may be involved. Characterized by a distinctive morphology, with nested or alveolar-like growth, the tumor cells are epithelioid, with abundant clear to eosinophilic cytoplasm, sharply defined cellular borders, and diastase-resistant, periodic acid–Schiff (PAS)-positive intracytoplasmic crystals ( Fig. 45-25 ), which on electron microscopic examination are rhomboidal. Alveolar soft part sarcoma generally exhibits indolent behavior but nonetheless has a high risk for late metastases and indeed represents the sarcoma most likely to metastasize to the CNS. There are no histologic features to predict clinical behavior. The classic cytogenetic feature of ASPS is t(X;17)(p11;q25), producing fusion of the ASPSCR1 and TFE3 genes. This same translocation is seen in a subset of pediatric renal cell carcinomas, with the distinct difference that the ASPS -related translocation is un balanced and involves gain of Xp telomeric to TFE3 and loss of 17q sequence telomeric to q25 while the renal carcinoma–associated translocation is balanced. The ASPSCR1-TFE3 fusion protein induces strong expression of MET tyrosine kinase in tumor cells. Antibody raised to the carboxyl terminus of TFE3 produces strong nuclear reactivity in ASPSCR1-TFE3 fusion-positive tumors.
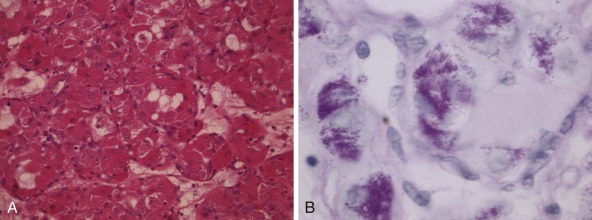
Nonmesenchymal Solid Tumors
Renal Tumors
Most pediatric renal tumors contain characteristic cytogenetic aberrations. Deletion of 11p is a well-known aberration in Wilms tumor, but several other aberrations, including extra copies of chromosome 12, are more frequent and have apparent prognostic relevance, as does LOH of 1p and 16q. Another pediatric renal tumor with consistent cytogenetic aberrations is congenital cellular mesoblastic nephroma, in which various chromosomal trisomies and oncogenic fusion of the TEL and NTRK3 proteins are observed reliably. More recently, it has emerged that translocation-associated carcinomas make up a majority of pediatric renal carcinomas. In addition, neuroblastoma patients are at hugely increased risk (329-fold) of developing oncocytoid renal carcinoma ; however, pediatric renal carcinoma may also follow certain sarcomas.
Pediatric Renal Cell Carcinomas with Xp11 or 6p21 Translocations.
Pediatric renal cell carcinomas are uncommon and they generally have a papillary morphology, accompanied by translocations involving chromosomes X or 6. By comparison, adult papillary renal cancers typically have a distinctive profile of chromosomal trisomies, although a rare few contain the same translocations seen in pediatric renal cancers. The unifying theme for the pediatric carcinoma translocations is that they target various members of the MiT family of transcription factors. These include t(X;1)(p11;q21), resulting in fusion of PRCC (at chromosome band 1q21) and the MiT family member TFE3 (at chromosome band Xp11). There are variants of this translocation, including t(X;17)(p11;q25), in which TFE3 is fused with the ASPSCR1 gene at chromosome band 17q25. Also involving an MiT family member is t(6;11)(p21;q13), which fuses TFEB (at chromosome band 6p21) with the Alpha gene (at chromosome band 11q13). The TFEB -rearranged tumors more consistently express melanocytic markers HMB45 and Melan A than do TFE3 -translocated cases. TFE3 and TFEB immunostains, respectively, show specific reactivity in a nuclear distribution in the correspondingly rearranged cases but may rarely be negative in the presence of molecular proof of a translocation, and a robust FISH assay has also been developed to confirm rearrangement of TFEB . Intriguingly, however, whereas ASPS cases with ASPSCR1-TFE3 fusion were found to uniformly express cathepsin K, a target of MiTF, and the majority of PRCC-TFE3 rearranged carcinomas did similarly, the ASPSCR1-TFE3 fusion-positive carcinomas were all negative for cathepsin K, a feature that might be exploited in certain diagnostic settings.
Wilms Tumor.
Wilms tumors are the most common type of renal cancer in children. They typically contain primitive blastemal cells that differentiate into tubular epithelial, glomerular, and/or mesenchymal populations. The classic triphasic Wilms tumor contains an admixture of blastemal, epithelial, and mesenchymal components ( Fig. 45-26 ), and all three cell types may contain the same clonal chromosomal aberrations. Various genetic alterations are found in subsets of Wilms tumors, including trisomies 6, 8, 12, and 18, and deletions of 11p13 (see later). Deletions of 11p15, 1p, and 16q bode ill in patients with low-stage favorable histology tumors and 1q gains are associated with relapse. These can all readily be tested on interphase nuclei by FISH assay (see Table 45-1 ).

